

Key Insights
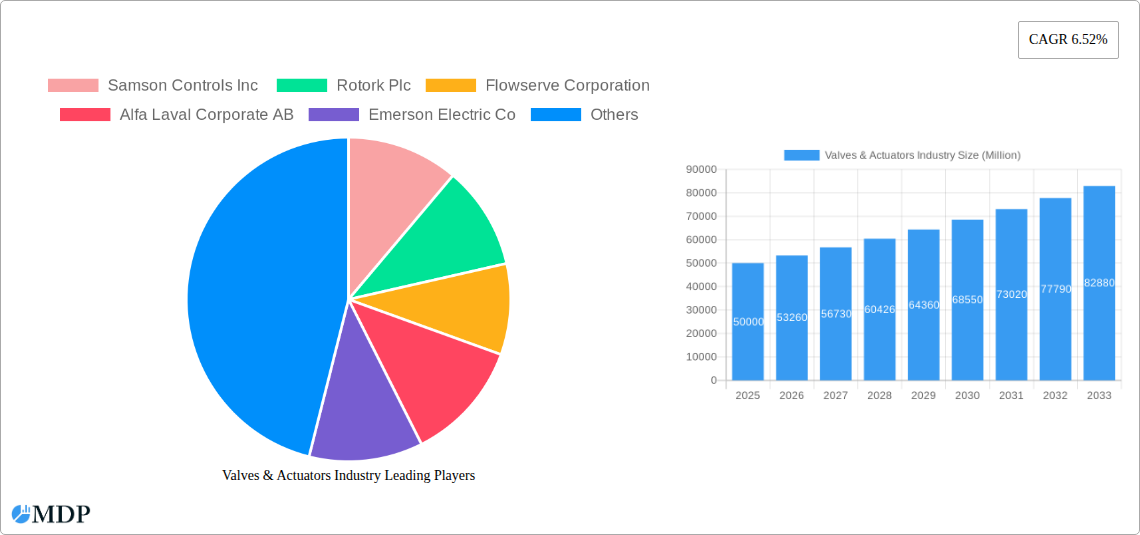
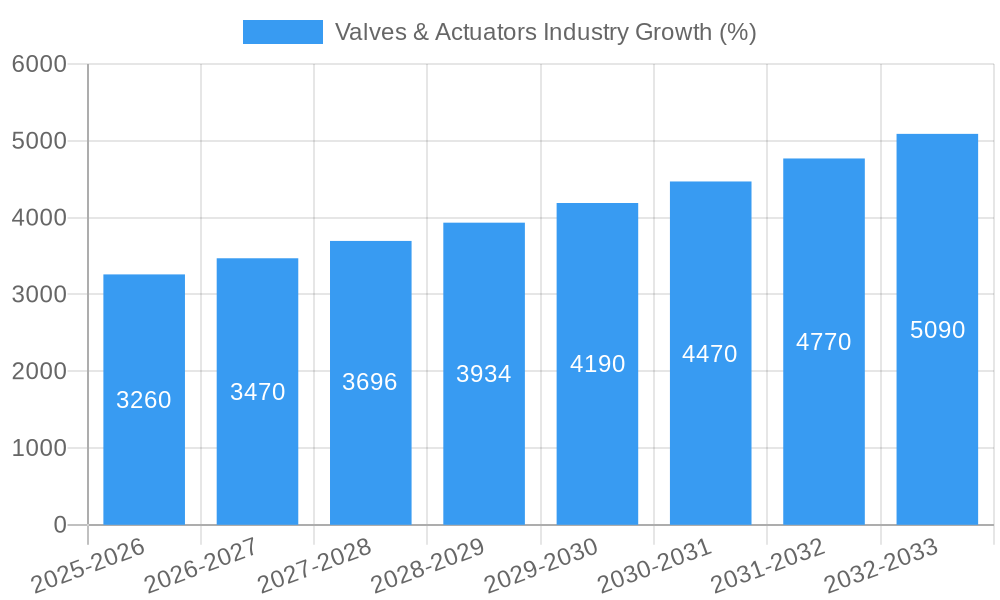
The global Valves & Actuators market, currently valued at approximately $XX million (estimated based on provided CAGR and market trends), is projected to experience robust growth, with a Compound Annual Growth Rate (CAGR) of 6.52% from 2025 to 2033. This expansion is fueled by several key drivers. Increasing investments in infrastructure development, particularly in the oil & gas, power generation, and water & wastewater sectors, are significantly boosting demand. Furthermore, the rising adoption of automation and smart technologies across various industries is driving the need for advanced valve and actuator systems that enhance efficiency, improve safety, and enable remote monitoring and control. Stringent environmental regulations concerning emissions and resource management are also prompting industries to upgrade their existing equipment with more efficient and environmentally friendly solutions. Growth is segmented across valve types (ball, butterfly, gate/globe/check, plug, control, and others), with ball and butterfly valves currently dominating the market due to their versatility and cost-effectiveness. The end-user vertical breakdown reveals strong demand from oil & gas, power generation, and chemical industries, reflecting their reliance on sophisticated process control systems. However, market growth faces certain restraints, including fluctuating raw material prices, supply chain disruptions, and the high initial investment costs associated with advanced actuator technologies. Despite these challenges, the long-term outlook for the Valves & Actuators market remains positive, driven by ongoing industrialization, technological advancements, and increasing emphasis on operational efficiency and sustainability.
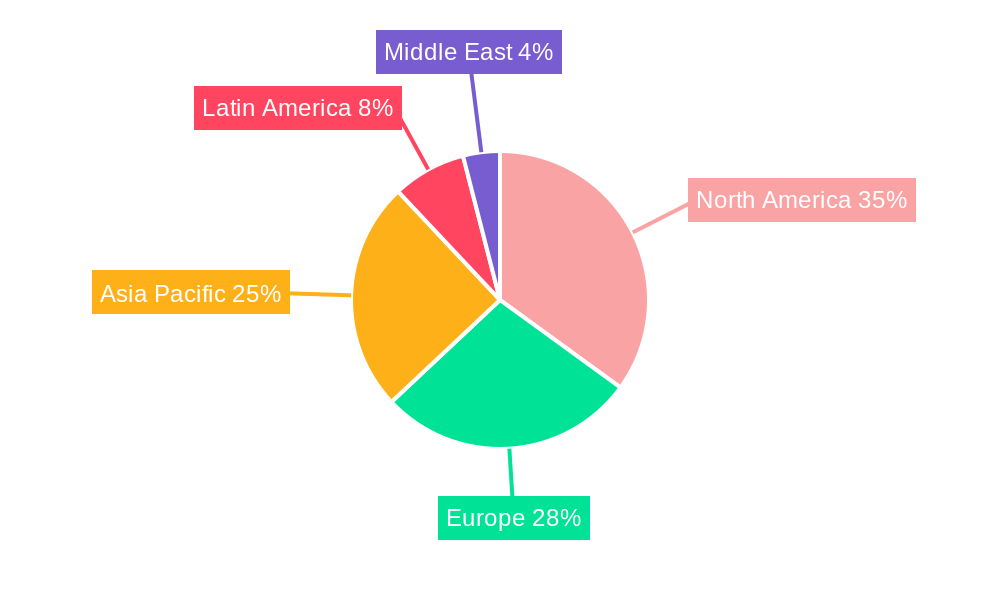
The competitive landscape is characterized by a mix of established multinational corporations and specialized regional players. Key players such as Samson Controls Inc, Rotork Plc, Flowserve Corporation, Alfa Laval Corporate AB, Emerson Electric Co, IMI Critical Engineering, Metso Oyj, Crane Co, Schlumberger Limited, and KITZ Corporation are actively engaged in product innovation, strategic partnerships, and geographic expansion to maintain their market share. Regional variations exist in market growth, with North America and Europe currently holding larger market shares due to established industrial infrastructure and high adoption rates. However, the Asia-Pacific region is expected to witness significant growth over the forecast period driven by rapid industrialization and infrastructure development in emerging economies. This competitive landscape and regional disparity will shape the market's trajectory in the coming years.
Valves & Actuators Industry Market Report: A Comprehensive Analysis (2019-2033)
This comprehensive report provides an in-depth analysis of the global Valves & Actuators industry, offering invaluable insights for stakeholders seeking to navigate this dynamic market. With a study period spanning 2019-2033, a base year of 2025, and a forecast period of 2025-2033, this report delivers crucial data and actionable intelligence. The global market size is estimated at $XX Million in 2025 and is projected to reach $XX Million by 2033, exhibiting a CAGR of XX%. This report analyzes key segments including Ball, Butterfly, Gate/Globe/Check, Plug, and Control valves, across diverse end-user verticals such as Oil & Gas, Power Generation, Chemical, Water & Wastewater, and Mining. Leading players like Samson Controls Inc, Rotork Plc, Flowserve Corporation, and more are profiled, providing a competitive landscape overview.
Valves & Actuators Industry Market Dynamics & Concentration
The Valves & Actuators market is characterized by moderate concentration, with the top 10 players holding an estimated XX% market share in 2025. Innovation, driven by the need for enhanced efficiency, safety, and automation, is a key dynamic. Stringent regulatory frameworks concerning emissions and safety standards significantly impact market growth. Product substitutes, such as advanced digital control systems, pose both a threat and an opportunity. End-user trends, particularly towards automation and digitalization in industrial processes, are reshaping market demand. The historical period (2019-2024) witnessed XX M&A deals, indicating a trend of consolidation within the sector.
- Market Concentration: Top 10 players hold approximately XX% market share (2025).
- Innovation Drivers: Automation, digitalization, enhanced safety features.
- Regulatory Frameworks: Stringent emission and safety standards drive innovation and influence market growth.
- Product Substitutes: Advanced digital control systems and alternative automation technologies.
- End-User Trends: Increasing demand for automation and remote monitoring solutions.
- M&A Activities: XX mergers and acquisitions observed during 2019-2024.
Valves & Actuators Industry Industry Trends & Analysis
The Valves & Actuators market is experiencing robust growth, driven by increasing industrial automation across various sectors. Technological disruptions, such as the adoption of smart valves and IoT-enabled solutions, are transforming the industry landscape. Consumer preferences are shifting towards energy-efficient, reliable, and sustainable solutions. Competitive dynamics are intense, with players focusing on technological advancements, product diversification, and strategic partnerships to gain a competitive edge. Market penetration of smart valves is projected to reach XX% by 2033.
The industry is witnessing a significant shift towards advanced materials, enabling valves to withstand extreme conditions in diverse industrial applications. Furthermore, the integration of predictive maintenance technologies, leveraging data analytics and AI, allows for proactive maintenance scheduling, reducing downtime and improving operational efficiency. The rising demand from the oil and gas sector, driven by exploration and production activities, coupled with growing investments in infrastructure development across various regions, contribute to market expansion. These factors, combined with supportive government policies, fuel the market's impressive CAGR.
Leading Markets & Segments in Valves & Actuators Industry
The Oil & Gas sector represents the dominant end-user vertical, accounting for approximately XX% of the global market in 2025. Geographically, North America and Europe currently hold significant market shares, driven by robust industrial infrastructure and substantial investments in energy and chemical sectors. Within valve types, Ball and Butterfly valves comprise the largest segments due to their versatility and cost-effectiveness.
- Dominant Region: North America and Europe.
- Key Drivers (North America): Robust industrial infrastructure, significant investments in energy sector.
- Key Drivers (Europe): Stringent environmental regulations, focus on energy efficiency.
- Dominant End-User Vertical: Oil & Gas (XX% market share in 2025)
- Dominant Valve Types: Ball and Butterfly valves.
- Key Drivers (Oil & Gas): Increased exploration and production activities, rising energy demand.
Valves & Actuators Industry Product Developments
Recent product innovations focus on smart valves with integrated sensors and communication capabilities, enabling remote monitoring and predictive maintenance. These advancements improve operational efficiency, reduce maintenance costs, and enhance safety. The integration of artificial intelligence and machine learning further enhances valve performance and predictive capabilities, providing significant competitive advantages. These developments are tailored to meet the evolving needs of various end-user industries, driving market growth.
Key Drivers of Valves & Actuators Industry Growth
The growth of the Valves & Actuators industry is fueled by several factors: the increasing automation across various industries, particularly in Oil & Gas, Power Generation, and Chemical processing, demands for more advanced and reliable valve solutions. Stringent environmental regulations and increasing awareness regarding energy efficiency drive the adoption of smart valves and more efficient designs. Investments in infrastructure development, particularly in emerging economies, contribute significantly to market growth.
Challenges in the Valves & Actuators Industry Market
The industry faces challenges such as supply chain disruptions, particularly concerning raw materials and specialized components. Fluctuating commodity prices and geopolitical instability pose risks to the industry's profitability. Intense competition among established players and the emergence of new entrants necessitates continuous innovation and cost optimization to maintain market share. Regulatory compliance and meeting evolving safety standards add to the operational complexities and costs.
Emerging Opportunities in Valves & Actuators Industry
The industry presents significant opportunities in the form of technological breakthroughs, such as the development of advanced materials and improved actuator technologies, providing higher efficiency, durability and performance. Strategic partnerships and collaborations among companies enable access to new technologies and markets. Expanding into emerging economies with growing industrialization presents substantial potential for market expansion. The adoption of digital twins and predictive analytics offers enhanced optimization and cost-saving measures.
Leading Players in the Valves & Actuators Industry Sector
- Samson Controls Inc
- Rotork Plc
- Flowserve Corporation
- Alfa Laval Corporate AB
- Emerson Electric Co
- IMI Critical Engineering
- Metso Oyj
- Crane Co
- Schlumberger Limited
- KITZ Corporation
Key Milestones in Valves & Actuators Industry Industry
- 2020: Introduction of smart valve technology by Emerson Electric Co.
- 2021: Acquisition of XYZ company by Rotork Plc, expanding its market presence.
- 2022: Launch of a new line of energy-efficient valves by Flowserve Corporation.
- 2023: Implementation of new safety standards impacting the industry's operations.
- 2024: Increased adoption of IoT-enabled valves across various sectors.
Strategic Outlook for Valves & Actuators Industry Market
The Valves & Actuators market is poised for continued growth, driven by technological advancements, increasing automation, and expanding industrial applications. Strategic opportunities lie in investing in R&D, developing innovative and sustainable products, and establishing strategic partnerships. Focusing on digitalization and data analytics will be crucial for enhancing operational efficiency and gaining a competitive edge. Expansion into emerging markets and leveraging the potential of Industry 4.0 technologies will contribute to the sector's long-term success.
Valves & Actuators Industry Segmentation
-
1. Type
- 1.1. Hydraulic
- 1.2. Pneumatic
- 1.3. Electric
-
2. End-user Vertical
- 2.1. Oil & Gas
- 2.2. Power Generation
- 2.3. Chemical
- 2.4. Water & Wastewater
- 2.5. Mining
- 2.6. Other End User Verticals
-
3. Type
- 3.1. Ball
- 3.2. Butterfly
- 3.3. Gate/Globe/Check
- 3.4. Plug
- 3.5. Control
- 3.6. Other Types
-
4. End-user Vertical
- 4.1. Oil & Gas
- 4.2. Power Generation
- 4.3. Chemical
- 4.4. Water & Wastewater
- 4.5. Mining
- 4.6. Other End User Verticals
Valves & Actuators Industry Segmentation By Geography
-
1. North America
- 1.1. United States
- 1.2. Canada
-
2. Europe
- 2.1. United Kingdom
- 2.2. Germany
- 2.3. France
- 2.4. Italy
- 2.5. Rest of Europe
-
3. Asia Pacific
- 3.1. China
- 3.2. Japan
- 3.3. India
- 3.4. South Korea
- 3.5. Rest of Asia Pacific
-
4. Rest of the World
- 4.1. Latin America
- 4.2. Middle East
- 5. North America
- 6. Europe
- 7. Asia Pacific
- 8. Latin America
- 9. Middle East
Valves & Actuators Industry REPORT HIGHLIGHTS
| Aspects | Details |
|---|---|
| Study Period | 2019-2033 |
| Base Year | 2024 |
| Estimated Year | 2025 |
| Forecast Period | 2025-2033 |
| Historical Period | 2019-2024 |
| Growth Rate | CAGR of 6.52% from 2019-2033 |
| Segmentation |
|
Table of Contents
- 1. Introduction
- 1.1. Research Scope
- 1.2. Market Segmentation
- 1.3. Research Methodology
- 1.4. Definitions and Assumptions
- 2. Executive Summary
- 2.1. Introduction
- 3. Market Dynamics
- 3.1. Introduction
- 3.2. Market Drivers
- 3.2.1. ; Technological Advancements Propelling Application of Smart Valves and Actuators; Increase in Demand for Desalination Activities
- 3.3. Market Restrains
- 3.3.1. ; Stagnant Industrial Growth in Developed Countries
- 3.4. Market Trends
- 3.4.1. Oil and Gas Industry is Expected to Witness Significant Growth
- 4. Market Factor Analysis
- 4.1. Porters Five Forces
- 4.2. Supply/Value Chain
- 4.3. PESTEL analysis
- 4.4. Market Entropy
- 4.5. Patent/Trademark Analysis
- 5. Global Valves & Actuators Industry Analysis, Insights and Forecast, 2019-2031
- 5.1. Market Analysis, Insights and Forecast - by Type
- 5.1.1. Hydraulic
- 5.1.2. Pneumatic
- 5.1.3. Electric
- 5.2. Market Analysis, Insights and Forecast - by End-user Vertical
- 5.2.1. Oil & Gas
- 5.2.2. Power Generation
- 5.2.3. Chemical
- 5.2.4. Water & Wastewater
- 5.2.5. Mining
- 5.2.6. Other End User Verticals
- 5.3. Market Analysis, Insights and Forecast - by Type
- 5.3.1. Ball
- 5.3.2. Butterfly
- 5.3.3. Gate/Globe/Check
- 5.3.4. Plug
- 5.3.5. Control
- 5.3.6. Other Types
- 5.4. Market Analysis, Insights and Forecast - by End-user Vertical
- 5.4.1. Oil & Gas
- 5.4.2. Power Generation
- 5.4.3. Chemical
- 5.4.4. Water & Wastewater
- 5.4.5. Mining
- 5.4.6. Other End User Verticals
- 5.5. Market Analysis, Insights and Forecast - by Region
- 5.5.1. North America
- 5.5.2. Europe
- 5.5.3. Asia Pacific
- 5.5.4. Rest of the World
- 5.5.5. North America
- 5.5.6. Europe
- 5.5.7. Asia Pacific
- 5.5.8. Latin America
- 5.5.9. Middle East
- 5.1. Market Analysis, Insights and Forecast - by Type
- 6. North America Valves & Actuators Industry Analysis, Insights and Forecast, 2019-2031
- 6.1. Market Analysis, Insights and Forecast - by Type
- 6.1.1. Hydraulic
- 6.1.2. Pneumatic
- 6.1.3. Electric
- 6.2. Market Analysis, Insights and Forecast - by End-user Vertical
- 6.2.1. Oil & Gas
- 6.2.2. Power Generation
- 6.2.3. Chemical
- 6.2.4. Water & Wastewater
- 6.2.5. Mining
- 6.2.6. Other End User Verticals
- 6.3. Market Analysis, Insights and Forecast - by Type
- 6.3.1. Ball
- 6.3.2. Butterfly
- 6.3.3. Gate/Globe/Check
- 6.3.4. Plug
- 6.3.5. Control
- 6.3.6. Other Types
- 6.4. Market Analysis, Insights and Forecast - by End-user Vertical
- 6.4.1. Oil & Gas
- 6.4.2. Power Generation
- 6.4.3. Chemical
- 6.4.4. Water & Wastewater
- 6.4.5. Mining
- 6.4.6. Other End User Verticals
- 6.1. Market Analysis, Insights and Forecast - by Type
- 7. Europe Valves & Actuators Industry Analysis, Insights and Forecast, 2019-2031
- 7.1. Market Analysis, Insights and Forecast - by Type
- 7.1.1. Hydraulic
- 7.1.2. Pneumatic
- 7.1.3. Electric
- 7.2. Market Analysis, Insights and Forecast - by End-user Vertical
- 7.2.1. Oil & Gas
- 7.2.2. Power Generation
- 7.2.3. Chemical
- 7.2.4. Water & Wastewater
- 7.2.5. Mining
- 7.2.6. Other End User Verticals
- 7.3. Market Analysis, Insights and Forecast - by Type
- 7.3.1. Ball
- 7.3.2. Butterfly
- 7.3.3. Gate/Globe/Check
- 7.3.4. Plug
- 7.3.5. Control
- 7.3.6. Other Types
- 7.4. Market Analysis, Insights and Forecast - by End-user Vertical
- 7.4.1. Oil & Gas
- 7.4.2. Power Generation
- 7.4.3. Chemical
- 7.4.4. Water & Wastewater
- 7.4.5. Mining
- 7.4.6. Other End User Verticals
- 7.1. Market Analysis, Insights and Forecast - by Type
- 8. Asia Pacific Valves & Actuators Industry Analysis, Insights and Forecast, 2019-2031
- 8.1. Market Analysis, Insights and Forecast - by Type
- 8.1.1. Hydraulic
- 8.1.2. Pneumatic
- 8.1.3. Electric
- 8.2. Market Analysis, Insights and Forecast - by End-user Vertical
- 8.2.1. Oil & Gas
- 8.2.2. Power Generation
- 8.2.3. Chemical
- 8.2.4. Water & Wastewater
- 8.2.5. Mining
- 8.2.6. Other End User Verticals
- 8.3. Market Analysis, Insights and Forecast - by Type
- 8.3.1. Ball
- 8.3.2. Butterfly
- 8.3.3. Gate/Globe/Check
- 8.3.4. Plug
- 8.3.5. Control
- 8.3.6. Other Types
- 8.4. Market Analysis, Insights and Forecast - by End-user Vertical
- 8.4.1. Oil & Gas
- 8.4.2. Power Generation
- 8.4.3. Chemical
- 8.4.4. Water & Wastewater
- 8.4.5. Mining
- 8.4.6. Other End User Verticals
- 8.1. Market Analysis, Insights and Forecast - by Type
- 9. Rest of the World Valves & Actuators Industry Analysis, Insights and Forecast, 2019-2031
- 9.1. Market Analysis, Insights and Forecast - by Type
- 9.1.1. Hydraulic
- 9.1.2. Pneumatic
- 9.1.3. Electric
- 9.2. Market Analysis, Insights and Forecast - by End-user Vertical
- 9.2.1. Oil & Gas
- 9.2.2. Power Generation
- 9.2.3. Chemical
- 9.2.4. Water & Wastewater
- 9.2.5. Mining
- 9.2.6. Other End User Verticals
- 9.3. Market Analysis, Insights and Forecast - by Type
- 9.3.1. Ball
- 9.3.2. Butterfly
- 9.3.3. Gate/Globe/Check
- 9.3.4. Plug
- 9.3.5. Control
- 9.3.6. Other Types
- 9.4. Market Analysis, Insights and Forecast - by End-user Vertical
- 9.4.1. Oil & Gas
- 9.4.2. Power Generation
- 9.4.3. Chemical
- 9.4.4. Water & Wastewater
- 9.4.5. Mining
- 9.4.6. Other End User Verticals
- 9.1. Market Analysis, Insights and Forecast - by Type
- 10. North America Valves & Actuators Industry Analysis, Insights and Forecast, 2019-2031
- 10.1. Market Analysis, Insights and Forecast - by Type
- 10.1.1. Hydraulic
- 10.1.2. Pneumatic
- 10.1.3. Electric
- 10.2. Market Analysis, Insights and Forecast - by End-user Vertical
- 10.2.1. Oil & Gas
- 10.2.2. Power Generation
- 10.2.3. Chemical
- 10.2.4. Water & Wastewater
- 10.2.5. Mining
- 10.2.6. Other End User Verticals
- 10.3. Market Analysis, Insights and Forecast - by Type
- 10.3.1. Ball
- 10.3.2. Butterfly
- 10.3.3. Gate/Globe/Check
- 10.3.4. Plug
- 10.3.5. Control
- 10.3.6. Other Types
- 10.4. Market Analysis, Insights and Forecast - by End-user Vertical
- 10.4.1. Oil & Gas
- 10.4.2. Power Generation
- 10.4.3. Chemical
- 10.4.4. Water & Wastewater
- 10.4.5. Mining
- 10.4.6. Other End User Verticals
- 10.1. Market Analysis, Insights and Forecast - by Type
- 11. Europe Valves & Actuators Industry Analysis, Insights and Forecast, 2019-2031
- 11.1. Market Analysis, Insights and Forecast - by Type
- 11.1.1. Hydraulic
- 11.1.2. Pneumatic
- 11.1.3. Electric
- 11.2. Market Analysis, Insights and Forecast - by End-user Vertical
- 11.2.1. Oil & Gas
- 11.2.2. Power Generation
- 11.2.3. Chemical
- 11.2.4. Water & Wastewater
- 11.2.5. Mining
- 11.2.6. Other End User Verticals
- 11.3. Market Analysis, Insights and Forecast - by Type
- 11.3.1. Ball
- 11.3.2. Butterfly
- 11.3.3. Gate/Globe/Check
- 11.3.4. Plug
- 11.3.5. Control
- 11.3.6. Other Types
- 11.4. Market Analysis, Insights and Forecast - by End-user Vertical
- 11.4.1. Oil & Gas
- 11.4.2. Power Generation
- 11.4.3. Chemical
- 11.4.4. Water & Wastewater
- 11.4.5. Mining
- 11.4.6. Other End User Verticals
- 11.1. Market Analysis, Insights and Forecast - by Type
- 12. Asia Pacific Valves & Actuators Industry Analysis, Insights and Forecast, 2019-2031
- 12.1. Market Analysis, Insights and Forecast - by Type
- 12.1.1. Hydraulic
- 12.1.2. Pneumatic
- 12.1.3. Electric
- 12.2. Market Analysis, Insights and Forecast - by End-user Vertical
- 12.2.1. Oil & Gas
- 12.2.2. Power Generation
- 12.2.3. Chemical
- 12.2.4. Water & Wastewater
- 12.2.5. Mining
- 12.2.6. Other End User Verticals
- 12.3. Market Analysis, Insights and Forecast - by Type
- 12.3.1. Ball
- 12.3.2. Butterfly
- 12.3.3. Gate/Globe/Check
- 12.3.4. Plug
- 12.3.5. Control
- 12.3.6. Other Types
- 12.4. Market Analysis, Insights and Forecast - by End-user Vertical
- 12.4.1. Oil & Gas
- 12.4.2. Power Generation
- 12.4.3. Chemical
- 12.4.4. Water & Wastewater
- 12.4.5. Mining
- 12.4.6. Other End User Verticals
- 12.1. Market Analysis, Insights and Forecast - by Type
- 13. Latin America Valves & Actuators Industry Analysis, Insights and Forecast, 2019-2031
- 13.1. Market Analysis, Insights and Forecast - by Type
- 13.1.1. Hydraulic
- 13.1.2. Pneumatic
- 13.1.3. Electric
- 13.2. Market Analysis, Insights and Forecast - by End-user Vertical
- 13.2.1. Oil & Gas
- 13.2.2. Power Generation
- 13.2.3. Chemical
- 13.2.4. Water & Wastewater
- 13.2.5. Mining
- 13.2.6. Other End User Verticals
- 13.3. Market Analysis, Insights and Forecast - by Type
- 13.3.1. Ball
- 13.3.2. Butterfly
- 13.3.3. Gate/Globe/Check
- 13.3.4. Plug
- 13.3.5. Control
- 13.3.6. Other Types
- 13.4. Market Analysis, Insights and Forecast - by End-user Vertical
- 13.4.1. Oil & Gas
- 13.4.2. Power Generation
- 13.4.3. Chemical
- 13.4.4. Water & Wastewater
- 13.4.5. Mining
- 13.4.6. Other End User Verticals
- 13.1. Market Analysis, Insights and Forecast - by Type
- 14. Middle East Valves & Actuators Industry Analysis, Insights and Forecast, 2019-2031
- 14.1. Market Analysis, Insights and Forecast - by Type
- 14.1.1. Hydraulic
- 14.1.2. Pneumatic
- 14.1.3. Electric
- 14.2. Market Analysis, Insights and Forecast - by End-user Vertical
- 14.2.1. Oil & Gas
- 14.2.2. Power Generation
- 14.2.3. Chemical
- 14.2.4. Water & Wastewater
- 14.2.5. Mining
- 14.2.6. Other End User Verticals
- 14.3. Market Analysis, Insights and Forecast - by Type
- 14.3.1. Ball
- 14.3.2. Butterfly
- 14.3.3. Gate/Globe/Check
- 14.3.4. Plug
- 14.3.5. Control
- 14.3.6. Other Types
- 14.4. Market Analysis, Insights and Forecast - by End-user Vertical
- 14.4.1. Oil & Gas
- 14.4.2. Power Generation
- 14.4.3. Chemical
- 14.4.4. Water & Wastewater
- 14.4.5. Mining
- 14.4.6. Other End User Verticals
- 14.1. Market Analysis, Insights and Forecast - by Type
- 15. North America Valves & Actuators Industry Analysis, Insights and Forecast, 2019-2031
- 15.1. Market Analysis, Insights and Forecast - By Country/Sub-region
- 15.1.1.
- 16. Europe Valves & Actuators Industry Analysis, Insights and Forecast, 2019-2031
- 16.1. Market Analysis, Insights and Forecast - By Country/Sub-region
- 16.1.1.
- 17. Asia Pacific Valves & Actuators Industry Analysis, Insights and Forecast, 2019-2031
- 17.1. Market Analysis, Insights and Forecast - By Country/Sub-region
- 17.1.1.
- 18. Latin America Valves & Actuators Industry Analysis, Insights and Forecast, 2019-2031
- 18.1. Market Analysis, Insights and Forecast - By Country/Sub-region
- 18.1.1.
- 19. Middle East Valves & Actuators Industry Analysis, Insights and Forecast, 2019-2031
- 19.1. Market Analysis, Insights and Forecast - By Country/Sub-region
- 19.1.1.
- 20. Competitive Analysis
- 20.1. Global Market Share Analysis 2024
- 20.2. Company Profiles
- 20.2.1 Samson Controls Inc
- 20.2.1.1. Overview
- 20.2.1.2. Products
- 20.2.1.3. SWOT Analysis
- 20.2.1.4. Recent Developments
- 20.2.1.5. Financials (Based on Availability)
- 20.2.2 Rotork Plc
- 20.2.2.1. Overview
- 20.2.2.2. Products
- 20.2.2.3. SWOT Analysis
- 20.2.2.4. Recent Developments
- 20.2.2.5. Financials (Based on Availability)
- 20.2.3 Flowserve Corporation
- 20.2.3.1. Overview
- 20.2.3.2. Products
- 20.2.3.3. SWOT Analysis
- 20.2.3.4. Recent Developments
- 20.2.3.5. Financials (Based on Availability)
- 20.2.4 Alfa Laval Corporate AB
- 20.2.4.1. Overview
- 20.2.4.2. Products
- 20.2.4.3. SWOT Analysis
- 20.2.4.4. Recent Developments
- 20.2.4.5. Financials (Based on Availability)
- 20.2.5 Emerson Electric Co
- 20.2.5.1. Overview
- 20.2.5.2. Products
- 20.2.5.3. SWOT Analysis
- 20.2.5.4. Recent Developments
- 20.2.5.5. Financials (Based on Availability)
- 20.2.6 IMI Critical Engineering
- 20.2.6.1. Overview
- 20.2.6.2. Products
- 20.2.6.3. SWOT Analysis
- 20.2.6.4. Recent Developments
- 20.2.6.5. Financials (Based on Availability)
- 20.2.7 Metso Oyj
- 20.2.7.1. Overview
- 20.2.7.2. Products
- 20.2.7.3. SWOT Analysis
- 20.2.7.4. Recent Developments
- 20.2.7.5. Financials (Based on Availability)
- 20.2.8 Crane Co
- 20.2.8.1. Overview
- 20.2.8.2. Products
- 20.2.8.3. SWOT Analysis
- 20.2.8.4. Recent Developments
- 20.2.8.5. Financials (Based on Availability)
- 20.2.9 Schlumberger Limited
- 20.2.9.1. Overview
- 20.2.9.2. Products
- 20.2.9.3. SWOT Analysis
- 20.2.9.4. Recent Developments
- 20.2.9.5. Financials (Based on Availability)
- 20.2.10 KITZ Corporation
- 20.2.10.1. Overview
- 20.2.10.2. Products
- 20.2.10.3. SWOT Analysis
- 20.2.10.4. Recent Developments
- 20.2.10.5. Financials (Based on Availability)
- 20.2.1 Samson Controls Inc
List of Figures
- Figure 1: Global Valves & Actuators Industry Revenue Breakdown (Million, %) by Region 2024 & 2032
- Figure 2: North America Valves & Actuators Industry Revenue (Million), by Country 2024 & 2032
- Figure 3: North America Valves & Actuators Industry Revenue Share (%), by Country 2024 & 2032
- Figure 4: Europe Valves & Actuators Industry Revenue (Million), by Country 2024 & 2032
- Figure 5: Europe Valves & Actuators Industry Revenue Share (%), by Country 2024 & 2032
- Figure 6: Asia Pacific Valves & Actuators Industry Revenue (Million), by Country 2024 & 2032
- Figure 7: Asia Pacific Valves & Actuators Industry Revenue Share (%), by Country 2024 & 2032
- Figure 8: Latin America Valves & Actuators Industry Revenue (Million), by Country 2024 & 2032
- Figure 9: Latin America Valves & Actuators Industry Revenue Share (%), by Country 2024 & 2032
- Figure 10: Middle East Valves & Actuators Industry Revenue (Million), by Country 2024 & 2032
- Figure 11: Middle East Valves & Actuators Industry Revenue Share (%), by Country 2024 & 2032
- Figure 12: North America Valves & Actuators Industry Revenue (Million), by Type 2024 & 2032
- Figure 13: North America Valves & Actuators Industry Revenue Share (%), by Type 2024 & 2032
- Figure 14: North America Valves & Actuators Industry Revenue (Million), by End-user Vertical 2024 & 2032
- Figure 15: North America Valves & Actuators Industry Revenue Share (%), by End-user Vertical 2024 & 2032
- Figure 16: North America Valves & Actuators Industry Revenue (Million), by Type 2024 & 2032
- Figure 17: North America Valves & Actuators Industry Revenue Share (%), by Type 2024 & 2032
- Figure 18: North America Valves & Actuators Industry Revenue (Million), by End-user Vertical 2024 & 2032
- Figure 19: North America Valves & Actuators Industry Revenue Share (%), by End-user Vertical 2024 & 2032
- Figure 20: North America Valves & Actuators Industry Revenue (Million), by Country 2024 & 2032
- Figure 21: North America Valves & Actuators Industry Revenue Share (%), by Country 2024 & 2032
- Figure 22: Europe Valves & Actuators Industry Revenue (Million), by Type 2024 & 2032
- Figure 23: Europe Valves & Actuators Industry Revenue Share (%), by Type 2024 & 2032
- Figure 24: Europe Valves & Actuators Industry Revenue (Million), by End-user Vertical 2024 & 2032
- Figure 25: Europe Valves & Actuators Industry Revenue Share (%), by End-user Vertical 2024 & 2032
- Figure 26: Europe Valves & Actuators Industry Revenue (Million), by Type 2024 & 2032
- Figure 27: Europe Valves & Actuators Industry Revenue Share (%), by Type 2024 & 2032
- Figure 28: Europe Valves & Actuators Industry Revenue (Million), by End-user Vertical 2024 & 2032
- Figure 29: Europe Valves & Actuators Industry Revenue Share (%), by End-user Vertical 2024 & 2032
- Figure 30: Europe Valves & Actuators Industry Revenue (Million), by Country 2024 & 2032
- Figure 31: Europe Valves & Actuators Industry Revenue Share (%), by Country 2024 & 2032
- Figure 32: Asia Pacific Valves & Actuators Industry Revenue (Million), by Type 2024 & 2032
- Figure 33: Asia Pacific Valves & Actuators Industry Revenue Share (%), by Type 2024 & 2032
- Figure 34: Asia Pacific Valves & Actuators Industry Revenue (Million), by End-user Vertical 2024 & 2032
- Figure 35: Asia Pacific Valves & Actuators Industry Revenue Share (%), by End-user Vertical 2024 & 2032
- Figure 36: Asia Pacific Valves & Actuators Industry Revenue (Million), by Type 2024 & 2032
- Figure 37: Asia Pacific Valves & Actuators Industry Revenue Share (%), by Type 2024 & 2032
- Figure 38: Asia Pacific Valves & Actuators Industry Revenue (Million), by End-user Vertical 2024 & 2032
- Figure 39: Asia Pacific Valves & Actuators Industry Revenue Share (%), by End-user Vertical 2024 & 2032
- Figure 40: Asia Pacific Valves & Actuators Industry Revenue (Million), by Country 2024 & 2032
- Figure 41: Asia Pacific Valves & Actuators Industry Revenue Share (%), by Country 2024 & 2032
- Figure 42: Rest of the World Valves & Actuators Industry Revenue (Million), by Type 2024 & 2032
- Figure 43: Rest of the World Valves & Actuators Industry Revenue Share (%), by Type 2024 & 2032
- Figure 44: Rest of the World Valves & Actuators Industry Revenue (Million), by End-user Vertical 2024 & 2032
- Figure 45: Rest of the World Valves & Actuators Industry Revenue Share (%), by End-user Vertical 2024 & 2032
- Figure 46: Rest of the World Valves & Actuators Industry Revenue (Million), by Type 2024 & 2032
- Figure 47: Rest of the World Valves & Actuators Industry Revenue Share (%), by Type 2024 & 2032
- Figure 48: Rest of the World Valves & Actuators Industry Revenue (Million), by End-user Vertical 2024 & 2032
- Figure 49: Rest of the World Valves & Actuators Industry Revenue Share (%), by End-user Vertical 2024 & 2032
- Figure 50: Rest of the World Valves & Actuators Industry Revenue (Million), by Country 2024 & 2032
- Figure 51: Rest of the World Valves & Actuators Industry Revenue Share (%), by Country 2024 & 2032
- Figure 52: North America Valves & Actuators Industry Revenue (Million), by Type 2024 & 2032
- Figure 53: North America Valves & Actuators Industry Revenue Share (%), by Type 2024 & 2032
- Figure 54: North America Valves & Actuators Industry Revenue (Million), by End-user Vertical 2024 & 2032
- Figure 55: North America Valves & Actuators Industry Revenue Share (%), by End-user Vertical 2024 & 2032
- Figure 56: North America Valves & Actuators Industry Revenue (Million), by Type 2024 & 2032
- Figure 57: North America Valves & Actuators Industry Revenue Share (%), by Type 2024 & 2032
- Figure 58: North America Valves & Actuators Industry Revenue (Million), by End-user Vertical 2024 & 2032
- Figure 59: North America Valves & Actuators Industry Revenue Share (%), by End-user Vertical 2024 & 2032
- Figure 60: North America Valves & Actuators Industry Revenue (Million), by Country 2024 & 2032
- Figure 61: North America Valves & Actuators Industry Revenue Share (%), by Country 2024 & 2032
- Figure 62: Europe Valves & Actuators Industry Revenue (Million), by Type 2024 & 2032
- Figure 63: Europe Valves & Actuators Industry Revenue Share (%), by Type 2024 & 2032
- Figure 64: Europe Valves & Actuators Industry Revenue (Million), by End-user Vertical 2024 & 2032
- Figure 65: Europe Valves & Actuators Industry Revenue Share (%), by End-user Vertical 2024 & 2032
- Figure 66: Europe Valves & Actuators Industry Revenue (Million), by Type 2024 & 2032
- Figure 67: Europe Valves & Actuators Industry Revenue Share (%), by Type 2024 & 2032
- Figure 68: Europe Valves & Actuators Industry Revenue (Million), by End-user Vertical 2024 & 2032
- Figure 69: Europe Valves & Actuators Industry Revenue Share (%), by End-user Vertical 2024 & 2032
- Figure 70: Europe Valves & Actuators Industry Revenue (Million), by Country 2024 & 2032
- Figure 71: Europe Valves & Actuators Industry Revenue Share (%), by Country 2024 & 2032
- Figure 72: Asia Pacific Valves & Actuators Industry Revenue (Million), by Type 2024 & 2032
- Figure 73: Asia Pacific Valves & Actuators Industry Revenue Share (%), by Type 2024 & 2032
- Figure 74: Asia Pacific Valves & Actuators Industry Revenue (Million), by End-user Vertical 2024 & 2032
- Figure 75: Asia Pacific Valves & Actuators Industry Revenue Share (%), by End-user Vertical 2024 & 2032
- Figure 76: Asia Pacific Valves & Actuators Industry Revenue (Million), by Type 2024 & 2032
- Figure 77: Asia Pacific Valves & Actuators Industry Revenue Share (%), by Type 2024 & 2032
- Figure 78: Asia Pacific Valves & Actuators Industry Revenue (Million), by End-user Vertical 2024 & 2032
- Figure 79: Asia Pacific Valves & Actuators Industry Revenue Share (%), by End-user Vertical 2024 & 2032
- Figure 80: Asia Pacific Valves & Actuators Industry Revenue (Million), by Country 2024 & 2032
- Figure 81: Asia Pacific Valves & Actuators Industry Revenue Share (%), by Country 2024 & 2032
- Figure 82: Latin America Valves & Actuators Industry Revenue (Million), by Type 2024 & 2032
- Figure 83: Latin America Valves & Actuators Industry Revenue Share (%), by Type 2024 & 2032
- Figure 84: Latin America Valves & Actuators Industry Revenue (Million), by End-user Vertical 2024 & 2032
- Figure 85: Latin America Valves & Actuators Industry Revenue Share (%), by End-user Vertical 2024 & 2032
- Figure 86: Latin America Valves & Actuators Industry Revenue (Million), by Type 2024 & 2032
- Figure 87: Latin America Valves & Actuators Industry Revenue Share (%), by Type 2024 & 2032
- Figure 88: Latin America Valves & Actuators Industry Revenue (Million), by End-user Vertical 2024 & 2032
- Figure 89: Latin America Valves & Actuators Industry Revenue Share (%), by End-user Vertical 2024 & 2032
- Figure 90: Latin America Valves & Actuators Industry Revenue (Million), by Country 2024 & 2032
- Figure 91: Latin America Valves & Actuators Industry Revenue Share (%), by Country 2024 & 2032
- Figure 92: Middle East Valves & Actuators Industry Revenue (Million), by Type 2024 & 2032
- Figure 93: Middle East Valves & Actuators Industry Revenue Share (%), by Type 2024 & 2032
- Figure 94: Middle East Valves & Actuators Industry Revenue (Million), by End-user Vertical 2024 & 2032
- Figure 95: Middle East Valves & Actuators Industry Revenue Share (%), by End-user Vertical 2024 & 2032
- Figure 96: Middle East Valves & Actuators Industry Revenue (Million), by Type 2024 & 2032
- Figure 97: Middle East Valves & Actuators Industry Revenue Share (%), by Type 2024 & 2032
- Figure 98: Middle East Valves & Actuators Industry Revenue (Million), by End-user Vertical 2024 & 2032
- Figure 99: Middle East Valves & Actuators Industry Revenue Share (%), by End-user Vertical 2024 & 2032
- Figure 100: Middle East Valves & Actuators Industry Revenue (Million), by Country 2024 & 2032
- Figure 101: Middle East Valves & Actuators Industry Revenue Share (%), by Country 2024 & 2032
List of Tables
- Table 1: Global Valves & Actuators Industry Revenue Million Forecast, by Region 2019 & 2032
- Table 2: Global Valves & Actuators Industry Revenue Million Forecast, by Type 2019 & 2032
- Table 3: Global Valves & Actuators Industry Revenue Million Forecast, by End-user Vertical 2019 & 2032
- Table 4: Global Valves & Actuators Industry Revenue Million Forecast, by Type 2019 & 2032
- Table 5: Global Valves & Actuators Industry Revenue Million Forecast, by End-user Vertical 2019 & 2032
- Table 6: Global Valves & Actuators Industry Revenue Million Forecast, by Region 2019 & 2032
- Table 7: Global Valves & Actuators Industry Revenue Million Forecast, by Country 2019 & 2032
- Table 8: Valves & Actuators Industry Revenue (Million) Forecast, by Application 2019 & 2032
- Table 9: Global Valves & Actuators Industry Revenue Million Forecast, by Country 2019 & 2032
- Table 10: Valves & Actuators Industry Revenue (Million) Forecast, by Application 2019 & 2032
- Table 11: Global Valves & Actuators Industry Revenue Million Forecast, by Country 2019 & 2032
- Table 12: Valves & Actuators Industry Revenue (Million) Forecast, by Application 2019 & 2032
- Table 13: Global Valves & Actuators Industry Revenue Million Forecast, by Country 2019 & 2032
- Table 14: Valves & Actuators Industry Revenue (Million) Forecast, by Application 2019 & 2032
- Table 15: Global Valves & Actuators Industry Revenue Million Forecast, by Country 2019 & 2032
- Table 16: Valves & Actuators Industry Revenue (Million) Forecast, by Application 2019 & 2032
- Table 17: Global Valves & Actuators Industry Revenue Million Forecast, by Type 2019 & 2032
- Table 18: Global Valves & Actuators Industry Revenue Million Forecast, by End-user Vertical 2019 & 2032
- Table 19: Global Valves & Actuators Industry Revenue Million Forecast, by Type 2019 & 2032
- Table 20: Global Valves & Actuators Industry Revenue Million Forecast, by End-user Vertical 2019 & 2032
- Table 21: Global Valves & Actuators Industry Revenue Million Forecast, by Country 2019 & 2032
- Table 22: United States Valves & Actuators Industry Revenue (Million) Forecast, by Application 2019 & 2032
- Table 23: Canada Valves & Actuators Industry Revenue (Million) Forecast, by Application 2019 & 2032
- Table 24: Global Valves & Actuators Industry Revenue Million Forecast, by Type 2019 & 2032
- Table 25: Global Valves & Actuators Industry Revenue Million Forecast, by End-user Vertical 2019 & 2032
- Table 26: Global Valves & Actuators Industry Revenue Million Forecast, by Type 2019 & 2032
- Table 27: Global Valves & Actuators Industry Revenue Million Forecast, by End-user Vertical 2019 & 2032
- Table 28: Global Valves & Actuators Industry Revenue Million Forecast, by Country 2019 & 2032
- Table 29: United Kingdom Valves & Actuators Industry Revenue (Million) Forecast, by Application 2019 & 2032
- Table 30: Germany Valves & Actuators Industry Revenue (Million) Forecast, by Application 2019 & 2032
- Table 31: France Valves & Actuators Industry Revenue (Million) Forecast, by Application 2019 & 2032
- Table 32: Italy Valves & Actuators Industry Revenue (Million) Forecast, by Application 2019 & 2032
- Table 33: Rest of Europe Valves & Actuators Industry Revenue (Million) Forecast, by Application 2019 & 2032
- Table 34: Global Valves & Actuators Industry Revenue Million Forecast, by Type 2019 & 2032
- Table 35: Global Valves & Actuators Industry Revenue Million Forecast, by End-user Vertical 2019 & 2032
- Table 36: Global Valves & Actuators Industry Revenue Million Forecast, by Type 2019 & 2032
- Table 37: Global Valves & Actuators Industry Revenue Million Forecast, by End-user Vertical 2019 & 2032
- Table 38: Global Valves & Actuators Industry Revenue Million Forecast, by Country 2019 & 2032
- Table 39: China Valves & Actuators Industry Revenue (Million) Forecast, by Application 2019 & 2032
- Table 40: Japan Valves & Actuators Industry Revenue (Million) Forecast, by Application 2019 & 2032
- Table 41: India Valves & Actuators Industry Revenue (Million) Forecast, by Application 2019 & 2032
- Table 42: South Korea Valves & Actuators Industry Revenue (Million) Forecast, by Application 2019 & 2032
- Table 43: Rest of Asia Pacific Valves & Actuators Industry Revenue (Million) Forecast, by Application 2019 & 2032
- Table 44: Global Valves & Actuators Industry Revenue Million Forecast, by Type 2019 & 2032
- Table 45: Global Valves & Actuators Industry Revenue Million Forecast, by End-user Vertical 2019 & 2032
- Table 46: Global Valves & Actuators Industry Revenue Million Forecast, by Type 2019 & 2032
- Table 47: Global Valves & Actuators Industry Revenue Million Forecast, by End-user Vertical 2019 & 2032
- Table 48: Global Valves & Actuators Industry Revenue Million Forecast, by Country 2019 & 2032
- Table 49: Latin America Valves & Actuators Industry Revenue (Million) Forecast, by Application 2019 & 2032
- Table 50: Middle East Valves & Actuators Industry Revenue (Million) Forecast, by Application 2019 & 2032
- Table 51: Global Valves & Actuators Industry Revenue Million Forecast, by Type 2019 & 2032
- Table 52: Global Valves & Actuators Industry Revenue Million Forecast, by End-user Vertical 2019 & 2032
- Table 53: Global Valves & Actuators Industry Revenue Million Forecast, by Type 2019 & 2032
- Table 54: Global Valves & Actuators Industry Revenue Million Forecast, by End-user Vertical 2019 & 2032
- Table 55: Global Valves & Actuators Industry Revenue Million Forecast, by Country 2019 & 2032
- Table 56: Global Valves & Actuators Industry Revenue Million Forecast, by Type 2019 & 2032
- Table 57: Global Valves & Actuators Industry Revenue Million Forecast, by End-user Vertical 2019 & 2032
- Table 58: Global Valves & Actuators Industry Revenue Million Forecast, by Type 2019 & 2032
- Table 59: Global Valves & Actuators Industry Revenue Million Forecast, by End-user Vertical 2019 & 2032
- Table 60: Global Valves & Actuators Industry Revenue Million Forecast, by Country 2019 & 2032
- Table 61: Global Valves & Actuators Industry Revenue Million Forecast, by Type 2019 & 2032
- Table 62: Global Valves & Actuators Industry Revenue Million Forecast, by End-user Vertical 2019 & 2032
- Table 63: Global Valves & Actuators Industry Revenue Million Forecast, by Type 2019 & 2032
- Table 64: Global Valves & Actuators Industry Revenue Million Forecast, by End-user Vertical 2019 & 2032
- Table 65: Global Valves & Actuators Industry Revenue Million Forecast, by Country 2019 & 2032
- Table 66: Global Valves & Actuators Industry Revenue Million Forecast, by Type 2019 & 2032
- Table 67: Global Valves & Actuators Industry Revenue Million Forecast, by End-user Vertical 2019 & 2032
- Table 68: Global Valves & Actuators Industry Revenue Million Forecast, by Type 2019 & 2032
- Table 69: Global Valves & Actuators Industry Revenue Million Forecast, by End-user Vertical 2019 & 2032
- Table 70: Global Valves & Actuators Industry Revenue Million Forecast, by Country 2019 & 2032
- Table 71: Global Valves & Actuators Industry Revenue Million Forecast, by Type 2019 & 2032
- Table 72: Global Valves & Actuators Industry Revenue Million Forecast, by End-user Vertical 2019 & 2032
- Table 73: Global Valves & Actuators Industry Revenue Million Forecast, by Type 2019 & 2032
- Table 74: Global Valves & Actuators Industry Revenue Million Forecast, by End-user Vertical 2019 & 2032
- Table 75: Global Valves & Actuators Industry Revenue Million Forecast, by Country 2019 & 2032
Frequently Asked Questions
1. What is the projected Compound Annual Growth Rate (CAGR) of the Valves & Actuators Industry?
The projected CAGR is approximately 6.52%.
2. Which companies are prominent players in the Valves & Actuators Industry?
Key companies in the market include Samson Controls Inc , Rotork Plc, Flowserve Corporation, Alfa Laval Corporate AB, Emerson Electric Co, IMI Critical Engineering, Metso Oyj, Crane Co, Schlumberger Limited, KITZ Corporation.
3. What are the main segments of the Valves & Actuators Industry?
The market segments include Type, End-user Vertical, Type, End-user Vertical.
4. Can you provide details about the market size?
The market size is estimated to be USD XX Million as of 2022.
5. What are some drivers contributing to market growth?
; Technological Advancements Propelling Application of Smart Valves and Actuators; Increase in Demand for Desalination Activities.
6. What are the notable trends driving market growth?
Oil and Gas Industry is Expected to Witness Significant Growth.
7. Are there any restraints impacting market growth?
; Stagnant Industrial Growth in Developed Countries.
8. Can you provide examples of recent developments in the market?
N/A
9. What pricing options are available for accessing the report?
Pricing options include single-user, multi-user, and enterprise licenses priced at USD 4750, USD 5250, and USD 8750 respectively.
10. Is the market size provided in terms of value or volume?
The market size is provided in terms of value, measured in Million.
11. Are there any specific market keywords associated with the report?
Yes, the market keyword associated with the report is "Valves & Actuators Industry," which aids in identifying and referencing the specific market segment covered.
12. How do I determine which pricing option suits my needs best?
The pricing options vary based on user requirements and access needs. Individual users may opt for single-user licenses, while businesses requiring broader access may choose multi-user or enterprise licenses for cost-effective access to the report.
13. Are there any additional resources or data provided in the Valves & Actuators Industry report?
While the report offers comprehensive insights, it's advisable to review the specific contents or supplementary materials provided to ascertain if additional resources or data are available.
14. How can I stay updated on further developments or reports in the Valves & Actuators Industry?
To stay informed about further developments, trends, and reports in the Valves & Actuators Industry, consider subscribing to industry newsletters, following relevant companies and organizations, or regularly checking reputable industry news sources and publications.
Methodology
Step 1 - Identification of Relevant Samples Size from Population Database


Step 2 - Approaches for Defining Global Market Size (Value, Volume* & Price*)

Note*: In applicable scenarios
Step 3 - Data Sources
Primary Research
- Web Analytics
- Survey Reports
- Research Institute
- Latest Research Reports
- Opinion Leaders
Secondary Research
- Annual Reports
- White Paper
- Latest Press Release
- Industry Association
- Paid Database
- Investor Presentations

Step 4 - Data Triangulation
Involves using different sources of information in order to increase the validity of a study
These sources are likely to be stakeholders in a program - participants, other researchers, program staff, other community members, and so on.
Then we put all data in single framework & apply various statistical tools to find out the dynamic on the market.
During the analysis stage, feedback from the stakeholder groups would be compared to determine areas of agreement as well as areas of divergence
