

Key Insights
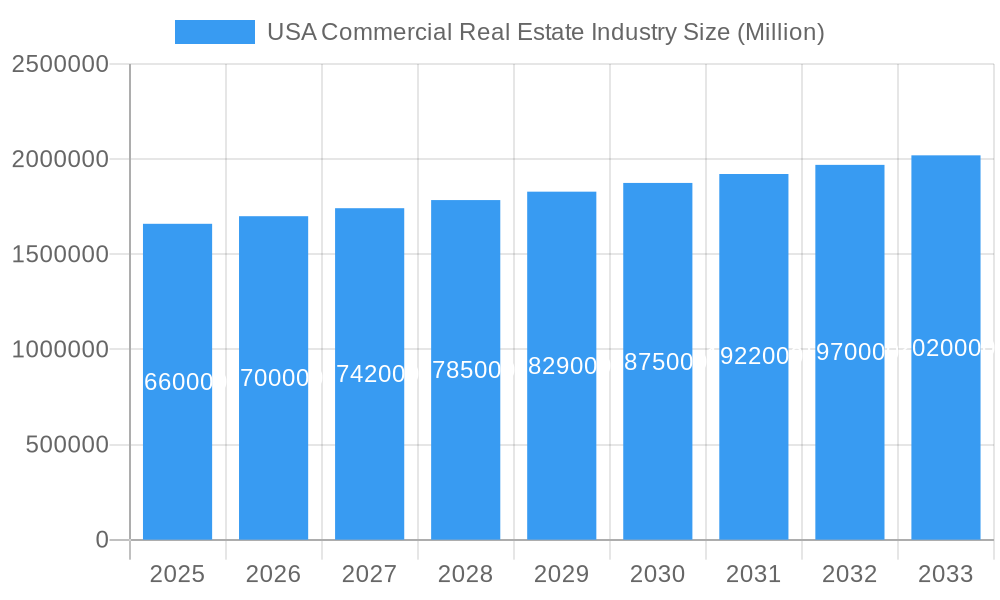
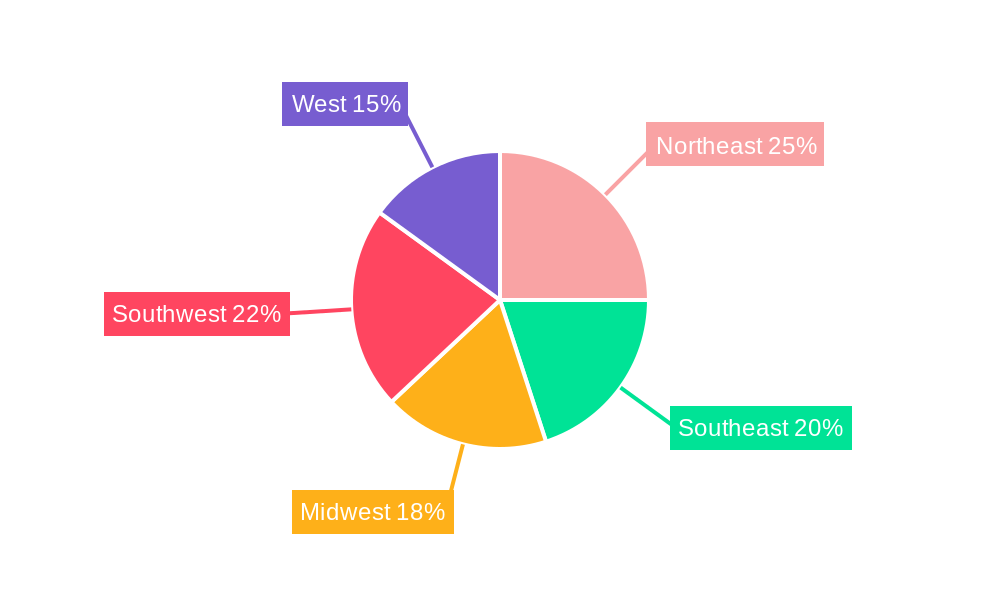
The US commercial real estate (CRE) market, valued at $1.66 trillion in 2025, is projected to experience steady growth, with a compound annual growth rate (CAGR) of 2.61% from 2025 to 2033. This growth is driven by several factors. Strong economic fundamentals, including a robust labor market and increasing consumer spending, continue to fuel demand for commercial spaces across various sectors. The ongoing expansion of e-commerce is driving significant demand for logistics and warehouse spaces, particularly in key metropolitan areas like New York, Los Angeles, and Chicago. Furthermore, a shift towards hybrid work models is impacting office space demand, with a predicted increase in demand for flexible and amenity-rich office spaces. However, rising interest rates and inflation pose challenges, potentially impacting investment and development activity. The market is segmented by property type (offices, retail, industrial, logistics, multi-family, hospitality) and key cities, reflecting varied regional economic conditions and investment patterns. The Northeast and West regions are expected to lead in growth due to established economic hubs and technological advancements.
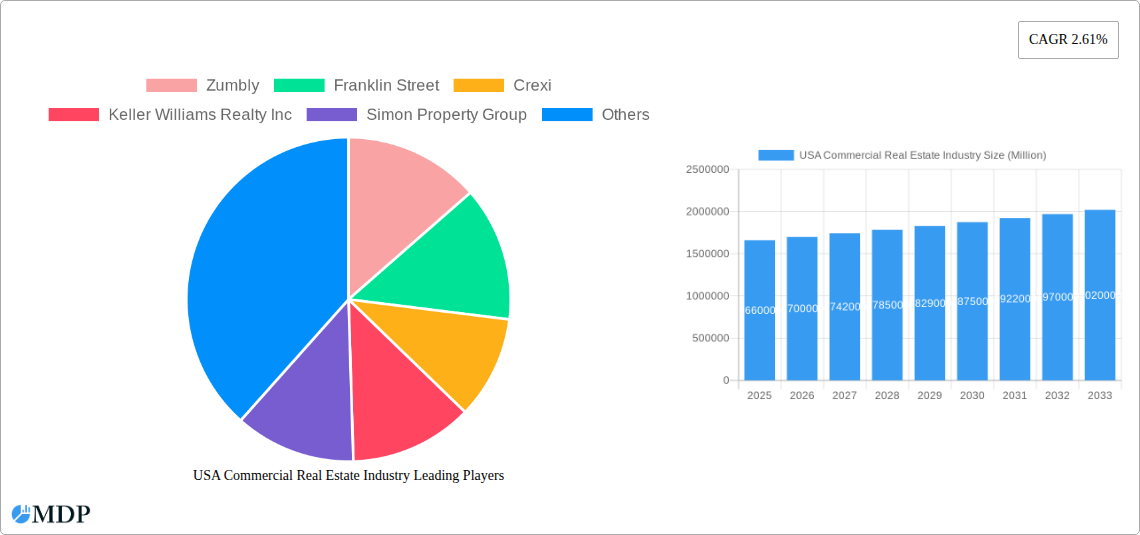
USA Commercial Real Estate Industry Market Size (In Million)
The competitive landscape is robust, with a mix of large national players like Simon Property Group and Keller Williams Realty Inc., alongside regional and specialized firms such as Zumbly and John Propp Commercial Group. The increasing adoption of technology in CRE transactions and property management is streamlining processes and improving efficiency. Future growth will likely depend on adapting to evolving market trends, such as embracing sustainable building practices and incorporating technological solutions to enhance tenant experiences and optimize asset management. While economic uncertainty remains a factor, the long-term outlook for the US CRE market remains positive, driven by fundamental economic drivers and continued adaptation to changing market dynamics. The diverse range of property types and geographic locations offers opportunities for both investors and businesses seeking commercial spaces in a dynamic market.
USA Commercial Real Estate Industry Company Market Share
Unlock Untapped Potential: The Definitive Report on the USA Commercial Real Estate Industry (2019-2033)
This comprehensive report provides an in-depth analysis of the dynamic USA commercial real estate market, offering invaluable insights for investors, developers, and industry stakeholders. Spanning the period from 2019 to 2033, with a focus on 2025, this study meticulously examines market trends, competitive landscapes, and future growth opportunities. The report leverages rigorous data analysis to forecast market behavior and identify key success factors in this lucrative sector. Expect detailed breakdowns by property type (Offices, Retail, Industrial, Logistics, Multi-family, Hospitality) and key city (New York, Chicago, Los Angeles, San Francisco, Boston, Denver, Houston, Phoenix, Atlanta, Salt Lake City). Discover actionable intelligence to navigate the complexities of this ever-evolving market. The total market value in 2025 is estimated at $XX Million.
USA Commercial Real Estate Industry Market Dynamics & Concentration
This section analyzes the competitive landscape, regulatory influences, and market forces shaping the USA commercial real estate market. We delve into market concentration, examining market share distribution among key players and exploring the impact of mergers and acquisitions (M&A). The study period (2019-2024) shows a xx% increase in M&A deals, indicating a consolidating market.
- Market Concentration: The market is characterized by a mix of large national players and regional specialists. Top players command approximately xx% of the market share in 2025, with increased concentration expected by 2033.
- Innovation Drivers: Proptech advancements, including AI-powered property management and virtual tours, are driving efficiency gains and reshaping the industry.
- Regulatory Framework: Local, state, and federal regulations influence development, zoning, and investment decisions, creating both opportunities and challenges.
- Product Substitutes: The rise of co-working spaces and flexible office solutions is impacting traditional office demand.
- End-User Trends: A shift towards experience-driven spaces, sustainability, and remote work options are reshaping property preferences.
- M&A Activities: The increasing number of M&A deals (xx in 2024) reflects strategic consolidation and expansion efforts.
USA Commercial Real Estate Industry Industry Trends & Analysis
This section provides a detailed analysis of the key trends driving market growth, technological disruptions, consumer preferences, and competitive dynamics within the USA commercial real estate industry. The compound annual growth rate (CAGR) for the forecast period (2025-2033) is projected at xx%, driven by factors including strong economic growth and ongoing urbanization. Market penetration of Proptech solutions is expected to reach xx% by 2033.
The report analyzes several key trends including: increasing demand for sustainable buildings, the growing adoption of PropTech, evolving workspace preferences, changing demographics and their impact on real estate demand, and increasing investment in logistics and industrial properties. The report also examines the impact of macroeconomic factors such as interest rate changes, inflation, and economic uncertainty on the market.
Leading Markets & Segments in USA Commercial Real Estate Industry
This section identifies the dominant segments and geographical areas within the USA commercial real estate market. It analyzes key growth drivers such as economic policies, infrastructure investments, and population dynamics.
- By Type: The industrial and logistics segments are projected to experience the highest growth due to e-commerce expansion and supply chain optimization initiatives. Multi-family residential also shows strong growth due to population shifts and urbanization.
- By Key City: New York, Los Angeles, and San Francisco remain leading markets, driven by strong economies and high population density. However, secondary markets like Denver and Phoenix are witnessing significant growth fueled by population migration and job creation.
New York City maintains its dominance as the leading market due to its robust economy, diverse industries, and high population density. The city's strong infrastructure and established commercial real estate sector contribute to its continued attractiveness for investors and businesses. However, rising construction costs and competition pose challenges.
USA Commercial Real Estate Industry Product Developments
The USA commercial real estate industry is witnessing rapid innovation in building design, construction technologies, and property management systems. Smart building technologies, sustainable construction materials, and flexible workspaces are gaining traction, enhancing efficiency and improving occupant experience. The integration of PropTech solutions is transforming the way properties are managed and marketed. This focus on creating value-added products addresses evolving tenant preferences for technology and sustainability.
Key Drivers of USA Commercial Real Estate Industry Growth
Several factors fuel the growth of the USA commercial real estate market. Strong economic growth, population growth in key urban areas, and ongoing technological advancements (particularly in PropTech) are major contributors. Government investments in infrastructure and favorable regulatory policies also stimulate development and investment. Furthermore, the expansion of e-commerce continues to drive demand for industrial and logistics space.
Challenges in the USA Commercial Real Estate Industry Market
The industry faces significant challenges, including rising construction costs, labor shortages, regulatory hurdles, and increased competition. Supply chain disruptions impacting construction materials and rising interest rates increase financing costs, impacting profitability and development timelines. These factors contribute to a slowdown in development and increased uncertainty in the market.
Emerging Opportunities in USA Commercial Real Estate Industry
Despite challenges, several opportunities exist. The growing adoption of sustainable building practices presents a significant opportunity for developers to attract environmentally conscious tenants. Strategic partnerships between real estate firms and technology companies can unlock new efficiencies and revenue streams. Expanding into emerging markets and focusing on niche segments can also drive growth.
Leading Players in the USA Commercial Real Estate Industry Sector
- Zumbly
- Franklin Street
- Crexi
- Keller Williams Realty Inc
- Simon Property Group
- Hightower
- Mohr Partners
- Lamudi
- Coldwell Banker
- ERA Real Estate
- RE/MAX
- John Propp Commercial Group
- HqO
- Century
- Progressive Real Estate Partners
- Shannon-Waltchack
Key Milestones in USA Commercial Real Estate Industry Industry
- 2020: Increased adoption of virtual tours and remote property viewings due to the COVID-19 pandemic.
- 2021: Significant investments in PropTech companies focusing on property management and data analytics.
- 2022: Rising interest rates impacting development financing and investment activity.
- 2023: Growing focus on sustainable building practices and ESG (Environmental, Social, and Governance) factors.
- 2024: Increased mergers and acquisitions activity among commercial real estate firms.
Strategic Outlook for USA Commercial Real Estate Industry Market
The USA commercial real estate market is poised for continued growth, driven by long-term demographic trends, economic expansion, and technological innovation. Strategic opportunities lie in leveraging PropTech, focusing on sustainability, and adapting to evolving tenant preferences. The market will continue to evolve, requiring agility and strategic adaptation from industry players.
USA Commercial Real Estate Industry Segmentation
-
1. Type
- 1.1. Offices
- 1.2. Retail
- 1.3. Industrial
- 1.4. Logistics
- 1.5. Multi-family
- 1.6. Hospitality
-
2. Key City
- 2.1. New York
- 2.2. Chicago
- 2.3. Los Angeles
- 2.4. San Francisco
- 2.5. Boston
- 2.6. Denver
- 2.7. Houston
- 2.8. Phoenix
- 2.9. Atlanta
- 2.10. Salt Lake City
USA Commercial Real Estate Industry Segmentation By Geography
-
1. North America
- 1.1. United States
- 1.2. Canada
- 1.3. Mexico
-
2. South America
- 2.1. Brazil
- 2.2. Argentina
- 2.3. Rest of South America
-
3. Europe
- 3.1. United Kingdom
- 3.2. Germany
- 3.3. France
- 3.4. Italy
- 3.5. Spain
- 3.6. Russia
- 3.7. Benelux
- 3.8. Nordics
- 3.9. Rest of Europe
-
4. Middle East & Africa
- 4.1. Turkey
- 4.2. Israel
- 4.3. GCC
- 4.4. North Africa
- 4.5. South Africa
- 4.6. Rest of Middle East & Africa
-
5. Asia Pacific
- 5.1. China
- 5.2. India
- 5.3. Japan
- 5.4. South Korea
- 5.5. ASEAN
- 5.6. Oceania
- 5.7. Rest of Asia Pacific
USA Commercial Real Estate Industry Regional Market Share
Geographic Coverage of USA Commercial Real Estate Industry
USA Commercial Real Estate Industry REPORT HIGHLIGHTS
| Aspects | Details |
|---|---|
| Study Period | 2020-2034 |
| Base Year | 2025 |
| Estimated Year | 2026 |
| Forecast Period | 2026-2034 |
| Historical Period | 2020-2025 |
| Growth Rate | CAGR of 2.61% from 2020-2034 |
| Segmentation |
|
Table of Contents
- 1. Introduction
- 1.1. Research Scope
- 1.2. Market Segmentation
- 1.3. Research Methodology
- 1.4. Definitions and Assumptions
- 2. Executive Summary
- 2.1. Introduction
- 3. Market Dynamics
- 3.1. Introduction
- 3.2. Market Drivers
- 3.2.1. Increasing number of startups
- 3.3. Market Restrains
- 3.3.1. Low Awareness and Privacy Issues
- 3.4. Market Trends
- 3.4.1. Industrial Sector Expected to Record High Demand
- 4. Market Factor Analysis
- 4.1. Porters Five Forces
- 4.2. Supply/Value Chain
- 4.3. PESTEL analysis
- 4.4. Market Entropy
- 4.5. Patent/Trademark Analysis
- 5. Global USA Commercial Real Estate Industry Analysis, Insights and Forecast, 2020-2032
- 5.1. Market Analysis, Insights and Forecast - by Type
- 5.1.1. Offices
- 5.1.2. Retail
- 5.1.3. Industrial
- 5.1.4. Logistics
- 5.1.5. Multi-family
- 5.1.6. Hospitality
- 5.2. Market Analysis, Insights and Forecast - by Key City
- 5.2.1. New York
- 5.2.2. Chicago
- 5.2.3. Los Angeles
- 5.2.4. San Francisco
- 5.2.5. Boston
- 5.2.6. Denver
- 5.2.7. Houston
- 5.2.8. Phoenix
- 5.2.9. Atlanta
- 5.2.10. Salt Lake City
- 5.3. Market Analysis, Insights and Forecast - by Region
- 5.3.1. North America
- 5.3.2. South America
- 5.3.3. Europe
- 5.3.4. Middle East & Africa
- 5.3.5. Asia Pacific
- 5.1. Market Analysis, Insights and Forecast - by Type
- 6. North America USA Commercial Real Estate Industry Analysis, Insights and Forecast, 2020-2032
- 6.1. Market Analysis, Insights and Forecast - by Type
- 6.1.1. Offices
- 6.1.2. Retail
- 6.1.3. Industrial
- 6.1.4. Logistics
- 6.1.5. Multi-family
- 6.1.6. Hospitality
- 6.2. Market Analysis, Insights and Forecast - by Key City
- 6.2.1. New York
- 6.2.2. Chicago
- 6.2.3. Los Angeles
- 6.2.4. San Francisco
- 6.2.5. Boston
- 6.2.6. Denver
- 6.2.7. Houston
- 6.2.8. Phoenix
- 6.2.9. Atlanta
- 6.2.10. Salt Lake City
- 6.1. Market Analysis, Insights and Forecast - by Type
- 7. South America USA Commercial Real Estate Industry Analysis, Insights and Forecast, 2020-2032
- 7.1. Market Analysis, Insights and Forecast - by Type
- 7.1.1. Offices
- 7.1.2. Retail
- 7.1.3. Industrial
- 7.1.4. Logistics
- 7.1.5. Multi-family
- 7.1.6. Hospitality
- 7.2. Market Analysis, Insights and Forecast - by Key City
- 7.2.1. New York
- 7.2.2. Chicago
- 7.2.3. Los Angeles
- 7.2.4. San Francisco
- 7.2.5. Boston
- 7.2.6. Denver
- 7.2.7. Houston
- 7.2.8. Phoenix
- 7.2.9. Atlanta
- 7.2.10. Salt Lake City
- 7.1. Market Analysis, Insights and Forecast - by Type
- 8. Europe USA Commercial Real Estate Industry Analysis, Insights and Forecast, 2020-2032
- 8.1. Market Analysis, Insights and Forecast - by Type
- 8.1.1. Offices
- 8.1.2. Retail
- 8.1.3. Industrial
- 8.1.4. Logistics
- 8.1.5. Multi-family
- 8.1.6. Hospitality
- 8.2. Market Analysis, Insights and Forecast - by Key City
- 8.2.1. New York
- 8.2.2. Chicago
- 8.2.3. Los Angeles
- 8.2.4. San Francisco
- 8.2.5. Boston
- 8.2.6. Denver
- 8.2.7. Houston
- 8.2.8. Phoenix
- 8.2.9. Atlanta
- 8.2.10. Salt Lake City
- 8.1. Market Analysis, Insights and Forecast - by Type
- 9. Middle East & Africa USA Commercial Real Estate Industry Analysis, Insights and Forecast, 2020-2032
- 9.1. Market Analysis, Insights and Forecast - by Type
- 9.1.1. Offices
- 9.1.2. Retail
- 9.1.3. Industrial
- 9.1.4. Logistics
- 9.1.5. Multi-family
- 9.1.6. Hospitality
- 9.2. Market Analysis, Insights and Forecast - by Key City
- 9.2.1. New York
- 9.2.2. Chicago
- 9.2.3. Los Angeles
- 9.2.4. San Francisco
- 9.2.5. Boston
- 9.2.6. Denver
- 9.2.7. Houston
- 9.2.8. Phoenix
- 9.2.9. Atlanta
- 9.2.10. Salt Lake City
- 9.1. Market Analysis, Insights and Forecast - by Type
- 10. Asia Pacific USA Commercial Real Estate Industry Analysis, Insights and Forecast, 2020-2032
- 10.1. Market Analysis, Insights and Forecast - by Type
- 10.1.1. Offices
- 10.1.2. Retail
- 10.1.3. Industrial
- 10.1.4. Logistics
- 10.1.5. Multi-family
- 10.1.6. Hospitality
- 10.2. Market Analysis, Insights and Forecast - by Key City
- 10.2.1. New York
- 10.2.2. Chicago
- 10.2.3. Los Angeles
- 10.2.4. San Francisco
- 10.2.5. Boston
- 10.2.6. Denver
- 10.2.7. Houston
- 10.2.8. Phoenix
- 10.2.9. Atlanta
- 10.2.10. Salt Lake City
- 10.1. Market Analysis, Insights and Forecast - by Type
- 11. Competitive Analysis
- 11.1. Global Market Share Analysis 2025
- 11.2. Company Profiles
- 11.2.1 Zumbly
- 11.2.1.1. Overview
- 11.2.1.2. Products
- 11.2.1.3. SWOT Analysis
- 11.2.1.4. Recent Developments
- 11.2.1.5. Financials (Based on Availability)
- 11.2.2 Franklin Street
- 11.2.2.1. Overview
- 11.2.2.2. Products
- 11.2.2.3. SWOT Analysis
- 11.2.2.4. Recent Developments
- 11.2.2.5. Financials (Based on Availability)
- 11.2.3 Crexi
- 11.2.3.1. Overview
- 11.2.3.2. Products
- 11.2.3.3. SWOT Analysis
- 11.2.3.4. Recent Developments
- 11.2.3.5. Financials (Based on Availability)
- 11.2.4 Keller Williams Realty Inc
- 11.2.4.1. Overview
- 11.2.4.2. Products
- 11.2.4.3. SWOT Analysis
- 11.2.4.4. Recent Developments
- 11.2.4.5. Financials (Based on Availability)
- 11.2.5 Simon Property Group
- 11.2.5.1. Overview
- 11.2.5.2. Products
- 11.2.5.3. SWOT Analysis
- 11.2.5.4. Recent Developments
- 11.2.5.5. Financials (Based on Availability)
- 11.2.6 Hightower
- 11.2.6.1. Overview
- 11.2.6.2. Products
- 11.2.6.3. SWOT Analysis
- 11.2.6.4. Recent Developments
- 11.2.6.5. Financials (Based on Availability)
- 11.2.7 Mohr Partners
- 11.2.7.1. Overview
- 11.2.7.2. Products
- 11.2.7.3. SWOT Analysis
- 11.2.7.4. Recent Developments
- 11.2.7.5. Financials (Based on Availability)
- 11.2.8 Lamudi
- 11.2.8.1. Overview
- 11.2.8.2. Products
- 11.2.8.3. SWOT Analysis
- 11.2.8.4. Recent Developments
- 11.2.8.5. Financials (Based on Availability)
- 11.2.9 Coldwell Banker
- 11.2.9.1. Overview
- 11.2.9.2. Products
- 11.2.9.3. SWOT Analysis
- 11.2.9.4. Recent Developments
- 11.2.9.5. Financials (Based on Availability)
- 11.2.10 ERA Real Estate
- 11.2.10.1. Overview
- 11.2.10.2. Products
- 11.2.10.3. SWOT Analysis
- 11.2.10.4. Recent Developments
- 11.2.10.5. Financials (Based on Availability)
- 11.2.11 RE/MAX
- 11.2.11.1. Overview
- 11.2.11.2. Products
- 11.2.11.3. SWOT Analysis
- 11.2.11.4. Recent Developments
- 11.2.11.5. Financials (Based on Availability)
- 11.2.12 John Propp Commercial Group
- 11.2.12.1. Overview
- 11.2.12.2. Products
- 11.2.12.3. SWOT Analysis
- 11.2.12.4. Recent Developments
- 11.2.12.5. Financials (Based on Availability)
- 11.2.13 HqO**List Not Exhaustive
- 11.2.13.1. Overview
- 11.2.13.2. Products
- 11.2.13.3. SWOT Analysis
- 11.2.13.4. Recent Developments
- 11.2.13.5. Financials (Based on Availability)
- 11.2.14 Century
- 11.2.14.1. Overview
- 11.2.14.2. Products
- 11.2.14.3. SWOT Analysis
- 11.2.14.4. Recent Developments
- 11.2.14.5. Financials (Based on Availability)
- 11.2.15 Progressive Real Estate Partners
- 11.2.15.1. Overview
- 11.2.15.2. Products
- 11.2.15.3. SWOT Analysis
- 11.2.15.4. Recent Developments
- 11.2.15.5. Financials (Based on Availability)
- 11.2.16 Shannon-Waltchack
- 11.2.16.1. Overview
- 11.2.16.2. Products
- 11.2.16.3. SWOT Analysis
- 11.2.16.4. Recent Developments
- 11.2.16.5. Financials (Based on Availability)
- 11.2.1 Zumbly
List of Figures
- Figure 1: Global USA Commercial Real Estate Industry Revenue Breakdown (Million, %) by Region 2025 & 2033
- Figure 2: North America USA Commercial Real Estate Industry Revenue (Million), by Type 2025 & 2033
- Figure 3: North America USA Commercial Real Estate Industry Revenue Share (%), by Type 2025 & 2033
- Figure 4: North America USA Commercial Real Estate Industry Revenue (Million), by Key City 2025 & 2033
- Figure 5: North America USA Commercial Real Estate Industry Revenue Share (%), by Key City 2025 & 2033
- Figure 6: North America USA Commercial Real Estate Industry Revenue (Million), by Country 2025 & 2033
- Figure 7: North America USA Commercial Real Estate Industry Revenue Share (%), by Country 2025 & 2033
- Figure 8: South America USA Commercial Real Estate Industry Revenue (Million), by Type 2025 & 2033
- Figure 9: South America USA Commercial Real Estate Industry Revenue Share (%), by Type 2025 & 2033
- Figure 10: South America USA Commercial Real Estate Industry Revenue (Million), by Key City 2025 & 2033
- Figure 11: South America USA Commercial Real Estate Industry Revenue Share (%), by Key City 2025 & 2033
- Figure 12: South America USA Commercial Real Estate Industry Revenue (Million), by Country 2025 & 2033
- Figure 13: South America USA Commercial Real Estate Industry Revenue Share (%), by Country 2025 & 2033
- Figure 14: Europe USA Commercial Real Estate Industry Revenue (Million), by Type 2025 & 2033
- Figure 15: Europe USA Commercial Real Estate Industry Revenue Share (%), by Type 2025 & 2033
- Figure 16: Europe USA Commercial Real Estate Industry Revenue (Million), by Key City 2025 & 2033
- Figure 17: Europe USA Commercial Real Estate Industry Revenue Share (%), by Key City 2025 & 2033
- Figure 18: Europe USA Commercial Real Estate Industry Revenue (Million), by Country 2025 & 2033
- Figure 19: Europe USA Commercial Real Estate Industry Revenue Share (%), by Country 2025 & 2033
- Figure 20: Middle East & Africa USA Commercial Real Estate Industry Revenue (Million), by Type 2025 & 2033
- Figure 21: Middle East & Africa USA Commercial Real Estate Industry Revenue Share (%), by Type 2025 & 2033
- Figure 22: Middle East & Africa USA Commercial Real Estate Industry Revenue (Million), by Key City 2025 & 2033
- Figure 23: Middle East & Africa USA Commercial Real Estate Industry Revenue Share (%), by Key City 2025 & 2033
- Figure 24: Middle East & Africa USA Commercial Real Estate Industry Revenue (Million), by Country 2025 & 2033
- Figure 25: Middle East & Africa USA Commercial Real Estate Industry Revenue Share (%), by Country 2025 & 2033
- Figure 26: Asia Pacific USA Commercial Real Estate Industry Revenue (Million), by Type 2025 & 2033
- Figure 27: Asia Pacific USA Commercial Real Estate Industry Revenue Share (%), by Type 2025 & 2033
- Figure 28: Asia Pacific USA Commercial Real Estate Industry Revenue (Million), by Key City 2025 & 2033
- Figure 29: Asia Pacific USA Commercial Real Estate Industry Revenue Share (%), by Key City 2025 & 2033
- Figure 30: Asia Pacific USA Commercial Real Estate Industry Revenue (Million), by Country 2025 & 2033
- Figure 31: Asia Pacific USA Commercial Real Estate Industry Revenue Share (%), by Country 2025 & 2033
List of Tables
- Table 1: Global USA Commercial Real Estate Industry Revenue Million Forecast, by Type 2020 & 2033
- Table 2: Global USA Commercial Real Estate Industry Revenue Million Forecast, by Key City 2020 & 2033
- Table 3: Global USA Commercial Real Estate Industry Revenue Million Forecast, by Region 2020 & 2033
- Table 4: Global USA Commercial Real Estate Industry Revenue Million Forecast, by Type 2020 & 2033
- Table 5: Global USA Commercial Real Estate Industry Revenue Million Forecast, by Key City 2020 & 2033
- Table 6: Global USA Commercial Real Estate Industry Revenue Million Forecast, by Country 2020 & 2033
- Table 7: United States USA Commercial Real Estate Industry Revenue (Million) Forecast, by Application 2020 & 2033
- Table 8: Canada USA Commercial Real Estate Industry Revenue (Million) Forecast, by Application 2020 & 2033
- Table 9: Mexico USA Commercial Real Estate Industry Revenue (Million) Forecast, by Application 2020 & 2033
- Table 10: Global USA Commercial Real Estate Industry Revenue Million Forecast, by Type 2020 & 2033
- Table 11: Global USA Commercial Real Estate Industry Revenue Million Forecast, by Key City 2020 & 2033
- Table 12: Global USA Commercial Real Estate Industry Revenue Million Forecast, by Country 2020 & 2033
- Table 13: Brazil USA Commercial Real Estate Industry Revenue (Million) Forecast, by Application 2020 & 2033
- Table 14: Argentina USA Commercial Real Estate Industry Revenue (Million) Forecast, by Application 2020 & 2033
- Table 15: Rest of South America USA Commercial Real Estate Industry Revenue (Million) Forecast, by Application 2020 & 2033
- Table 16: Global USA Commercial Real Estate Industry Revenue Million Forecast, by Type 2020 & 2033
- Table 17: Global USA Commercial Real Estate Industry Revenue Million Forecast, by Key City 2020 & 2033
- Table 18: Global USA Commercial Real Estate Industry Revenue Million Forecast, by Country 2020 & 2033
- Table 19: United Kingdom USA Commercial Real Estate Industry Revenue (Million) Forecast, by Application 2020 & 2033
- Table 20: Germany USA Commercial Real Estate Industry Revenue (Million) Forecast, by Application 2020 & 2033
- Table 21: France USA Commercial Real Estate Industry Revenue (Million) Forecast, by Application 2020 & 2033
- Table 22: Italy USA Commercial Real Estate Industry Revenue (Million) Forecast, by Application 2020 & 2033
- Table 23: Spain USA Commercial Real Estate Industry Revenue (Million) Forecast, by Application 2020 & 2033
- Table 24: Russia USA Commercial Real Estate Industry Revenue (Million) Forecast, by Application 2020 & 2033
- Table 25: Benelux USA Commercial Real Estate Industry Revenue (Million) Forecast, by Application 2020 & 2033
- Table 26: Nordics USA Commercial Real Estate Industry Revenue (Million) Forecast, by Application 2020 & 2033
- Table 27: Rest of Europe USA Commercial Real Estate Industry Revenue (Million) Forecast, by Application 2020 & 2033
- Table 28: Global USA Commercial Real Estate Industry Revenue Million Forecast, by Type 2020 & 2033
- Table 29: Global USA Commercial Real Estate Industry Revenue Million Forecast, by Key City 2020 & 2033
- Table 30: Global USA Commercial Real Estate Industry Revenue Million Forecast, by Country 2020 & 2033
- Table 31: Turkey USA Commercial Real Estate Industry Revenue (Million) Forecast, by Application 2020 & 2033
- Table 32: Israel USA Commercial Real Estate Industry Revenue (Million) Forecast, by Application 2020 & 2033
- Table 33: GCC USA Commercial Real Estate Industry Revenue (Million) Forecast, by Application 2020 & 2033
- Table 34: North Africa USA Commercial Real Estate Industry Revenue (Million) Forecast, by Application 2020 & 2033
- Table 35: South Africa USA Commercial Real Estate Industry Revenue (Million) Forecast, by Application 2020 & 2033
- Table 36: Rest of Middle East & Africa USA Commercial Real Estate Industry Revenue (Million) Forecast, by Application 2020 & 2033
- Table 37: Global USA Commercial Real Estate Industry Revenue Million Forecast, by Type 2020 & 2033
- Table 38: Global USA Commercial Real Estate Industry Revenue Million Forecast, by Key City 2020 & 2033
- Table 39: Global USA Commercial Real Estate Industry Revenue Million Forecast, by Country 2020 & 2033
- Table 40: China USA Commercial Real Estate Industry Revenue (Million) Forecast, by Application 2020 & 2033
- Table 41: India USA Commercial Real Estate Industry Revenue (Million) Forecast, by Application 2020 & 2033
- Table 42: Japan USA Commercial Real Estate Industry Revenue (Million) Forecast, by Application 2020 & 2033
- Table 43: South Korea USA Commercial Real Estate Industry Revenue (Million) Forecast, by Application 2020 & 2033
- Table 44: ASEAN USA Commercial Real Estate Industry Revenue (Million) Forecast, by Application 2020 & 2033
- Table 45: Oceania USA Commercial Real Estate Industry Revenue (Million) Forecast, by Application 2020 & 2033
- Table 46: Rest of Asia Pacific USA Commercial Real Estate Industry Revenue (Million) Forecast, by Application 2020 & 2033
Frequently Asked Questions
1. What is the projected Compound Annual Growth Rate (CAGR) of the USA Commercial Real Estate Industry?
The projected CAGR is approximately 2.61%.
2. Which companies are prominent players in the USA Commercial Real Estate Industry?
Key companies in the market include Zumbly, Franklin Street, Crexi, Keller Williams Realty Inc, Simon Property Group, Hightower, Mohr Partners, Lamudi, Coldwell Banker, ERA Real Estate, RE/MAX, John Propp Commercial Group, HqO**List Not Exhaustive, Century, Progressive Real Estate Partners, Shannon-Waltchack.
3. What are the main segments of the USA Commercial Real Estate Industry?
The market segments include Type, Key City.
4. Can you provide details about the market size?
The market size is estimated to be USD 1.66 Million as of 2022.
5. What are some drivers contributing to market growth?
Increasing number of startups.
6. What are the notable trends driving market growth?
Industrial Sector Expected to Record High Demand.
7. Are there any restraints impacting market growth?
Low Awareness and Privacy Issues.
8. Can you provide examples of recent developments in the market?
N/A
9. What pricing options are available for accessing the report?
Pricing options include single-user, multi-user, and enterprise licenses priced at USD 3800, USD 4500, and USD 5800 respectively.
10. Is the market size provided in terms of value or volume?
The market size is provided in terms of value, measured in Million.
11. Are there any specific market keywords associated with the report?
Yes, the market keyword associated with the report is "USA Commercial Real Estate Industry," which aids in identifying and referencing the specific market segment covered.
12. How do I determine which pricing option suits my needs best?
The pricing options vary based on user requirements and access needs. Individual users may opt for single-user licenses, while businesses requiring broader access may choose multi-user or enterprise licenses for cost-effective access to the report.
13. Are there any additional resources or data provided in the USA Commercial Real Estate Industry report?
While the report offers comprehensive insights, it's advisable to review the specific contents or supplementary materials provided to ascertain if additional resources or data are available.
14. How can I stay updated on further developments or reports in the USA Commercial Real Estate Industry?
To stay informed about further developments, trends, and reports in the USA Commercial Real Estate Industry, consider subscribing to industry newsletters, following relevant companies and organizations, or regularly checking reputable industry news sources and publications.
Methodology
Step 1 - Identification of Relevant Samples Size from Population Database


Step 2 - Approaches for Defining Global Market Size (Value, Volume* & Price*)

Note*: In applicable scenarios
Step 3 - Data Sources
Primary Research
- Web Analytics
- Survey Reports
- Research Institute
- Latest Research Reports
- Opinion Leaders
Secondary Research
- Annual Reports
- White Paper
- Latest Press Release
- Industry Association
- Paid Database
- Investor Presentations

Step 4 - Data Triangulation
Involves using different sources of information in order to increase the validity of a study
These sources are likely to be stakeholders in a program - participants, other researchers, program staff, other community members, and so on.
Then we put all data in single framework & apply various statistical tools to find out the dynamic on the market.
During the analysis stage, feedback from the stakeholder groups would be compared to determine areas of agreement as well as areas of divergence