

Key Insights
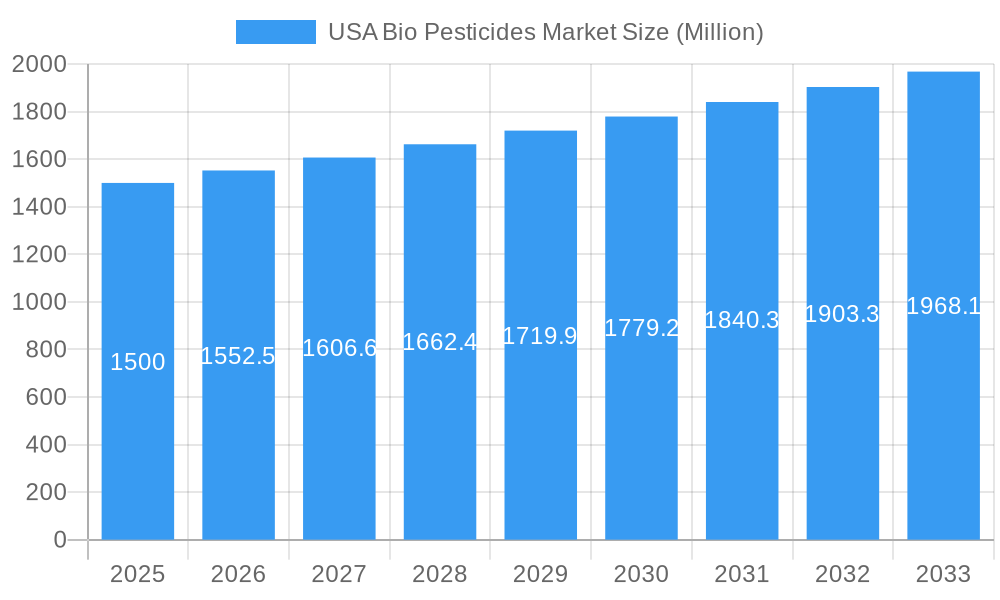
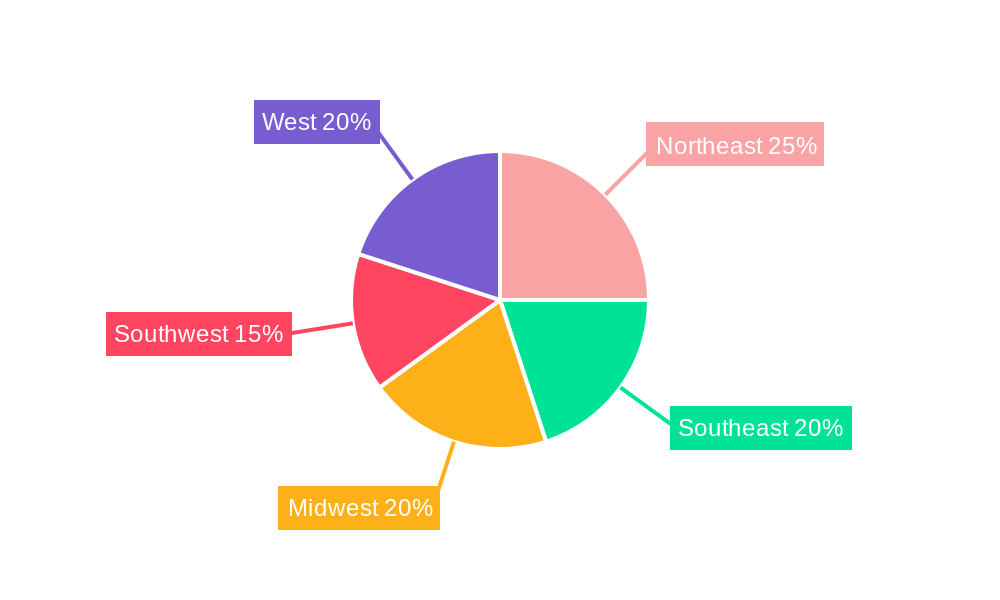
The U.S. biopesticides market, valued at approximately $1.5 billion in 2025, is projected to experience robust growth, driven by increasing consumer demand for sustainable agricultural practices and stricter regulations on synthetic pesticides. A compound annual growth rate (CAGR) of 3.50% from 2025 to 2033 indicates a market size exceeding $2.2 billion by 2033. Key drivers include rising awareness of the environmental and health risks associated with conventional pesticides, coupled with the growing adoption of integrated pest management (IPM) strategies. The biofungicides segment currently holds a significant market share, owing to the prevalence of fungal diseases affecting major crops. However, bioinsecticides and bioherbicides are witnessing rapid growth fueled by innovation in product formulations and efficacy. Horticultural crops currently constitute a larger segment compared to row crops and cash crops, driven by high value and consumer sensitivity to pesticide residues in produce. Major players, including Valent Biosciences, Bioworks Inc., and Marrone Bio Innovations, are actively engaged in research and development, expanding their product portfolios, and investing in strategic partnerships to capture market share. The Northeast and West regions of the U.S. show higher adoption rates of biopesticides due to favorable regulatory environments and consumer preferences, while Midwest and South are expected to see rapid growth in coming years.
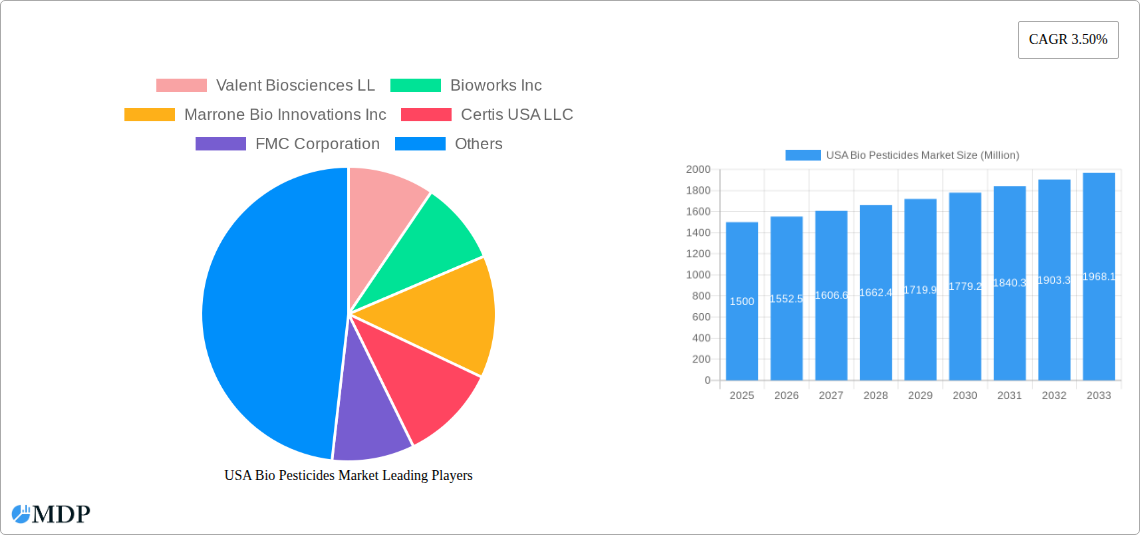
USA Bio Pesticides Market Market Size (In Billion)
Geographic segmentation reveals regional variations in market penetration. While the West and Northeast regions currently exhibit higher adoption due to consumer preference and environmentally conscious regulations, significant growth potential exists in the Midwest and Southeast. These regions are expected to witness increased adoption rates as awareness of biopesticide benefits grows and government incentives promote sustainable agriculture. The market's future hinges on continued research and development leading to improved efficacy and cost-effectiveness of biopesticide products, alongside supportive government policies and increasing consumer acceptance. Continued investment in technology and expansion of distribution networks will be crucial for market players to capitalize on this expanding market opportunity. The "Other Biopesticides" segment presents a potential for disruption through the development of novel biocontrol agents.
USA Bio Pesticides Market Company Market Share
USA Bio Pesticides Market: A Comprehensive Report (2019-2033)
This in-depth report provides a comprehensive analysis of the USA Bio Pesticides Market, offering invaluable insights for industry stakeholders, investors, and strategic decision-makers. The report covers the period 2019-2033, with a focus on the forecast period 2025-2033, and utilizes 2025 as the base year. The market is segmented by form (Biofungicides, Bioherbicides, Bioinsecticides, Other Biopesticides) and crop type (Cash Crops, Horticultural Crops, Row Crops). Expect detailed analysis of market dynamics, leading players, emerging opportunities, and key industry developments, all presented in an easily digestible format. The market is projected to reach xx Million by 2033, exhibiting a CAGR of xx% during the forecast period.
USA Bio Pesticides Market Market Dynamics & Concentration
The USA Bio Pesticides Market is characterized by a moderately concentrated landscape with several key players dominating significant market shares. While precise market share figures for each company require further detailed analysis and are not included here, Valent Biosciences LLC, Corteva Agriscience, Certis USA LLC, and FMC Corporation are prominent examples. Market concentration is influenced by factors such as economies of scale in manufacturing, research & development capabilities, and established distribution networks.
Innovation is a key driver, with continuous research into new biopesticides with enhanced efficacy, broader spectrum activity, and improved environmental profiles. The regulatory framework, including EPA approvals and labeling requirements, significantly influences market dynamics, creating both opportunities and challenges for market entrants. The availability of synthetic pesticides acts as a product substitute, although growing consumer demand for sustainable agriculture practices and increasing concerns about environmental health and human health impacts from chemical pesticides are driving preference for biopesticides. End-user trends, including increased adoption of organic farming practices and growing consumer preference for organically grown food, are fuelling market expansion.
Mergers and acquisitions (M&A) activity is another significant aspect of the market's evolution. In recent years, there has been an increase in M&A activity, as larger companies seek to expand their portfolios and consolidate their position within the market. The number of significant M&A deals in the past three years is estimated at xx. These deals often involve the acquisition of smaller, specialized biopesticide companies by larger multinational agricultural chemical firms.
USA Bio Pesticides Market Industry Trends & Analysis
The USA Bio Pesticides Market is experiencing robust growth, driven by a confluence of factors. The increasing consumer demand for pesticide-free produce is a key factor, as are heightened environmental concerns regarding the use of synthetic pesticides and the strengthening regulatory pressures advocating for sustainable agriculture practices. Technological advancements, such as targeted biopesticide formulations and improved delivery systems, are enhancing the efficacy and market acceptance of biopesticides. The market is witnessing the emergence of novel biopesticides derived from various sources (bacteria, fungi, etc.), further expanding the market scope.
Competitive dynamics are shaping the market, with existing players investing heavily in research and development to enhance their product portfolios and expand their market reach. This leads to an increased number of new product launches and stronger marketing strategies targeted towards specific agricultural segments. The market penetration of biopesticides varies across crop types. For instance, adoption is higher in horticultural crops than in row crops, due to different regulatory frameworks and consumer preferences. The estimated market size in 2025 is xx Million, and it's projected to reach xx Million by 2033, indicating a significant growth trajectory.
Leading Markets & Segments in USA Bio Pesticides Market
The Biofungicides segment currently holds the largest market share, driven by a high prevalence of fungal diseases in various crop types and the rising consumer demand for disease-free food products. Bioinsecticides and Bioherbicides are also significant segments, displaying substantial growth potential. The "Other Biopesticides" segment reflects the diversity of biocontrol agents and specialized biopesticides developed for different niche applications.
Cash Crops: Strong economic incentives and higher profit margins associated with cash crops drive adoption of biopesticides to maintain high crop yields and quality.
Horticultural Crops: The segment presents the highest market penetration for biopesticides due to consumer preferences for organic and pesticide-free horticultural products. Stricter regulations on chemical pesticides in organic horticulture further accelerate this adoption.
Row Crops: While still having relatively lower market penetration compared to horticultural crops, the row crops segment is showing steady growth in biopesticide usage as farmers explore sustainable farming practices.
Regional dominance is observed across diverse geographical zones, depending on varied factors such as climate conditions, local agricultural practices and regulations. A detailed assessment of regional market dynamics is required for a precise determination of a leading region.
USA Bio Pesticides Market Product Developments
Recent product innovations include improved formulations offering enhanced efficacy and targeted delivery systems. Biopesticides are increasingly designed to target specific pests or diseases, thereby reducing off-target effects. The market showcases biopesticides that are combined with other sustainable agricultural practices, offering integrated pest management solutions. These developments enhance the competitive advantage of biopesticides by offering effective, safer and more environmentally sustainable alternatives to synthetic pesticides, driving greater market penetration.
Key Drivers of USA Bio Pesticides Market Growth
Several factors are driving market growth, including escalating consumer awareness of the health and environmental hazards associated with synthetic pesticides, the growing demand for organic and sustainably produced food, and increasingly stringent government regulations limiting the use of conventional chemical pesticides. Technological advancements in biopesticide formulation and delivery systems are also playing a crucial role in improving efficacy and market acceptance. Government support for sustainable agriculture practices, including financial incentives and research funding, further stimulates market expansion.
Challenges in the USA Bio Pesticides Market Market
The market faces challenges, including the relatively higher cost of biopesticides compared to synthetic counterparts, inconsistent efficacy across different environmental conditions, and the need for longer application times to achieve comparable levels of pest control. Regulatory hurdles related to approval and labeling processes can also impede market growth. Furthermore, supply chain complexities and the limited availability of certain biopesticides in some regions present significant hurdles to overcome for market expansion. The comparatively shorter shelf life of several biopesticides as compared to chemical pesticides is also a considerable challenge.
Emerging Opportunities in USA Bio Pesticides Market
The market presents significant opportunities. Advancements in biotechnology and genetic engineering are leading to the development of next-generation biopesticides with enhanced efficacy and broader applications. Strategic partnerships between biopesticide companies and agricultural technology firms are paving the way for the development of integrated pest management solutions. Expansion into new geographical markets with growing demand for sustainable agriculture, coupled with the development of novel biopesticides targeting emerging pests and diseases, represent key opportunities for market expansion.
Leading Players in the USA Bio Pesticides Market Sector
- Valent Biosciences LLC
- Bioworks Inc
- Marrone Bio Innovations Inc
- Certis USA LLC
- FMC Corporation
- Andermatt Group AG
- Indogulf BioAg LLC (Biotech Division of Indogulf Company)
- Corteva Agriscience
- Terramera Inc
- Lallemand Inc
Key Milestones in USA Bio Pesticides Market Industry
- June 2022: Certis Biologicals and Novozymes collaborated to develop new technologies for highly effective fungal disease control. This collaboration will provide new solutions to row crop growers.
- June 2022: Valent BioSciences LLC expanded its biorational manufacturing facility in Osage, Iowa, to meet rising demand and introduce new products.
- September 2022: Corteva Agriscience signed an agreement to acquire Symborg, expanding its biologicals portfolio and aiming for global leadership in agricultural biologicals.
These milestones highlight the industry's focus on innovation, collaboration, and expansion, demonstrating the dynamism of the USA Bio Pesticides Market.
Strategic Outlook for USA Bio Pesticides Market Market
The future of the USA Bio Pesticides Market looks bright, driven by increasing consumer demand, stronger environmental regulations, and significant technological innovations. Strategic partnerships and acquisitions are expected to shape the market landscape further, leading to increased competition and innovation. Companies focusing on sustainable and environmentally friendly practices will be well-positioned for future success. The market is poised for significant growth, with opportunities for both established players and new entrants who can effectively address the challenges and capitalize on the emerging opportunities.
USA Bio Pesticides Market Segmentation
- 1. Production Analysis
- 2. Consumption Analysis
- 3. Import Market Analysis (Value & Volume)
- 4. Export Market Analysis (Value & Volume)
- 5. Price Trend Analysis
USA Bio Pesticides Market Segmentation By Geography
-
1. North America
- 1.1. United States
- 1.2. Canada
- 1.3. Mexico
-
2. South America
- 2.1. Brazil
- 2.2. Argentina
- 2.3. Rest of South America
-
3. Europe
- 3.1. United Kingdom
- 3.2. Germany
- 3.3. France
- 3.4. Italy
- 3.5. Spain
- 3.6. Russia
- 3.7. Benelux
- 3.8. Nordics
- 3.9. Rest of Europe
-
4. Middle East & Africa
- 4.1. Turkey
- 4.2. Israel
- 4.3. GCC
- 4.4. North Africa
- 4.5. South Africa
- 4.6. Rest of Middle East & Africa
-
5. Asia Pacific
- 5.1. China
- 5.2. India
- 5.3. Japan
- 5.4. South Korea
- 5.5. ASEAN
- 5.6. Oceania
- 5.7. Rest of Asia Pacific
USA Bio Pesticides Market Regional Market Share
Geographic Coverage of USA Bio Pesticides Market
USA Bio Pesticides Market REPORT HIGHLIGHTS
| Aspects | Details |
|---|---|
| Study Period | 2020-2034 |
| Base Year | 2025 |
| Estimated Year | 2026 |
| Forecast Period | 2026-2034 |
| Historical Period | 2020-2025 |
| Growth Rate | CAGR of 9.1% from 2020-2034 |
| Segmentation |
|
Table of Contents
- 1. Introduction
- 1.1. Research Scope
- 1.2. Market Segmentation
- 1.3. Research Objective
- 1.4. Definitions and Assumptions
- 2. Executive Summary
- 2.1. Market Snapshot
- 3. Market Dynamics
- 3.1. Market Drivers
- 3.2. Market Restrains
- 3.3. Market Trends
- 3.4. Market Opportunities
- 4. Market Factor Analysis
- 4.1. Porters Five Forces
- 4.1.1. Bargaining Power of Suppliers
- 4.1.2. Bargaining Power of Buyers
- 4.1.3. Threat of New Entrants
- 4.1.4. Threat of Substitutes
- 4.1.5. Competitive Rivalry
- 4.2. PESTEL analysis
- 4.3. BCG Analysis
- 4.3.1. Stars (High Growth, High Market Share)
- 4.3.2. Cash Cows (Low Growth, High Market Share)
- 4.3.3. Question Mark (High Growth, Low Market Share)
- 4.3.4. Dogs (Low Growth, Low Market Share)
- 4.4. Ansoff Matrix Analysis
- 4.5. Supply Chain Analysis
- 4.6. Regulatory Landscape
- 4.7. Current Market Potential and Opportunity Assessment (TAM–SAM–SOM Framework)
- 4.8. MDP Analyst Note
- 4.1. Porters Five Forces
- 5. Market Analysis, Insights and Forecast 2021-2033
- 5.1. Market Analysis, Insights and Forecast - by Production Analysis
- 5.2. Market Analysis, Insights and Forecast - by Consumption Analysis
- 5.3. Market Analysis, Insights and Forecast - by Import Market Analysis (Value & Volume)
- 5.4. Market Analysis, Insights and Forecast - by Export Market Analysis (Value & Volume)
- 5.5. Market Analysis, Insights and Forecast - by Price Trend Analysis
- 5.6. Market Analysis, Insights and Forecast - by Region
- 5.6.1. North America
- 5.6.2. South America
- 5.6.3. Europe
- 5.6.4. Middle East & Africa
- 5.6.5. Asia Pacific
- 6. Global USA Bio Pesticides Market Analysis, Insights and Forecast, 2021-2033
- 6.1. Market Analysis, Insights and Forecast - by Production Analysis
- 6.2. Market Analysis, Insights and Forecast - by Consumption Analysis
- 6.3. Market Analysis, Insights and Forecast - by Import Market Analysis (Value & Volume)
- 6.4. Market Analysis, Insights and Forecast - by Export Market Analysis (Value & Volume)
- 6.5. Market Analysis, Insights and Forecast - by Price Trend Analysis
- 7. North America USA Bio Pesticides Market Analysis, Insights and Forecast, 2020-2032
- 7.1. Market Analysis, Insights and Forecast - by Production Analysis
- 7.2. Market Analysis, Insights and Forecast - by Consumption Analysis
- 7.3. Market Analysis, Insights and Forecast - by Import Market Analysis (Value & Volume)
- 7.4. Market Analysis, Insights and Forecast - by Export Market Analysis (Value & Volume)
- 7.5. Market Analysis, Insights and Forecast - by Price Trend Analysis
- 8. South America USA Bio Pesticides Market Analysis, Insights and Forecast, 2020-2032
- 8.1. Market Analysis, Insights and Forecast - by Production Analysis
- 8.2. Market Analysis, Insights and Forecast - by Consumption Analysis
- 8.3. Market Analysis, Insights and Forecast - by Import Market Analysis (Value & Volume)
- 8.4. Market Analysis, Insights and Forecast - by Export Market Analysis (Value & Volume)
- 8.5. Market Analysis, Insights and Forecast - by Price Trend Analysis
- 9. Europe USA Bio Pesticides Market Analysis, Insights and Forecast, 2020-2032
- 9.1. Market Analysis, Insights and Forecast - by Production Analysis
- 9.2. Market Analysis, Insights and Forecast - by Consumption Analysis
- 9.3. Market Analysis, Insights and Forecast - by Import Market Analysis (Value & Volume)
- 9.4. Market Analysis, Insights and Forecast - by Export Market Analysis (Value & Volume)
- 9.5. Market Analysis, Insights and Forecast - by Price Trend Analysis
- 10. Middle East & Africa USA Bio Pesticides Market Analysis, Insights and Forecast, 2020-2032
- 10.1. Market Analysis, Insights and Forecast - by Production Analysis
- 10.2. Market Analysis, Insights and Forecast - by Consumption Analysis
- 10.3. Market Analysis, Insights and Forecast - by Import Market Analysis (Value & Volume)
- 10.4. Market Analysis, Insights and Forecast - by Export Market Analysis (Value & Volume)
- 10.5. Market Analysis, Insights and Forecast - by Price Trend Analysis
- 11. Asia Pacific USA Bio Pesticides Market Analysis, Insights and Forecast, 2020-2032
- 11.1. Market Analysis, Insights and Forecast - by Production Analysis
- 11.2. Market Analysis, Insights and Forecast - by Consumption Analysis
- 11.3. Market Analysis, Insights and Forecast - by Import Market Analysis (Value & Volume)
- 11.4. Market Analysis, Insights and Forecast - by Export Market Analysis (Value & Volume)
- 11.5. Market Analysis, Insights and Forecast - by Price Trend Analysis
- 12. Competitive Analysis
- 12.1. Company Profiles
- 12.1.1 Valent Biosciences LL
- 12.1.1.1. Company Overview
- 12.1.1.2. Products
- 12.1.1.3. Company Financials
- 12.1.1.4. SWOT Analysis
- 12.1.2 Bioworks Inc
- 12.1.2.1. Company Overview
- 12.1.2.2. Products
- 12.1.2.3. Company Financials
- 12.1.2.4. SWOT Analysis
- 12.1.3 Marrone Bio Innovations Inc
- 12.1.3.1. Company Overview
- 12.1.3.2. Products
- 12.1.3.3. Company Financials
- 12.1.3.4. SWOT Analysis
- 12.1.4 Certis USA LLC
- 12.1.4.1. Company Overview
- 12.1.4.2. Products
- 12.1.4.3. Company Financials
- 12.1.4.4. SWOT Analysis
- 12.1.5 FMC Corporation
- 12.1.5.1. Company Overview
- 12.1.5.2. Products
- 12.1.5.3. Company Financials
- 12.1.5.4. SWOT Analysis
- 12.1.6 Andermatt Group AG
- 12.1.6.1. Company Overview
- 12.1.6.2. Products
- 12.1.6.3. Company Financials
- 12.1.6.4. SWOT Analysis
- 12.1.7 Indogulf BioAg LLC (Biotech Division of Indogulf Company)
- 12.1.7.1. Company Overview
- 12.1.7.2. Products
- 12.1.7.3. Company Financials
- 12.1.7.4. SWOT Analysis
- 12.1.8 Corteva Agriscience
- 12.1.8.1. Company Overview
- 12.1.8.2. Products
- 12.1.8.3. Company Financials
- 12.1.8.4. SWOT Analysis
- 12.1.9 Terramera Inc
- 12.1.9.1. Company Overview
- 12.1.9.2. Products
- 12.1.9.3. Company Financials
- 12.1.9.4. SWOT Analysis
- 12.1.10 Lallemand Inc
- 12.1.10.1. Company Overview
- 12.1.10.2. Products
- 12.1.10.3. Company Financials
- 12.1.10.4. SWOT Analysis
- 12.1.1 Valent Biosciences LL
- 12.2. Market Entropy
- 12.2.1 Company's Key Areas Served
- 12.2.2 Recent Developments
- 12.3. Company Market Share Analysis 2025
- 12.3.1 Top 5 Companies Market Share Analysis
- 12.3.2 Top 3 Companies Market Share Analysis
- 12.4. List of Potential Customers
- 13. Research Methodology
List of Figures
- Figure 1: Global USA Bio Pesticides Market Revenue Breakdown (undefined, %) by Region 2025 & 2033
- Figure 2: North America USA Bio Pesticides Market Revenue (undefined), by Production Analysis 2025 & 2033
- Figure 3: North America USA Bio Pesticides Market Revenue Share (%), by Production Analysis 2025 & 2033
- Figure 4: North America USA Bio Pesticides Market Revenue (undefined), by Consumption Analysis 2025 & 2033
- Figure 5: North America USA Bio Pesticides Market Revenue Share (%), by Consumption Analysis 2025 & 2033
- Figure 6: North America USA Bio Pesticides Market Revenue (undefined), by Import Market Analysis (Value & Volume) 2025 & 2033
- Figure 7: North America USA Bio Pesticides Market Revenue Share (%), by Import Market Analysis (Value & Volume) 2025 & 2033
- Figure 8: North America USA Bio Pesticides Market Revenue (undefined), by Export Market Analysis (Value & Volume) 2025 & 2033
- Figure 9: North America USA Bio Pesticides Market Revenue Share (%), by Export Market Analysis (Value & Volume) 2025 & 2033
- Figure 10: North America USA Bio Pesticides Market Revenue (undefined), by Price Trend Analysis 2025 & 2033
- Figure 11: North America USA Bio Pesticides Market Revenue Share (%), by Price Trend Analysis 2025 & 2033
- Figure 12: North America USA Bio Pesticides Market Revenue (undefined), by Country 2025 & 2033
- Figure 13: North America USA Bio Pesticides Market Revenue Share (%), by Country 2025 & 2033
- Figure 14: South America USA Bio Pesticides Market Revenue (undefined), by Production Analysis 2025 & 2033
- Figure 15: South America USA Bio Pesticides Market Revenue Share (%), by Production Analysis 2025 & 2033
- Figure 16: South America USA Bio Pesticides Market Revenue (undefined), by Consumption Analysis 2025 & 2033
- Figure 17: South America USA Bio Pesticides Market Revenue Share (%), by Consumption Analysis 2025 & 2033
- Figure 18: South America USA Bio Pesticides Market Revenue (undefined), by Import Market Analysis (Value & Volume) 2025 & 2033
- Figure 19: South America USA Bio Pesticides Market Revenue Share (%), by Import Market Analysis (Value & Volume) 2025 & 2033
- Figure 20: South America USA Bio Pesticides Market Revenue (undefined), by Export Market Analysis (Value & Volume) 2025 & 2033
- Figure 21: South America USA Bio Pesticides Market Revenue Share (%), by Export Market Analysis (Value & Volume) 2025 & 2033
- Figure 22: South America USA Bio Pesticides Market Revenue (undefined), by Price Trend Analysis 2025 & 2033
- Figure 23: South America USA Bio Pesticides Market Revenue Share (%), by Price Trend Analysis 2025 & 2033
- Figure 24: South America USA Bio Pesticides Market Revenue (undefined), by Country 2025 & 2033
- Figure 25: South America USA Bio Pesticides Market Revenue Share (%), by Country 2025 & 2033
- Figure 26: Europe USA Bio Pesticides Market Revenue (undefined), by Production Analysis 2025 & 2033
- Figure 27: Europe USA Bio Pesticides Market Revenue Share (%), by Production Analysis 2025 & 2033
- Figure 28: Europe USA Bio Pesticides Market Revenue (undefined), by Consumption Analysis 2025 & 2033
- Figure 29: Europe USA Bio Pesticides Market Revenue Share (%), by Consumption Analysis 2025 & 2033
- Figure 30: Europe USA Bio Pesticides Market Revenue (undefined), by Import Market Analysis (Value & Volume) 2025 & 2033
- Figure 31: Europe USA Bio Pesticides Market Revenue Share (%), by Import Market Analysis (Value & Volume) 2025 & 2033
- Figure 32: Europe USA Bio Pesticides Market Revenue (undefined), by Export Market Analysis (Value & Volume) 2025 & 2033
- Figure 33: Europe USA Bio Pesticides Market Revenue Share (%), by Export Market Analysis (Value & Volume) 2025 & 2033
- Figure 34: Europe USA Bio Pesticides Market Revenue (undefined), by Price Trend Analysis 2025 & 2033
- Figure 35: Europe USA Bio Pesticides Market Revenue Share (%), by Price Trend Analysis 2025 & 2033
- Figure 36: Europe USA Bio Pesticides Market Revenue (undefined), by Country 2025 & 2033
- Figure 37: Europe USA Bio Pesticides Market Revenue Share (%), by Country 2025 & 2033
- Figure 38: Middle East & Africa USA Bio Pesticides Market Revenue (undefined), by Production Analysis 2025 & 2033
- Figure 39: Middle East & Africa USA Bio Pesticides Market Revenue Share (%), by Production Analysis 2025 & 2033
- Figure 40: Middle East & Africa USA Bio Pesticides Market Revenue (undefined), by Consumption Analysis 2025 & 2033
- Figure 41: Middle East & Africa USA Bio Pesticides Market Revenue Share (%), by Consumption Analysis 2025 & 2033
- Figure 42: Middle East & Africa USA Bio Pesticides Market Revenue (undefined), by Import Market Analysis (Value & Volume) 2025 & 2033
- Figure 43: Middle East & Africa USA Bio Pesticides Market Revenue Share (%), by Import Market Analysis (Value & Volume) 2025 & 2033
- Figure 44: Middle East & Africa USA Bio Pesticides Market Revenue (undefined), by Export Market Analysis (Value & Volume) 2025 & 2033
- Figure 45: Middle East & Africa USA Bio Pesticides Market Revenue Share (%), by Export Market Analysis (Value & Volume) 2025 & 2033
- Figure 46: Middle East & Africa USA Bio Pesticides Market Revenue (undefined), by Price Trend Analysis 2025 & 2033
- Figure 47: Middle East & Africa USA Bio Pesticides Market Revenue Share (%), by Price Trend Analysis 2025 & 2033
- Figure 48: Middle East & Africa USA Bio Pesticides Market Revenue (undefined), by Country 2025 & 2033
- Figure 49: Middle East & Africa USA Bio Pesticides Market Revenue Share (%), by Country 2025 & 2033
- Figure 50: Asia Pacific USA Bio Pesticides Market Revenue (undefined), by Production Analysis 2025 & 2033
- Figure 51: Asia Pacific USA Bio Pesticides Market Revenue Share (%), by Production Analysis 2025 & 2033
- Figure 52: Asia Pacific USA Bio Pesticides Market Revenue (undefined), by Consumption Analysis 2025 & 2033
- Figure 53: Asia Pacific USA Bio Pesticides Market Revenue Share (%), by Consumption Analysis 2025 & 2033
- Figure 54: Asia Pacific USA Bio Pesticides Market Revenue (undefined), by Import Market Analysis (Value & Volume) 2025 & 2033
- Figure 55: Asia Pacific USA Bio Pesticides Market Revenue Share (%), by Import Market Analysis (Value & Volume) 2025 & 2033
- Figure 56: Asia Pacific USA Bio Pesticides Market Revenue (undefined), by Export Market Analysis (Value & Volume) 2025 & 2033
- Figure 57: Asia Pacific USA Bio Pesticides Market Revenue Share (%), by Export Market Analysis (Value & Volume) 2025 & 2033
- Figure 58: Asia Pacific USA Bio Pesticides Market Revenue (undefined), by Price Trend Analysis 2025 & 2033
- Figure 59: Asia Pacific USA Bio Pesticides Market Revenue Share (%), by Price Trend Analysis 2025 & 2033
- Figure 60: Asia Pacific USA Bio Pesticides Market Revenue (undefined), by Country 2025 & 2033
- Figure 61: Asia Pacific USA Bio Pesticides Market Revenue Share (%), by Country 2025 & 2033
List of Tables
- Table 1: Global USA Bio Pesticides Market Revenue undefined Forecast, by Production Analysis 2020 & 2033
- Table 2: Global USA Bio Pesticides Market Revenue undefined Forecast, by Consumption Analysis 2020 & 2033
- Table 3: Global USA Bio Pesticides Market Revenue undefined Forecast, by Import Market Analysis (Value & Volume) 2020 & 2033
- Table 4: Global USA Bio Pesticides Market Revenue undefined Forecast, by Export Market Analysis (Value & Volume) 2020 & 2033
- Table 5: Global USA Bio Pesticides Market Revenue undefined Forecast, by Price Trend Analysis 2020 & 2033
- Table 6: Global USA Bio Pesticides Market Revenue undefined Forecast, by Region 2020 & 2033
- Table 7: Global USA Bio Pesticides Market Revenue undefined Forecast, by Production Analysis 2020 & 2033
- Table 8: Global USA Bio Pesticides Market Revenue undefined Forecast, by Consumption Analysis 2020 & 2033
- Table 9: Global USA Bio Pesticides Market Revenue undefined Forecast, by Import Market Analysis (Value & Volume) 2020 & 2033
- Table 10: Global USA Bio Pesticides Market Revenue undefined Forecast, by Export Market Analysis (Value & Volume) 2020 & 2033
- Table 11: Global USA Bio Pesticides Market Revenue undefined Forecast, by Price Trend Analysis 2020 & 2033
- Table 12: Global USA Bio Pesticides Market Revenue undefined Forecast, by Country 2020 & 2033
- Table 13: United States USA Bio Pesticides Market Revenue (undefined) Forecast, by Application 2020 & 2033
- Table 14: Canada USA Bio Pesticides Market Revenue (undefined) Forecast, by Application 2020 & 2033
- Table 15: Mexico USA Bio Pesticides Market Revenue (undefined) Forecast, by Application 2020 & 2033
- Table 16: Global USA Bio Pesticides Market Revenue undefined Forecast, by Production Analysis 2020 & 2033
- Table 17: Global USA Bio Pesticides Market Revenue undefined Forecast, by Consumption Analysis 2020 & 2033
- Table 18: Global USA Bio Pesticides Market Revenue undefined Forecast, by Import Market Analysis (Value & Volume) 2020 & 2033
- Table 19: Global USA Bio Pesticides Market Revenue undefined Forecast, by Export Market Analysis (Value & Volume) 2020 & 2033
- Table 20: Global USA Bio Pesticides Market Revenue undefined Forecast, by Price Trend Analysis 2020 & 2033
- Table 21: Global USA Bio Pesticides Market Revenue undefined Forecast, by Country 2020 & 2033
- Table 22: Brazil USA Bio Pesticides Market Revenue (undefined) Forecast, by Application 2020 & 2033
- Table 23: Argentina USA Bio Pesticides Market Revenue (undefined) Forecast, by Application 2020 & 2033
- Table 24: Rest of South America USA Bio Pesticides Market Revenue (undefined) Forecast, by Application 2020 & 2033
- Table 25: Global USA Bio Pesticides Market Revenue undefined Forecast, by Production Analysis 2020 & 2033
- Table 26: Global USA Bio Pesticides Market Revenue undefined Forecast, by Consumption Analysis 2020 & 2033
- Table 27: Global USA Bio Pesticides Market Revenue undefined Forecast, by Import Market Analysis (Value & Volume) 2020 & 2033
- Table 28: Global USA Bio Pesticides Market Revenue undefined Forecast, by Export Market Analysis (Value & Volume) 2020 & 2033
- Table 29: Global USA Bio Pesticides Market Revenue undefined Forecast, by Price Trend Analysis 2020 & 2033
- Table 30: Global USA Bio Pesticides Market Revenue undefined Forecast, by Country 2020 & 2033
- Table 31: United Kingdom USA Bio Pesticides Market Revenue (undefined) Forecast, by Application 2020 & 2033
- Table 32: Germany USA Bio Pesticides Market Revenue (undefined) Forecast, by Application 2020 & 2033
- Table 33: France USA Bio Pesticides Market Revenue (undefined) Forecast, by Application 2020 & 2033
- Table 34: Italy USA Bio Pesticides Market Revenue (undefined) Forecast, by Application 2020 & 2033
- Table 35: Spain USA Bio Pesticides Market Revenue (undefined) Forecast, by Application 2020 & 2033
- Table 36: Russia USA Bio Pesticides Market Revenue (undefined) Forecast, by Application 2020 & 2033
- Table 37: Benelux USA Bio Pesticides Market Revenue (undefined) Forecast, by Application 2020 & 2033
- Table 38: Nordics USA Bio Pesticides Market Revenue (undefined) Forecast, by Application 2020 & 2033
- Table 39: Rest of Europe USA Bio Pesticides Market Revenue (undefined) Forecast, by Application 2020 & 2033
- Table 40: Global USA Bio Pesticides Market Revenue undefined Forecast, by Production Analysis 2020 & 2033
- Table 41: Global USA Bio Pesticides Market Revenue undefined Forecast, by Consumption Analysis 2020 & 2033
- Table 42: Global USA Bio Pesticides Market Revenue undefined Forecast, by Import Market Analysis (Value & Volume) 2020 & 2033
- Table 43: Global USA Bio Pesticides Market Revenue undefined Forecast, by Export Market Analysis (Value & Volume) 2020 & 2033
- Table 44: Global USA Bio Pesticides Market Revenue undefined Forecast, by Price Trend Analysis 2020 & 2033
- Table 45: Global USA Bio Pesticides Market Revenue undefined Forecast, by Country 2020 & 2033
- Table 46: Turkey USA Bio Pesticides Market Revenue (undefined) Forecast, by Application 2020 & 2033
- Table 47: Israel USA Bio Pesticides Market Revenue (undefined) Forecast, by Application 2020 & 2033
- Table 48: GCC USA Bio Pesticides Market Revenue (undefined) Forecast, by Application 2020 & 2033
- Table 49: North Africa USA Bio Pesticides Market Revenue (undefined) Forecast, by Application 2020 & 2033
- Table 50: South Africa USA Bio Pesticides Market Revenue (undefined) Forecast, by Application 2020 & 2033
- Table 51: Rest of Middle East & Africa USA Bio Pesticides Market Revenue (undefined) Forecast, by Application 2020 & 2033
- Table 52: Global USA Bio Pesticides Market Revenue undefined Forecast, by Production Analysis 2020 & 2033
- Table 53: Global USA Bio Pesticides Market Revenue undefined Forecast, by Consumption Analysis 2020 & 2033
- Table 54: Global USA Bio Pesticides Market Revenue undefined Forecast, by Import Market Analysis (Value & Volume) 2020 & 2033
- Table 55: Global USA Bio Pesticides Market Revenue undefined Forecast, by Export Market Analysis (Value & Volume) 2020 & 2033
- Table 56: Global USA Bio Pesticides Market Revenue undefined Forecast, by Price Trend Analysis 2020 & 2033
- Table 57: Global USA Bio Pesticides Market Revenue undefined Forecast, by Country 2020 & 2033
- Table 58: China USA Bio Pesticides Market Revenue (undefined) Forecast, by Application 2020 & 2033
- Table 59: India USA Bio Pesticides Market Revenue (undefined) Forecast, by Application 2020 & 2033
- Table 60: Japan USA Bio Pesticides Market Revenue (undefined) Forecast, by Application 2020 & 2033
- Table 61: South Korea USA Bio Pesticides Market Revenue (undefined) Forecast, by Application 2020 & 2033
- Table 62: ASEAN USA Bio Pesticides Market Revenue (undefined) Forecast, by Application 2020 & 2033
- Table 63: Oceania USA Bio Pesticides Market Revenue (undefined) Forecast, by Application 2020 & 2033
- Table 64: Rest of Asia Pacific USA Bio Pesticides Market Revenue (undefined) Forecast, by Application 2020 & 2033
Frequently Asked Questions
1. What is the projected Compound Annual Growth Rate (CAGR) of the USA Bio Pesticides Market?
The projected CAGR is approximately 9.1%.
2. Which companies are prominent players in the USA Bio Pesticides Market?
Key companies in the market include Valent Biosciences LL, Bioworks Inc, Marrone Bio Innovations Inc, Certis USA LLC, FMC Corporation, Andermatt Group AG, Indogulf BioAg LLC (Biotech Division of Indogulf Company), Corteva Agriscience, Terramera Inc, Lallemand Inc.
3. What are the main segments of the USA Bio Pesticides Market?
The market segments include Production Analysis, Consumption Analysis, Import Market Analysis (Value & Volume), Export Market Analysis (Value & Volume), Price Trend Analysis.
4. Can you provide details about the market size?
The market size is estimated to be USD XXX N/A as of 2022.
5. What are some drivers contributing to market growth?
Seed Treatment As A Solution To Enhance Yield; Growing Awareness For Seed Treatment Among The Farmers; Rising Trend Of Organic Farming.
6. What are the notable trends driving market growth?
Row Crops is the largest Crop Type.
7. Are there any restraints impacting market growth?
Limitations Across Farm-Level Seed Treatment; Rising Environmental Concerns.
8. Can you provide examples of recent developments in the market?
September 2022: Corteva Agriscience signed an agreement to acquire a biologicals-based company Symborg as a part of its strategy to expand its biologicals portfolio. This move would help Corteva Agriscience in achieving its aim to become a global leader in the agricultural biologicals market.June 2022: Certis Biologicals and Novozymes, two leading agricultural biotechnology companies, collaborated to develop new technologies for highly effective fungal disease control. This collaboration will provide new solutions to row crop growers.June 2022: Valent BioSciences LLC confirmed that it had approved a big expansion of its biorational manufacturing facility in Osage, Iowa, to meet the rising demand for its biorational products and introduce new products that will necessitate more capacity.
9. What pricing options are available for accessing the report?
Pricing options include single-user, multi-user, and enterprise licenses priced at USD 3800, USD 4500, and USD 5800 respectively.
10. Is the market size provided in terms of value or volume?
The market size is provided in terms of value, measured in N/A.
11. Are there any specific market keywords associated with the report?
Yes, the market keyword associated with the report is "USA Bio Pesticides Market," which aids in identifying and referencing the specific market segment covered.
12. How do I determine which pricing option suits my needs best?
The pricing options vary based on user requirements and access needs. Individual users may opt for single-user licenses, while businesses requiring broader access may choose multi-user or enterprise licenses for cost-effective access to the report.
13. Are there any additional resources or data provided in the USA Bio Pesticides Market report?
While the report offers comprehensive insights, it's advisable to review the specific contents or supplementary materials provided to ascertain if additional resources or data are available.
14. How can I stay updated on further developments or reports in the USA Bio Pesticides Market?
To stay informed about further developments, trends, and reports in the USA Bio Pesticides Market, consider subscribing to industry newsletters, following relevant companies and organizations, or regularly checking reputable industry news sources and publications.
Methodology
Step 1 - Identification of Relevant Samples Size from Population Database


Step 2 - Approaches for Defining Global Market Size (Value, Volume* & Price*)

Note*: In applicable scenarios
Step 3 - Data Sources
Primary Research
- Web Analytics
- Survey Reports
- Research Institute
- Latest Research Reports
- Opinion Leaders
Secondary Research
- Annual Reports
- White Paper
- Latest Press Release
- Industry Association
- Paid Database
- Investor Presentations

Step 4 - Data Triangulation
Involves using different sources of information in order to increase the validity of a study
These sources are likely to be stakeholders in a program - participants, other researchers, program staff, other community members, and so on.
Then we put all data in single framework & apply various statistical tools to find out the dynamic on the market.
During the analysis stage, feedback from the stakeholder groups would be compared to determine areas of agreement as well as areas of divergence