

Key Insights
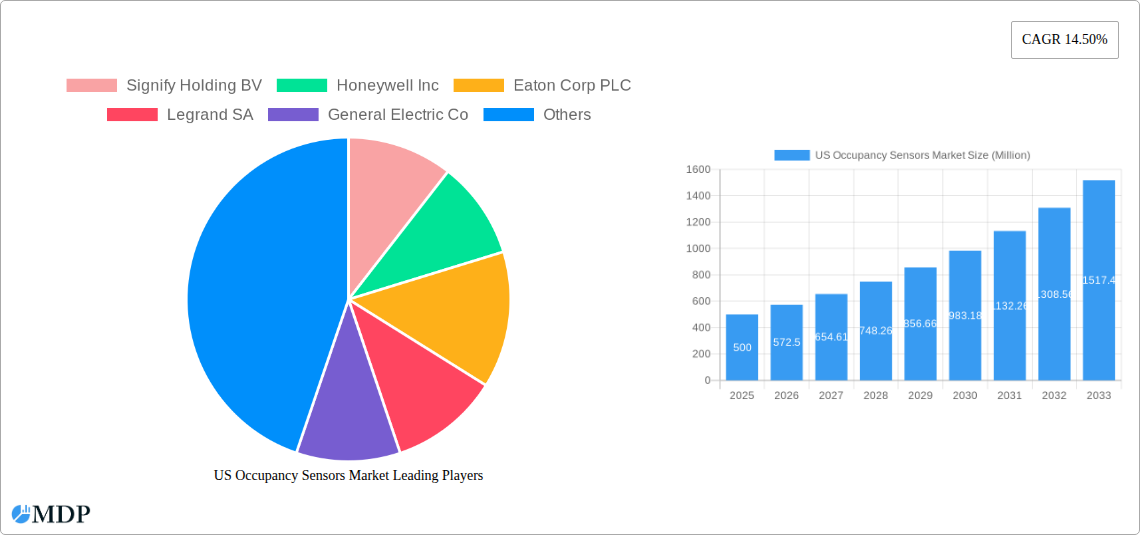
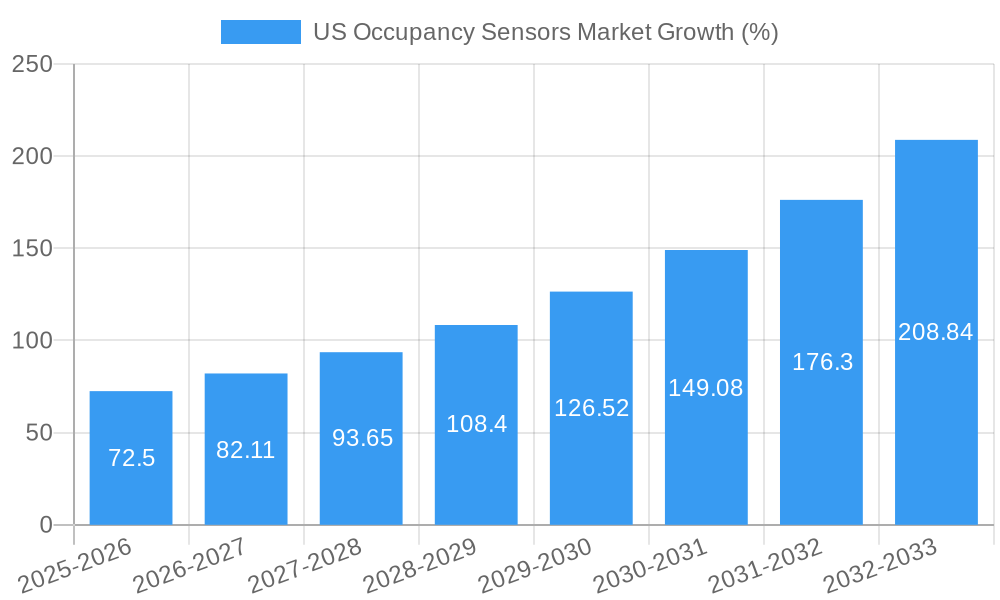
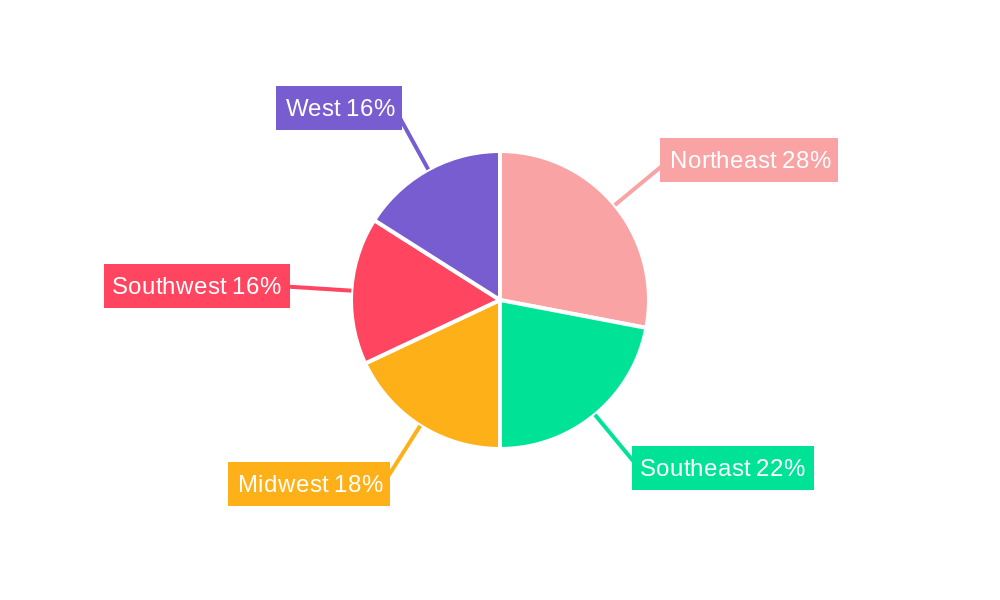
The US occupancy sensor market is experiencing robust growth, driven by increasing energy efficiency mandates, the rising adoption of smart building technologies, and a growing focus on enhancing workplace safety and security. The market, segmented by application (lighting control, HVAC, security and surveillance), building type (residential, commercial), network type (wired, wireless), and technology (ultrasonic, passive infrared, microwave), shows significant potential across all segments. The commercial sector, particularly in large office buildings and retail spaces, is a major driver of market expansion due to the substantial energy savings achievable through optimized occupancy-based control systems. The shift towards wireless technologies is also a key trend, offering greater flexibility, ease of installation, and reduced wiring costs compared to wired systems. While initial investment costs can be a restraint, the long-term return on investment (ROI) through reduced energy consumption and improved operational efficiency makes occupancy sensors an attractive proposition for building owners and managers. Considering a 2025 market size of $XX million and a CAGR of 14.5%, we can project substantial market expansion throughout the forecast period (2025-2033). Technological advancements, particularly in the development of more accurate and reliable sensor technologies, further fuel market growth. The Northeast region of the US, given its dense urban centers and high concentration of commercial buildings, likely holds a significant market share.
Growth is anticipated to be strongest in the wireless and smart building segments. The increasing popularity of IoT (Internet of Things) devices and their integration with occupancy sensors for enhanced data analytics and automation are also shaping market dynamics. Passive infrared (PIR) sensors currently dominate the technology segment due to their cost-effectiveness and reliability. However, the adoption of other technologies, such as ultrasonic and microwave sensors, is expected to increase, particularly in applications requiring higher accuracy or detection in challenging environments. Regulatory pressures and government incentives aimed at promoting energy conservation are also expected to contribute positively to the market's growth trajectory over the forecast period. The competitive landscape is characterized by both established players and emerging technology providers, leading to continuous innovation and a diverse range of solutions.
US Occupancy Sensors Market: A Comprehensive Report (2019-2033)
This in-depth report provides a comprehensive analysis of the US Occupancy Sensors Market, covering market dynamics, industry trends, leading segments, key players, and future growth prospects. The study period spans from 2019 to 2033, with 2025 serving as the base and estimated year. The forecast period is 2025-2033, and the historical period covers 2019-2024. The market size is projected to reach xx Million by 2033, exhibiting a CAGR of xx% during the forecast period. This report is essential for industry stakeholders, investors, and businesses seeking to understand and capitalize on the opportunities within this dynamic market.
US Occupancy Sensors Market Market Dynamics & Concentration
The US Occupancy Sensors Market is characterized by a moderately concentrated landscape with several key players holding significant market share. The market share of the top five companies is estimated at xx%, indicating a competitive yet consolidated environment. Innovation is a key driver, with companies continuously developing advanced sensor technologies like ultrasonic, passive infrared, and microwave sensors to improve accuracy, efficiency, and functionality. Stringent energy efficiency regulations are pushing the adoption of occupancy sensors across various building types, driving market growth. Product substitutes, such as timers and manual switches, pose a competitive challenge, particularly in cost-sensitive applications. End-user trends, including increasing demand for smart buildings and energy management solutions, are fueling market expansion. The M&A activity in the sector has been moderate, with approximately xx deals recorded in the past five years. This consolidation reflects the strategic focus on expanding product portfolios and market reach.
- Market Concentration: Top 5 players hold xx% market share.
- Innovation Drivers: Advanced sensor technologies, IoT integration, AI-powered analytics.
- Regulatory Framework: Energy efficiency standards driving adoption.
- Product Substitutes: Timers, manual switches.
- End-User Trends: Growing demand for smart buildings and energy management systems.
- M&A Activity: Approximately xx deals in the last 5 years.
US Occupancy Sensors Market Industry Trends & Analysis
The US Occupancy Sensors Market is experiencing robust growth, driven by factors such as increasing urbanization, rising energy costs, and the growing adoption of smart building technologies. The market is witnessing significant technological disruptions, with the integration of IoT, AI, and cloud computing enhancing the capabilities of occupancy sensors. Consumer preferences are shifting towards energy-efficient and user-friendly solutions, fueling demand for smart occupancy sensors with advanced features. The competitive landscape is dynamic, with established players focusing on product innovation and market expansion while new entrants are disrupting the market with innovative solutions and competitive pricing strategies. The market penetration of occupancy sensors in commercial buildings is higher compared to residential buildings, reflecting the greater emphasis on energy savings and building automation in commercial spaces. The market is expected to witness a CAGR of xx% during the forecast period.
Leading Markets & Segments in US Occupancy Sensors Market
The Commercial segment dominates the US Occupancy Sensors Market, driven by the higher adoption rates in office buildings, retail spaces, and industrial facilities. Within the application segments, Lighting Control holds the largest market share, followed by HVAC and Security & Surveillance. Passive Infrared (PIR) technology is currently the most prevalent, but Ultrasonic and Microwave technologies are gaining traction due to their enhanced performance and capabilities. Wireless networks are increasingly preferred over wired networks due to their flexibility and ease of installation.
Key Drivers:
- Commercial Segment: Higher adoption rates in office buildings, retail spaces, and industrial facilities due to higher ROI and energy efficiency standards.
- Lighting Control Application: Significant energy savings and improved user experience.
- Passive Infrared (PIR) Technology: Cost-effectiveness and reliable performance.
- Wireless Network Type: Ease of installation and flexibility.
US Occupancy Sensors Market Product Developments
Recent product innovations include the integration of IoT capabilities, enhanced data analytics, and improved energy efficiency. Companies are focusing on developing sensors with advanced features such as occupancy counting, ambient light sensing, and integration with building management systems. These advancements aim to provide more accurate and comprehensive data for improved energy management and building automation. The market is witnessing a shift towards smaller, more discreet sensors with improved aesthetics to seamlessly blend into building interiors.
Key Drivers of US Occupancy Sensors Market Growth
The growth of the US Occupancy Sensors Market is primarily driven by increasing energy efficiency regulations, rising awareness of energy conservation, and the growing adoption of smart building technologies. The decreasing cost of sensors and the increasing availability of advanced technologies like IoT are further contributing to market expansion. Government initiatives promoting energy efficiency and sustainable building practices are also playing a significant role.
Challenges in the US Occupancy Sensors Market Market
Challenges include the high initial investment cost of installing occupancy sensors, concerns about data privacy and security, and the potential for malfunctioning or inaccurate sensors. Supply chain disruptions and the competitive pressure from low-cost sensor manufacturers also pose challenges to the market. These factors can negatively impact the market growth rate, potentially reducing it by xx% in specific scenarios.
Emerging Opportunities in US Occupancy Sensors Market
Emerging opportunities lie in the integration of occupancy sensors with other smart building technologies, such as lighting control systems, HVAC systems, and security systems. The development of advanced analytics capabilities to extract valuable insights from sensor data is another key opportunity. Expanding into new applications, such as healthcare facilities and educational institutions, represents another potential growth area.
Leading Players in the US Occupancy Sensors Market Sector
- Signify Holding BV
- Honeywell Inc
- Eaton Corp PLC
- Legrand SA
- General Electric Co
- Dwyer Instruments Inc
- Schneider Electric SE
- Johnson Controls Inc
- Analog Devices Inc
- Texas Instruments Inc
- *List Not Exhaustive
Key Milestones in US Occupancy Sensors Market Industry
- March 2020: Signify introduced new Philips IoT sensor packages that gather and deliver data via the Interact Office connected lighting system and environmental monitoring APIs. The sensor bundles can observe occupancy, the total of people in the room, temperature (at the room and desk level), noise levels, daylight levels, relative humidity, and are Bluetooth enabled, allowing for indoor positioning and navigation. This launch significantly enhanced the capabilities of occupancy sensors and accelerated market adoption of IoT-enabled solutions.
Strategic Outlook for US Occupancy Sensors Market Market
The US Occupancy Sensors Market is poised for significant growth in the coming years, driven by ongoing technological advancements, increasing demand for smart buildings, and supportive government policies. Strategic opportunities include focusing on product innovation, expanding into new applications and markets, and forming strategic partnerships to leverage synergies and enhance market reach. Companies that can effectively address the challenges and capitalize on the emerging opportunities are well-positioned for success in this rapidly evolving market.
US Occupancy Sensors Market Segmentation
-
1. Network Type
- 1.1. Wired
- 1.2. Wireless
-
2. Technology
- 2.1. Ultrasonic
- 2.2. Passive Infrared
- 2.3. Microwave
-
3. Application
- 3.1. Lighting Control
- 3.2. HVAC
- 3.3. Security and Surveillance
-
4. Building Type
- 4.1. Residential
- 4.2. Commercial
US Occupancy Sensors Market Segmentation By Geography
-
1. North America
- 1.1. United States
- 1.2. Canada
- 1.3. Mexico
-
2. South America
- 2.1. Brazil
- 2.2. Argentina
- 2.3. Rest of South America
-
3. Europe
- 3.1. United Kingdom
- 3.2. Germany
- 3.3. France
- 3.4. Italy
- 3.5. Spain
- 3.6. Russia
- 3.7. Benelux
- 3.8. Nordics
- 3.9. Rest of Europe
-
4. Middle East & Africa
- 4.1. Turkey
- 4.2. Israel
- 4.3. GCC
- 4.4. North Africa
- 4.5. South Africa
- 4.6. Rest of Middle East & Africa
-
5. Asia Pacific
- 5.1. China
- 5.2. India
- 5.3. Japan
- 5.4. South Korea
- 5.5. ASEAN
- 5.6. Oceania
- 5.7. Rest of Asia Pacific
US Occupancy Sensors Market REPORT HIGHLIGHTS
| Aspects | Details |
|---|---|
| Study Period | 2019-2033 |
| Base Year | 2024 |
| Estimated Year | 2025 |
| Forecast Period | 2025-2033 |
| Historical Period | 2019-2024 |
| Growth Rate | CAGR of 14.50% from 2019-2033 |
| Segmentation |
|
Table of Contents
- 1. Introduction
- 1.1. Research Scope
- 1.2. Market Segmentation
- 1.3. Research Methodology
- 1.4. Definitions and Assumptions
- 2. Executive Summary
- 2.1. Introduction
- 3. Market Dynamics
- 3.1. Introduction
- 3.2. Market Drivers
- 3.2.1. Rising Demand for Energy Efficient Devices; Demand for Passive Infrared Due to Low Cost and High Energy Efficiency
- 3.3. Market Restrains
- 3.3.1. Cryptojacking Threats
- 3.4. Market Trends
- 3.4.1. Residential Expected to Witness Significant Growth
- 4. Market Factor Analysis
- 4.1. Porters Five Forces
- 4.2. Supply/Value Chain
- 4.3. PESTEL analysis
- 4.4. Market Entropy
- 4.5. Patent/Trademark Analysis
- 5. Global US Occupancy Sensors Market Analysis, Insights and Forecast, 2019-2031
- 5.1. Market Analysis, Insights and Forecast - by Network Type
- 5.1.1. Wired
- 5.1.2. Wireless
- 5.2. Market Analysis, Insights and Forecast - by Technology
- 5.2.1. Ultrasonic
- 5.2.2. Passive Infrared
- 5.2.3. Microwave
- 5.3. Market Analysis, Insights and Forecast - by Application
- 5.3.1. Lighting Control
- 5.3.2. HVAC
- 5.3.3. Security and Surveillance
- 5.4. Market Analysis, Insights and Forecast - by Building Type
- 5.4.1. Residential
- 5.4.2. Commercial
- 5.5. Market Analysis, Insights and Forecast - by Region
- 5.5.1. North America
- 5.5.2. South America
- 5.5.3. Europe
- 5.5.4. Middle East & Africa
- 5.5.5. Asia Pacific
- 5.1. Market Analysis, Insights and Forecast - by Network Type
- 6. North America US Occupancy Sensors Market Analysis, Insights and Forecast, 2019-2031
- 6.1. Market Analysis, Insights and Forecast - by Network Type
- 6.1.1. Wired
- 6.1.2. Wireless
- 6.2. Market Analysis, Insights and Forecast - by Technology
- 6.2.1. Ultrasonic
- 6.2.2. Passive Infrared
- 6.2.3. Microwave
- 6.3. Market Analysis, Insights and Forecast - by Application
- 6.3.1. Lighting Control
- 6.3.2. HVAC
- 6.3.3. Security and Surveillance
- 6.4. Market Analysis, Insights and Forecast - by Building Type
- 6.4.1. Residential
- 6.4.2. Commercial
- 6.1. Market Analysis, Insights and Forecast - by Network Type
- 7. South America US Occupancy Sensors Market Analysis, Insights and Forecast, 2019-2031
- 7.1. Market Analysis, Insights and Forecast - by Network Type
- 7.1.1. Wired
- 7.1.2. Wireless
- 7.2. Market Analysis, Insights and Forecast - by Technology
- 7.2.1. Ultrasonic
- 7.2.2. Passive Infrared
- 7.2.3. Microwave
- 7.3. Market Analysis, Insights and Forecast - by Application
- 7.3.1. Lighting Control
- 7.3.2. HVAC
- 7.3.3. Security and Surveillance
- 7.4. Market Analysis, Insights and Forecast - by Building Type
- 7.4.1. Residential
- 7.4.2. Commercial
- 7.1. Market Analysis, Insights and Forecast - by Network Type
- 8. Europe US Occupancy Sensors Market Analysis, Insights and Forecast, 2019-2031
- 8.1. Market Analysis, Insights and Forecast - by Network Type
- 8.1.1. Wired
- 8.1.2. Wireless
- 8.2. Market Analysis, Insights and Forecast - by Technology
- 8.2.1. Ultrasonic
- 8.2.2. Passive Infrared
- 8.2.3. Microwave
- 8.3. Market Analysis, Insights and Forecast - by Application
- 8.3.1. Lighting Control
- 8.3.2. HVAC
- 8.3.3. Security and Surveillance
- 8.4. Market Analysis, Insights and Forecast - by Building Type
- 8.4.1. Residential
- 8.4.2. Commercial
- 8.1. Market Analysis, Insights and Forecast - by Network Type
- 9. Middle East & Africa US Occupancy Sensors Market Analysis, Insights and Forecast, 2019-2031
- 9.1. Market Analysis, Insights and Forecast - by Network Type
- 9.1.1. Wired
- 9.1.2. Wireless
- 9.2. Market Analysis, Insights and Forecast - by Technology
- 9.2.1. Ultrasonic
- 9.2.2. Passive Infrared
- 9.2.3. Microwave
- 9.3. Market Analysis, Insights and Forecast - by Application
- 9.3.1. Lighting Control
- 9.3.2. HVAC
- 9.3.3. Security and Surveillance
- 9.4. Market Analysis, Insights and Forecast - by Building Type
- 9.4.1. Residential
- 9.4.2. Commercial
- 9.1. Market Analysis, Insights and Forecast - by Network Type
- 10. Asia Pacific US Occupancy Sensors Market Analysis, Insights and Forecast, 2019-2031
- 10.1. Market Analysis, Insights and Forecast - by Network Type
- 10.1.1. Wired
- 10.1.2. Wireless
- 10.2. Market Analysis, Insights and Forecast - by Technology
- 10.2.1. Ultrasonic
- 10.2.2. Passive Infrared
- 10.2.3. Microwave
- 10.3. Market Analysis, Insights and Forecast - by Application
- 10.3.1. Lighting Control
- 10.3.2. HVAC
- 10.3.3. Security and Surveillance
- 10.4. Market Analysis, Insights and Forecast - by Building Type
- 10.4.1. Residential
- 10.4.2. Commercial
- 10.1. Market Analysis, Insights and Forecast - by Network Type
- 11. Northeast US Occupancy Sensors Market Analysis, Insights and Forecast, 2019-2031
- 12. Southeast US Occupancy Sensors Market Analysis, Insights and Forecast, 2019-2031
- 13. Midwest US Occupancy Sensors Market Analysis, Insights and Forecast, 2019-2031
- 14. Southwest US Occupancy Sensors Market Analysis, Insights and Forecast, 2019-2031
- 15. West US Occupancy Sensors Market Analysis, Insights and Forecast, 2019-2031
- 16. Competitive Analysis
- 16.1. Global Market Share Analysis 2024
- 16.2. Company Profiles
- 16.2.1 Signify Holding BV
- 16.2.1.1. Overview
- 16.2.1.2. Products
- 16.2.1.3. SWOT Analysis
- 16.2.1.4. Recent Developments
- 16.2.1.5. Financials (Based on Availability)
- 16.2.2 Honeywell Inc
- 16.2.2.1. Overview
- 16.2.2.2. Products
- 16.2.2.3. SWOT Analysis
- 16.2.2.4. Recent Developments
- 16.2.2.5. Financials (Based on Availability)
- 16.2.3 Eaton Corp PLC
- 16.2.3.1. Overview
- 16.2.3.2. Products
- 16.2.3.3. SWOT Analysis
- 16.2.3.4. Recent Developments
- 16.2.3.5. Financials (Based on Availability)
- 16.2.4 Legrand SA
- 16.2.4.1. Overview
- 16.2.4.2. Products
- 16.2.4.3. SWOT Analysis
- 16.2.4.4. Recent Developments
- 16.2.4.5. Financials (Based on Availability)
- 16.2.5 General Electric Co
- 16.2.5.1. Overview
- 16.2.5.2. Products
- 16.2.5.3. SWOT Analysis
- 16.2.5.4. Recent Developments
- 16.2.5.5. Financials (Based on Availability)
- 16.2.6 Dwyer Instruments Inc
- 16.2.6.1. Overview
- 16.2.6.2. Products
- 16.2.6.3. SWOT Analysis
- 16.2.6.4. Recent Developments
- 16.2.6.5. Financials (Based on Availability)
- 16.2.7 Schneider Electric SE
- 16.2.7.1. Overview
- 16.2.7.2. Products
- 16.2.7.3. SWOT Analysis
- 16.2.7.4. Recent Developments
- 16.2.7.5. Financials (Based on Availability)
- 16.2.8 Johnson Controls Inc
- 16.2.8.1. Overview
- 16.2.8.2. Products
- 16.2.8.3. SWOT Analysis
- 16.2.8.4. Recent Developments
- 16.2.8.5. Financials (Based on Availability)
- 16.2.9 Analog Devices Inc
- 16.2.9.1. Overview
- 16.2.9.2. Products
- 16.2.9.3. SWOT Analysis
- 16.2.9.4. Recent Developments
- 16.2.9.5. Financials (Based on Availability)
- 16.2.10 Texas Instruments Inc*List Not Exhaustive
- 16.2.10.1. Overview
- 16.2.10.2. Products
- 16.2.10.3. SWOT Analysis
- 16.2.10.4. Recent Developments
- 16.2.10.5. Financials (Based on Availability)
- 16.2.1 Signify Holding BV
List of Figures
- Figure 1: Global US Occupancy Sensors Market Revenue Breakdown (Million, %) by Region 2024 & 2032
- Figure 2: United states US Occupancy Sensors Market Revenue (Million), by Country 2024 & 2032
- Figure 3: United states US Occupancy Sensors Market Revenue Share (%), by Country 2024 & 2032
- Figure 4: North America US Occupancy Sensors Market Revenue (Million), by Network Type 2024 & 2032
- Figure 5: North America US Occupancy Sensors Market Revenue Share (%), by Network Type 2024 & 2032
- Figure 6: North America US Occupancy Sensors Market Revenue (Million), by Technology 2024 & 2032
- Figure 7: North America US Occupancy Sensors Market Revenue Share (%), by Technology 2024 & 2032
- Figure 8: North America US Occupancy Sensors Market Revenue (Million), by Application 2024 & 2032
- Figure 9: North America US Occupancy Sensors Market Revenue Share (%), by Application 2024 & 2032
- Figure 10: North America US Occupancy Sensors Market Revenue (Million), by Building Type 2024 & 2032
- Figure 11: North America US Occupancy Sensors Market Revenue Share (%), by Building Type 2024 & 2032
- Figure 12: North America US Occupancy Sensors Market Revenue (Million), by Country 2024 & 2032
- Figure 13: North America US Occupancy Sensors Market Revenue Share (%), by Country 2024 & 2032
- Figure 14: South America US Occupancy Sensors Market Revenue (Million), by Network Type 2024 & 2032
- Figure 15: South America US Occupancy Sensors Market Revenue Share (%), by Network Type 2024 & 2032
- Figure 16: South America US Occupancy Sensors Market Revenue (Million), by Technology 2024 & 2032
- Figure 17: South America US Occupancy Sensors Market Revenue Share (%), by Technology 2024 & 2032
- Figure 18: South America US Occupancy Sensors Market Revenue (Million), by Application 2024 & 2032
- Figure 19: South America US Occupancy Sensors Market Revenue Share (%), by Application 2024 & 2032
- Figure 20: South America US Occupancy Sensors Market Revenue (Million), by Building Type 2024 & 2032
- Figure 21: South America US Occupancy Sensors Market Revenue Share (%), by Building Type 2024 & 2032
- Figure 22: South America US Occupancy Sensors Market Revenue (Million), by Country 2024 & 2032
- Figure 23: South America US Occupancy Sensors Market Revenue Share (%), by Country 2024 & 2032
- Figure 24: Europe US Occupancy Sensors Market Revenue (Million), by Network Type 2024 & 2032
- Figure 25: Europe US Occupancy Sensors Market Revenue Share (%), by Network Type 2024 & 2032
- Figure 26: Europe US Occupancy Sensors Market Revenue (Million), by Technology 2024 & 2032
- Figure 27: Europe US Occupancy Sensors Market Revenue Share (%), by Technology 2024 & 2032
- Figure 28: Europe US Occupancy Sensors Market Revenue (Million), by Application 2024 & 2032
- Figure 29: Europe US Occupancy Sensors Market Revenue Share (%), by Application 2024 & 2032
- Figure 30: Europe US Occupancy Sensors Market Revenue (Million), by Building Type 2024 & 2032
- Figure 31: Europe US Occupancy Sensors Market Revenue Share (%), by Building Type 2024 & 2032
- Figure 32: Europe US Occupancy Sensors Market Revenue (Million), by Country 2024 & 2032
- Figure 33: Europe US Occupancy Sensors Market Revenue Share (%), by Country 2024 & 2032
- Figure 34: Middle East & Africa US Occupancy Sensors Market Revenue (Million), by Network Type 2024 & 2032
- Figure 35: Middle East & Africa US Occupancy Sensors Market Revenue Share (%), by Network Type 2024 & 2032
- Figure 36: Middle East & Africa US Occupancy Sensors Market Revenue (Million), by Technology 2024 & 2032
- Figure 37: Middle East & Africa US Occupancy Sensors Market Revenue Share (%), by Technology 2024 & 2032
- Figure 38: Middle East & Africa US Occupancy Sensors Market Revenue (Million), by Application 2024 & 2032
- Figure 39: Middle East & Africa US Occupancy Sensors Market Revenue Share (%), by Application 2024 & 2032
- Figure 40: Middle East & Africa US Occupancy Sensors Market Revenue (Million), by Building Type 2024 & 2032
- Figure 41: Middle East & Africa US Occupancy Sensors Market Revenue Share (%), by Building Type 2024 & 2032
- Figure 42: Middle East & Africa US Occupancy Sensors Market Revenue (Million), by Country 2024 & 2032
- Figure 43: Middle East & Africa US Occupancy Sensors Market Revenue Share (%), by Country 2024 & 2032
- Figure 44: Asia Pacific US Occupancy Sensors Market Revenue (Million), by Network Type 2024 & 2032
- Figure 45: Asia Pacific US Occupancy Sensors Market Revenue Share (%), by Network Type 2024 & 2032
- Figure 46: Asia Pacific US Occupancy Sensors Market Revenue (Million), by Technology 2024 & 2032
- Figure 47: Asia Pacific US Occupancy Sensors Market Revenue Share (%), by Technology 2024 & 2032
- Figure 48: Asia Pacific US Occupancy Sensors Market Revenue (Million), by Application 2024 & 2032
- Figure 49: Asia Pacific US Occupancy Sensors Market Revenue Share (%), by Application 2024 & 2032
- Figure 50: Asia Pacific US Occupancy Sensors Market Revenue (Million), by Building Type 2024 & 2032
- Figure 51: Asia Pacific US Occupancy Sensors Market Revenue Share (%), by Building Type 2024 & 2032
- Figure 52: Asia Pacific US Occupancy Sensors Market Revenue (Million), by Country 2024 & 2032
- Figure 53: Asia Pacific US Occupancy Sensors Market Revenue Share (%), by Country 2024 & 2032
List of Tables
- Table 1: Global US Occupancy Sensors Market Revenue Million Forecast, by Region 2019 & 2032
- Table 2: Global US Occupancy Sensors Market Revenue Million Forecast, by Network Type 2019 & 2032
- Table 3: Global US Occupancy Sensors Market Revenue Million Forecast, by Technology 2019 & 2032
- Table 4: Global US Occupancy Sensors Market Revenue Million Forecast, by Application 2019 & 2032
- Table 5: Global US Occupancy Sensors Market Revenue Million Forecast, by Building Type 2019 & 2032
- Table 6: Global US Occupancy Sensors Market Revenue Million Forecast, by Region 2019 & 2032
- Table 7: Global US Occupancy Sensors Market Revenue Million Forecast, by Country 2019 & 2032
- Table 8: Northeast US Occupancy Sensors Market Revenue (Million) Forecast, by Application 2019 & 2032
- Table 9: Southeast US Occupancy Sensors Market Revenue (Million) Forecast, by Application 2019 & 2032
- Table 10: Midwest US Occupancy Sensors Market Revenue (Million) Forecast, by Application 2019 & 2032
- Table 11: Southwest US Occupancy Sensors Market Revenue (Million) Forecast, by Application 2019 & 2032
- Table 12: West US Occupancy Sensors Market Revenue (Million) Forecast, by Application 2019 & 2032
- Table 13: Global US Occupancy Sensors Market Revenue Million Forecast, by Network Type 2019 & 2032
- Table 14: Global US Occupancy Sensors Market Revenue Million Forecast, by Technology 2019 & 2032
- Table 15: Global US Occupancy Sensors Market Revenue Million Forecast, by Application 2019 & 2032
- Table 16: Global US Occupancy Sensors Market Revenue Million Forecast, by Building Type 2019 & 2032
- Table 17: Global US Occupancy Sensors Market Revenue Million Forecast, by Country 2019 & 2032
- Table 18: United States US Occupancy Sensors Market Revenue (Million) Forecast, by Application 2019 & 2032
- Table 19: Canada US Occupancy Sensors Market Revenue (Million) Forecast, by Application 2019 & 2032
- Table 20: Mexico US Occupancy Sensors Market Revenue (Million) Forecast, by Application 2019 & 2032
- Table 21: Global US Occupancy Sensors Market Revenue Million Forecast, by Network Type 2019 & 2032
- Table 22: Global US Occupancy Sensors Market Revenue Million Forecast, by Technology 2019 & 2032
- Table 23: Global US Occupancy Sensors Market Revenue Million Forecast, by Application 2019 & 2032
- Table 24: Global US Occupancy Sensors Market Revenue Million Forecast, by Building Type 2019 & 2032
- Table 25: Global US Occupancy Sensors Market Revenue Million Forecast, by Country 2019 & 2032
- Table 26: Brazil US Occupancy Sensors Market Revenue (Million) Forecast, by Application 2019 & 2032
- Table 27: Argentina US Occupancy Sensors Market Revenue (Million) Forecast, by Application 2019 & 2032
- Table 28: Rest of South America US Occupancy Sensors Market Revenue (Million) Forecast, by Application 2019 & 2032
- Table 29: Global US Occupancy Sensors Market Revenue Million Forecast, by Network Type 2019 & 2032
- Table 30: Global US Occupancy Sensors Market Revenue Million Forecast, by Technology 2019 & 2032
- Table 31: Global US Occupancy Sensors Market Revenue Million Forecast, by Application 2019 & 2032
- Table 32: Global US Occupancy Sensors Market Revenue Million Forecast, by Building Type 2019 & 2032
- Table 33: Global US Occupancy Sensors Market Revenue Million Forecast, by Country 2019 & 2032
- Table 34: United Kingdom US Occupancy Sensors Market Revenue (Million) Forecast, by Application 2019 & 2032
- Table 35: Germany US Occupancy Sensors Market Revenue (Million) Forecast, by Application 2019 & 2032
- Table 36: France US Occupancy Sensors Market Revenue (Million) Forecast, by Application 2019 & 2032
- Table 37: Italy US Occupancy Sensors Market Revenue (Million) Forecast, by Application 2019 & 2032
- Table 38: Spain US Occupancy Sensors Market Revenue (Million) Forecast, by Application 2019 & 2032
- Table 39: Russia US Occupancy Sensors Market Revenue (Million) Forecast, by Application 2019 & 2032
- Table 40: Benelux US Occupancy Sensors Market Revenue (Million) Forecast, by Application 2019 & 2032
- Table 41: Nordics US Occupancy Sensors Market Revenue (Million) Forecast, by Application 2019 & 2032
- Table 42: Rest of Europe US Occupancy Sensors Market Revenue (Million) Forecast, by Application 2019 & 2032
- Table 43: Global US Occupancy Sensors Market Revenue Million Forecast, by Network Type 2019 & 2032
- Table 44: Global US Occupancy Sensors Market Revenue Million Forecast, by Technology 2019 & 2032
- Table 45: Global US Occupancy Sensors Market Revenue Million Forecast, by Application 2019 & 2032
- Table 46: Global US Occupancy Sensors Market Revenue Million Forecast, by Building Type 2019 & 2032
- Table 47: Global US Occupancy Sensors Market Revenue Million Forecast, by Country 2019 & 2032
- Table 48: Turkey US Occupancy Sensors Market Revenue (Million) Forecast, by Application 2019 & 2032
- Table 49: Israel US Occupancy Sensors Market Revenue (Million) Forecast, by Application 2019 & 2032
- Table 50: GCC US Occupancy Sensors Market Revenue (Million) Forecast, by Application 2019 & 2032
- Table 51: North Africa US Occupancy Sensors Market Revenue (Million) Forecast, by Application 2019 & 2032
- Table 52: South Africa US Occupancy Sensors Market Revenue (Million) Forecast, by Application 2019 & 2032
- Table 53: Rest of Middle East & Africa US Occupancy Sensors Market Revenue (Million) Forecast, by Application 2019 & 2032
- Table 54: Global US Occupancy Sensors Market Revenue Million Forecast, by Network Type 2019 & 2032
- Table 55: Global US Occupancy Sensors Market Revenue Million Forecast, by Technology 2019 & 2032
- Table 56: Global US Occupancy Sensors Market Revenue Million Forecast, by Application 2019 & 2032
- Table 57: Global US Occupancy Sensors Market Revenue Million Forecast, by Building Type 2019 & 2032
- Table 58: Global US Occupancy Sensors Market Revenue Million Forecast, by Country 2019 & 2032
- Table 59: China US Occupancy Sensors Market Revenue (Million) Forecast, by Application 2019 & 2032
- Table 60: India US Occupancy Sensors Market Revenue (Million) Forecast, by Application 2019 & 2032
- Table 61: Japan US Occupancy Sensors Market Revenue (Million) Forecast, by Application 2019 & 2032
- Table 62: South Korea US Occupancy Sensors Market Revenue (Million) Forecast, by Application 2019 & 2032
- Table 63: ASEAN US Occupancy Sensors Market Revenue (Million) Forecast, by Application 2019 & 2032
- Table 64: Oceania US Occupancy Sensors Market Revenue (Million) Forecast, by Application 2019 & 2032
- Table 65: Rest of Asia Pacific US Occupancy Sensors Market Revenue (Million) Forecast, by Application 2019 & 2032
Frequently Asked Questions
1. What is the projected Compound Annual Growth Rate (CAGR) of the US Occupancy Sensors Market?
The projected CAGR is approximately 14.50%.
2. Which companies are prominent players in the US Occupancy Sensors Market?
Key companies in the market include Signify Holding BV, Honeywell Inc, Eaton Corp PLC, Legrand SA, General Electric Co, Dwyer Instruments Inc, Schneider Electric SE, Johnson Controls Inc, Analog Devices Inc, Texas Instruments Inc*List Not Exhaustive.
3. What are the main segments of the US Occupancy Sensors Market?
The market segments include Network Type, Technology, Application, Building Type.
4. Can you provide details about the market size?
The market size is estimated to be USD XX Million as of 2022.
5. What are some drivers contributing to market growth?
Rising Demand for Energy Efficient Devices; Demand for Passive Infrared Due to Low Cost and High Energy Efficiency.
6. What are the notable trends driving market growth?
Residential Expected to Witness Significant Growth.
7. Are there any restraints impacting market growth?
Cryptojacking Threats.
8. Can you provide examples of recent developments in the market?
March 2020 - Signify introduced new Philips IoT sensor packages that gather and deliver data via the Interact Office connected lighting system and environmental monitoring APIs. The sensor bundles can observe occupancy, the total of people in the room, temperature (at the room and desk level), noise levels, daylight levels, relative humidity, and are Bluetooth enabled, allowing for indoor positioning and navigation.
9. What pricing options are available for accessing the report?
Pricing options include single-user, multi-user, and enterprise licenses priced at USD 3800, USD 4500, and USD 5800 respectively.
10. Is the market size provided in terms of value or volume?
The market size is provided in terms of value, measured in Million.
11. Are there any specific market keywords associated with the report?
Yes, the market keyword associated with the report is "US Occupancy Sensors Market," which aids in identifying and referencing the specific market segment covered.
12. How do I determine which pricing option suits my needs best?
The pricing options vary based on user requirements and access needs. Individual users may opt for single-user licenses, while businesses requiring broader access may choose multi-user or enterprise licenses for cost-effective access to the report.
13. Are there any additional resources or data provided in the US Occupancy Sensors Market report?
While the report offers comprehensive insights, it's advisable to review the specific contents or supplementary materials provided to ascertain if additional resources or data are available.
14. How can I stay updated on further developments or reports in the US Occupancy Sensors Market?
To stay informed about further developments, trends, and reports in the US Occupancy Sensors Market, consider subscribing to industry newsletters, following relevant companies and organizations, or regularly checking reputable industry news sources and publications.
Methodology
Step 1 - Identification of Relevant Samples Size from Population Database


Step 2 - Approaches for Defining Global Market Size (Value, Volume* & Price*)

Note*: In applicable scenarios
Step 3 - Data Sources
Primary Research
- Web Analytics
- Survey Reports
- Research Institute
- Latest Research Reports
- Opinion Leaders
Secondary Research
- Annual Reports
- White Paper
- Latest Press Release
- Industry Association
- Paid Database
- Investor Presentations

Step 4 - Data Triangulation
Involves using different sources of information in order to increase the validity of a study
These sources are likely to be stakeholders in a program - participants, other researchers, program staff, other community members, and so on.
Then we put all data in single framework & apply various statistical tools to find out the dynamic on the market.
During the analysis stage, feedback from the stakeholder groups would be compared to determine areas of agreement as well as areas of divergence
