

Key Insights
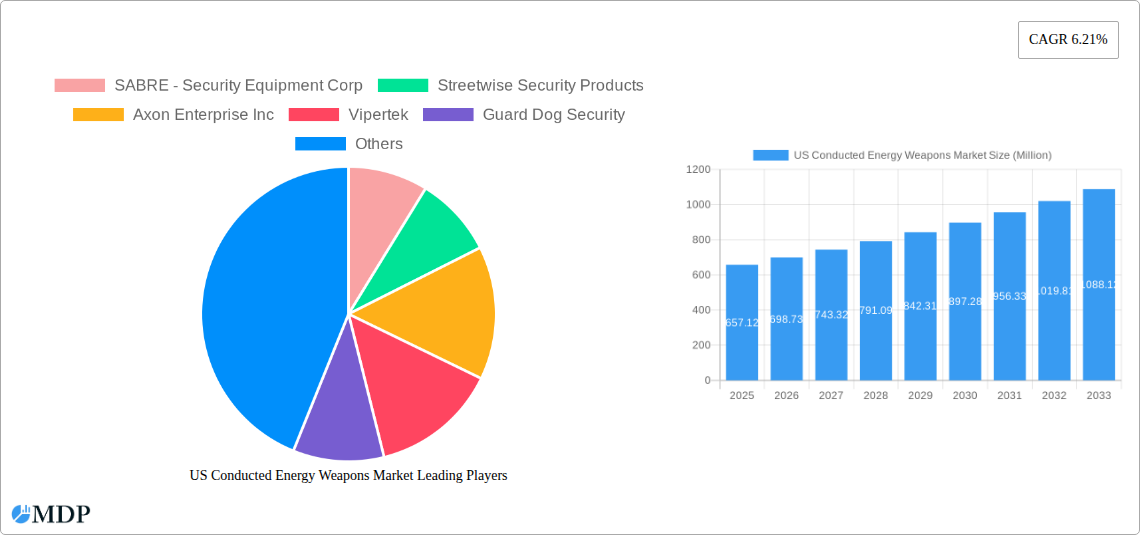
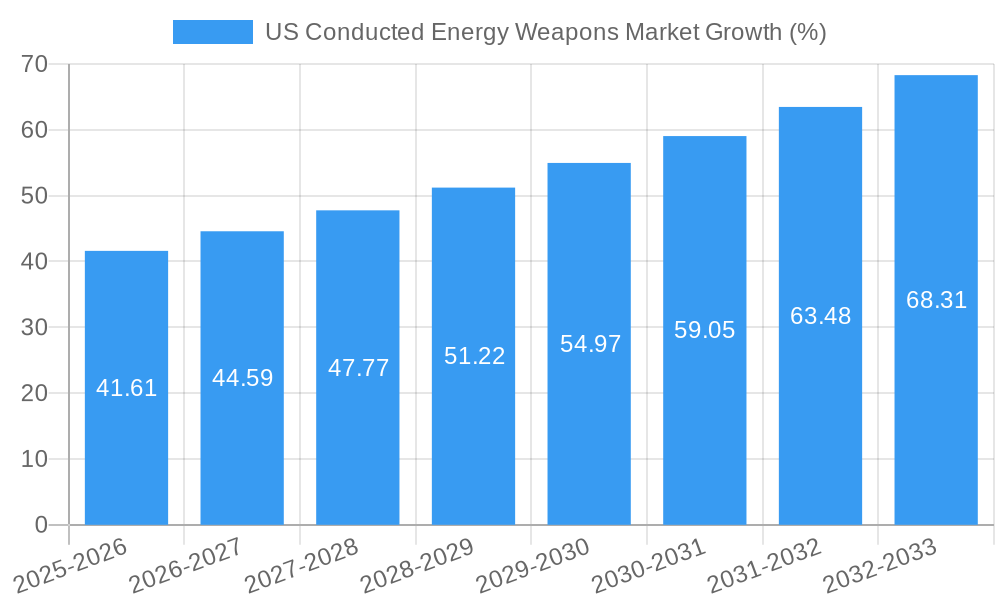
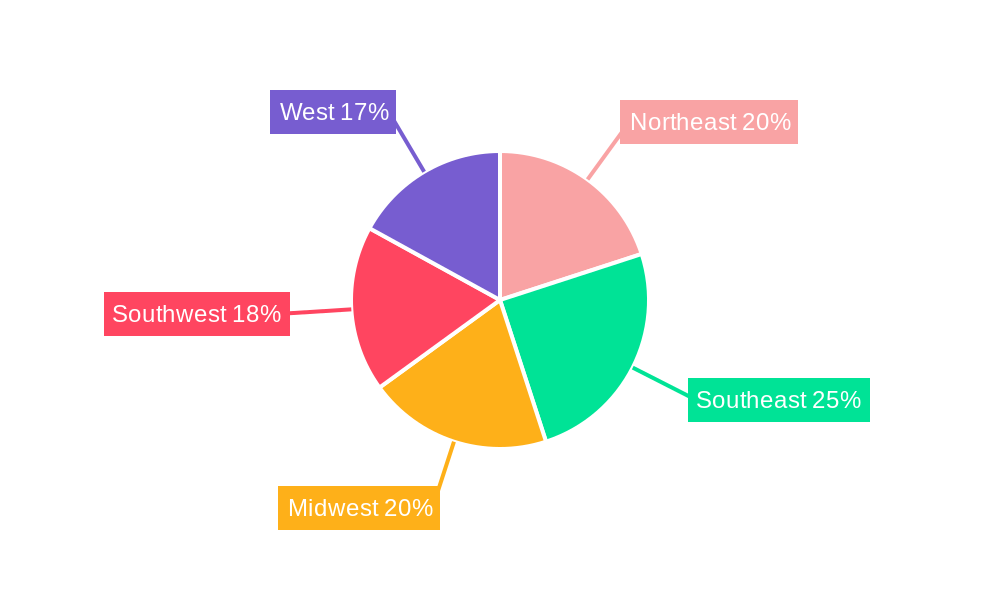
The US Conducted Energy Weapons (CEW) market, valued at $657.12 million in 2025, is projected to experience robust growth, driven by increasing demand from law enforcement agencies and a rising consumer preference for personal safety solutions. The market's Compound Annual Growth Rate (CAGR) of 6.21% from 2025 to 2033 indicates a significant expansion opportunity. Key drivers include escalating crime rates necessitating safer non-lethal alternatives for law enforcement, heightened public awareness of self-defense options, and technological advancements leading to more effective and user-friendly CEWs. Market segmentation reveals a strong demand for stun guns and tasers, with law enforcement agencies constituting the largest end-user segment. However, regulatory hurdles concerning the sale and use of CEWs, particularly for personal use, and concerns regarding potential misuse, pose significant restraints. The market's regional distribution likely sees the Northeast, Southeast, Midwest, Southwest and West regions of the US contributing proportionally to the overall market size, reflecting population density and varying levels of crime. Competitive landscape analysis reveals key players like SABRE, Axon Enterprise, and Vipertek are leading the innovation and distribution efforts within this expanding market.
Growth within the US CEW market is expected to be fueled by advancements in CEW technology resulting in greater effectiveness and portability, alongside targeted marketing campaigns emphasizing consumer safety and law enforcement training programs focusing on appropriate CEW deployment. Furthermore, increasing partnerships between manufacturers and distributors, combined with the adoption of more stringent safety standards, will likely shape the market's trajectory in the forecast period. While regional disparities in market penetration exist, nationwide growth is anticipated, driven by consistent public demand for personal safety products and effective policing tools that prioritize minimizing injury. However, ongoing debate surrounding potential misuse and associated liability will continue to pose challenges for market expansion. Maintaining a balance between consumer access and responsible application will be crucial for sustainable growth within this dynamic market.
US Conducted Energy Weapons Market: A Comprehensive Report (2019-2033)
This in-depth report provides a comprehensive analysis of the US Conducted Energy Weapons (CEW) market, offering valuable insights for stakeholders, investors, and industry professionals. Covering the period from 2019 to 2033, with a focus on 2025, this report meticulously examines market dynamics, trends, leading players, and future growth potential. The US CEW market is segmented by type (Stun Gun, Taser, Stun Baton), equipment type (Weapons, Cartridges), and end-user (Law Enforcement Agencies, Personal Use). Key players analyzed include SABRE - Security Equipment Corp, Streetwise Security Products, Axon Enterprise Inc, Vipertek, Guard Dog Security, PhaZZer LL, and Foxfend. The report projects robust growth, driven by technological advancements and increasing demand across various sectors.
US Conducted Energy Weapons Market Market Dynamics & Concentration
The US Conducted Energy Weapons market exhibits moderate concentration, with a few key players holding significant market share. Axon Enterprise Inc. currently dominates the market, followed by SABRE - Security Equipment Corp. and other established players. The market is characterized by continuous innovation, primarily focused on improving weapon effectiveness, safety features, and user-friendliness. Stringent regulatory frameworks governing the production, sale, and use of CEWs influence market dynamics. Product substitutes, such as pepper spray and other non-lethal weapons, exert competitive pressure. End-user trends favor enhanced safety and non-lethal options, while increasing demand from law enforcement agencies fuels market growth. Mergers and acquisitions (M&A) have played a significant role in shaping the market landscape, with xx M&A deals recorded between 2019 and 2024, resulting in increased market consolidation.
- Market Share: Axon Enterprise Inc. (xx%), SABRE - Security Equipment Corp. (xx%), Others (xx%)
- M&A Activity: xx deals from 2019-2024
US Conducted Energy Weapons Market Industry Trends & Analysis
The US Conducted Energy Weapons market is experiencing significant growth, projected at a CAGR of xx% during the forecast period (2025-2033). This growth is propelled by several factors. Rising crime rates and the increasing need for effective non-lethal law enforcement tools drive demand within the law enforcement segment. Simultaneously, growing awareness of personal safety among civilians is boosting sales in the personal use segment. Technological advancements, including improved battery life, enhanced accuracy, and advanced safety mechanisms, are also fueling market expansion. Consumer preference leans towards lightweight, easy-to-use devices with increased safety features. The market demonstrates intense competition, with companies constantly vying for market share through product innovation and strategic marketing. Market penetration in the personal use segment remains relatively low, presenting significant growth opportunities.
Leading Markets & Segments in US Conducted Energy Weapons Market
The dominant segment within the US CEW market is the Law Enforcement Agencies sector, accounting for approximately xx% of the total market value in 2025. This segment’s dominance is primarily due to increased adoption of CEWs as a safe and effective alternative to lethal force. Within the product types, Tasers hold the largest market share, exceeding xx Million in revenue in 2025, followed by stun guns and stun batons. Geographically, urban areas and states with higher crime rates exhibit higher market demand.
- Key Drivers for Law Enforcement Segment:
- Increasing crime rates
- Need for non-lethal alternatives
- Government initiatives and funding
- Key Drivers for Personal Use Segment:
- Growing awareness of personal safety
- Increased media coverage of self-defense
- Availability of user-friendly devices
US Conducted Energy Weapons Market Product Developments
Recent product developments focus on improving the ergonomics, safety features, and effectiveness of CEWs. Manufacturers are introducing smaller, lighter devices with enhanced battery life and improved targeting mechanisms. The integration of advanced technologies, such as smart features and data analytics, is also gaining traction. These developments aim to enhance the overall user experience and address safety concerns, thereby improving market fit and fostering wider acceptance.
Key Drivers of US Conducted Energy Weapons Market Growth
Several factors contribute to the growth of the US CEW market. Technological advancements, such as improved battery technology and enhanced targeting systems, are a primary driver. Increasing demand from law enforcement agencies, driven by the need for effective non-lethal tools, fuels market expansion. Furthermore, growing awareness of personal safety and self-defense among the civilian population contributes to the growth of the personal use segment. Government regulations and initiatives aimed at promoting the use of non-lethal weaponry also positively impact market growth.
Challenges in the US Conducted Energy Weapons Market Market
The US CEW market faces several challenges. Stringent regulations and safety concerns surrounding CEW usage impose significant barriers to market entry and expansion. Supply chain disruptions and fluctuations in raw material costs impact production and pricing. Intense competition among established players and the emergence of new entrants create competitive pressures. Negative publicity and concerns over potential misuse of CEWs also pose a challenge to market growth, potentially impacting consumer sentiment and government policies.
Emerging Opportunities in US Conducted Energy Weapons Market
The long-term growth of the US CEW market is underpinned by several opportunities. Technological breakthroughs, such as the development of more effective and safer devices, will drive innovation and attract new customers. Strategic partnerships between manufacturers and law enforcement agencies can unlock new market segments and accelerate adoption rates. Expanding market penetration into under-served regions and demographics presents significant potential. Furthermore, diversification into related markets, such as security and personal safety products, offers growth avenues for existing players.
Leading Players in the US Conducted Energy Weapons Market Sector
- SABRE - Security Equipment Corp
- Streetwise Security Products
- Axon Enterprise Inc
- Vipertek
- Guard Dog Security
- PhaZZer LL
- Foxfend
Key Milestones in US Conducted Energy Weapons Market Industry
- 2020: Axon Enterprise Inc. launches a new Taser model with improved safety features.
- 2021: SABRE - Security Equipment Corp. expands its distribution network to reach more retailers.
- 2022: Increased government funding for non-lethal law enforcement equipment.
- 2023: Several new entrants launch competitive CEW products.
- 2024: Regulatory changes impacting the sale and use of CEWs in certain states.
Strategic Outlook for US Conducted Energy Weapons Market Market
The future of the US CEW market appears bright, with substantial growth potential driven by ongoing technological innovation, increasing demand from both law enforcement and personal use segments, and favorable regulatory environments in many regions. Companies that can successfully navigate the regulatory landscape, effectively address safety concerns, and innovate to meet evolving consumer needs are poised to capture significant market share. Strategic partnerships, mergers and acquisitions, and expansion into international markets will also contribute to long-term growth and success within this dynamic sector. The market is expected to reach xx Million by 2033.
US Conducted Energy Weapons Market Segmentation
- 1. Production Analysis
- 2. Consumption Analysis
- 3. Import Market Analysis (Value & Volume)
- 4. Export Market Analysis (Value & Volume)
- 5. Price Trend Analysis
US Conducted Energy Weapons Market Segmentation By Geography
-
1. North America
- 1.1. United States
- 1.2. Canada
- 1.3. Mexico
-
2. South America
- 2.1. Brazil
- 2.2. Argentina
- 2.3. Rest of South America
-
3. Europe
- 3.1. United Kingdom
- 3.2. Germany
- 3.3. France
- 3.4. Italy
- 3.5. Spain
- 3.6. Russia
- 3.7. Benelux
- 3.8. Nordics
- 3.9. Rest of Europe
-
4. Middle East & Africa
- 4.1. Turkey
- 4.2. Israel
- 4.3. GCC
- 4.4. North Africa
- 4.5. South Africa
- 4.6. Rest of Middle East & Africa
-
5. Asia Pacific
- 5.1. China
- 5.2. India
- 5.3. Japan
- 5.4. South Korea
- 5.5. ASEAN
- 5.6. Oceania
- 5.7. Rest of Asia Pacific
US Conducted Energy Weapons Market REPORT HIGHLIGHTS
| Aspects | Details |
|---|---|
| Study Period | 2019-2033 |
| Base Year | 2024 |
| Estimated Year | 2025 |
| Forecast Period | 2025-2033 |
| Historical Period | 2019-2024 |
| Growth Rate | CAGR of 6.21% from 2019-2033 |
| Segmentation |
|
Table of Contents
- 1. Introduction
- 1.1. Research Scope
- 1.2. Market Segmentation
- 1.3. Research Methodology
- 1.4. Definitions and Assumptions
- 2. Executive Summary
- 2.1. Introduction
- 3. Market Dynamics
- 3.1. Introduction
- 3.2. Market Drivers
- 3.2.1. ; Increased Seaborne Threats And Ambiguous Maritime Security Policies; Increasing Adoption Of Security Technologies In Bric Countries
- 3.3. Market Restrains
- 3.3.1. ; High Risk Rate In Ungoverned Zones; Unstructured Security Standards And Technologies
- 3.4. Market Trends
- 3.4.1. Increasing Incidents of Civil Unrest Driving Procurement
- 4. Market Factor Analysis
- 4.1. Porters Five Forces
- 4.2. Supply/Value Chain
- 4.3. PESTEL analysis
- 4.4. Market Entropy
- 4.5. Patent/Trademark Analysis
- 5. Global US Conducted Energy Weapons Market Analysis, Insights and Forecast, 2019-2031
- 5.1. Market Analysis, Insights and Forecast - by Production Analysis
- 5.2. Market Analysis, Insights and Forecast - by Consumption Analysis
- 5.3. Market Analysis, Insights and Forecast - by Import Market Analysis (Value & Volume)
- 5.4. Market Analysis, Insights and Forecast - by Export Market Analysis (Value & Volume)
- 5.5. Market Analysis, Insights and Forecast - by Price Trend Analysis
- 5.6. Market Analysis, Insights and Forecast - by Region
- 5.6.1. North America
- 5.6.2. South America
- 5.6.3. Europe
- 5.6.4. Middle East & Africa
- 5.6.5. Asia Pacific
- 5.1. Market Analysis, Insights and Forecast - by Production Analysis
- 6. North America US Conducted Energy Weapons Market Analysis, Insights and Forecast, 2019-2031
- 6.1. Market Analysis, Insights and Forecast - by Production Analysis
- 6.2. Market Analysis, Insights and Forecast - by Consumption Analysis
- 6.3. Market Analysis, Insights and Forecast - by Import Market Analysis (Value & Volume)
- 6.4. Market Analysis, Insights and Forecast - by Export Market Analysis (Value & Volume)
- 6.5. Market Analysis, Insights and Forecast - by Price Trend Analysis
- 6.1. Market Analysis, Insights and Forecast - by Production Analysis
- 7. South America US Conducted Energy Weapons Market Analysis, Insights and Forecast, 2019-2031
- 7.1. Market Analysis, Insights and Forecast - by Production Analysis
- 7.2. Market Analysis, Insights and Forecast - by Consumption Analysis
- 7.3. Market Analysis, Insights and Forecast - by Import Market Analysis (Value & Volume)
- 7.4. Market Analysis, Insights and Forecast - by Export Market Analysis (Value & Volume)
- 7.5. Market Analysis, Insights and Forecast - by Price Trend Analysis
- 7.1. Market Analysis, Insights and Forecast - by Production Analysis
- 8. Europe US Conducted Energy Weapons Market Analysis, Insights and Forecast, 2019-2031
- 8.1. Market Analysis, Insights and Forecast - by Production Analysis
- 8.2. Market Analysis, Insights and Forecast - by Consumption Analysis
- 8.3. Market Analysis, Insights and Forecast - by Import Market Analysis (Value & Volume)
- 8.4. Market Analysis, Insights and Forecast - by Export Market Analysis (Value & Volume)
- 8.5. Market Analysis, Insights and Forecast - by Price Trend Analysis
- 8.1. Market Analysis, Insights and Forecast - by Production Analysis
- 9. Middle East & Africa US Conducted Energy Weapons Market Analysis, Insights and Forecast, 2019-2031
- 9.1. Market Analysis, Insights and Forecast - by Production Analysis
- 9.2. Market Analysis, Insights and Forecast - by Consumption Analysis
- 9.3. Market Analysis, Insights and Forecast - by Import Market Analysis (Value & Volume)
- 9.4. Market Analysis, Insights and Forecast - by Export Market Analysis (Value & Volume)
- 9.5. Market Analysis, Insights and Forecast - by Price Trend Analysis
- 9.1. Market Analysis, Insights and Forecast - by Production Analysis
- 10. Asia Pacific US Conducted Energy Weapons Market Analysis, Insights and Forecast, 2019-2031
- 10.1. Market Analysis, Insights and Forecast - by Production Analysis
- 10.2. Market Analysis, Insights and Forecast - by Consumption Analysis
- 10.3. Market Analysis, Insights and Forecast - by Import Market Analysis (Value & Volume)
- 10.4. Market Analysis, Insights and Forecast - by Export Market Analysis (Value & Volume)
- 10.5. Market Analysis, Insights and Forecast - by Price Trend Analysis
- 10.1. Market Analysis, Insights and Forecast - by Production Analysis
- 11. Northeast US Conducted Energy Weapons Market Analysis, Insights and Forecast, 2019-2031
- 12. Southeast US Conducted Energy Weapons Market Analysis, Insights and Forecast, 2019-2031
- 13. Midwest US Conducted Energy Weapons Market Analysis, Insights and Forecast, 2019-2031
- 14. Southwest US Conducted Energy Weapons Market Analysis, Insights and Forecast, 2019-2031
- 15. West US Conducted Energy Weapons Market Analysis, Insights and Forecast, 2019-2031
- 16. Competitive Analysis
- 16.1. Global Market Share Analysis 2024
- 16.2. Company Profiles
- 16.2.1 SABRE - Security Equipment Corp
- 16.2.1.1. Overview
- 16.2.1.2. Products
- 16.2.1.3. SWOT Analysis
- 16.2.1.4. Recent Developments
- 16.2.1.5. Financials (Based on Availability)
- 16.2.2 Streetwise Security Products
- 16.2.2.1. Overview
- 16.2.2.2. Products
- 16.2.2.3. SWOT Analysis
- 16.2.2.4. Recent Developments
- 16.2.2.5. Financials (Based on Availability)
- 16.2.3 Axon Enterprise Inc
- 16.2.3.1. Overview
- 16.2.3.2. Products
- 16.2.3.3. SWOT Analysis
- 16.2.3.4. Recent Developments
- 16.2.3.5. Financials (Based on Availability)
- 16.2.4 Vipertek
- 16.2.4.1. Overview
- 16.2.4.2. Products
- 16.2.4.3. SWOT Analysis
- 16.2.4.4. Recent Developments
- 16.2.4.5. Financials (Based on Availability)
- 16.2.5 Guard Dog Security
- 16.2.5.1. Overview
- 16.2.5.2. Products
- 16.2.5.3. SWOT Analysis
- 16.2.5.4. Recent Developments
- 16.2.5.5. Financials (Based on Availability)
- 16.2.6 PhaZZer LL
- 16.2.6.1. Overview
- 16.2.6.2. Products
- 16.2.6.3. SWOT Analysis
- 16.2.6.4. Recent Developments
- 16.2.6.5. Financials (Based on Availability)
- 16.2.7 Foxfend
- 16.2.7.1. Overview
- 16.2.7.2. Products
- 16.2.7.3. SWOT Analysis
- 16.2.7.4. Recent Developments
- 16.2.7.5. Financials (Based on Availability)
- 16.2.1 SABRE - Security Equipment Corp
List of Figures
- Figure 1: Global US Conducted Energy Weapons Market Revenue Breakdown (Million, %) by Region 2024 & 2032
- Figure 2: United states US Conducted Energy Weapons Market Revenue (Million), by Country 2024 & 2032
- Figure 3: United states US Conducted Energy Weapons Market Revenue Share (%), by Country 2024 & 2032
- Figure 4: North America US Conducted Energy Weapons Market Revenue (Million), by Production Analysis 2024 & 2032
- Figure 5: North America US Conducted Energy Weapons Market Revenue Share (%), by Production Analysis 2024 & 2032
- Figure 6: North America US Conducted Energy Weapons Market Revenue (Million), by Consumption Analysis 2024 & 2032
- Figure 7: North America US Conducted Energy Weapons Market Revenue Share (%), by Consumption Analysis 2024 & 2032
- Figure 8: North America US Conducted Energy Weapons Market Revenue (Million), by Import Market Analysis (Value & Volume) 2024 & 2032
- Figure 9: North America US Conducted Energy Weapons Market Revenue Share (%), by Import Market Analysis (Value & Volume) 2024 & 2032
- Figure 10: North America US Conducted Energy Weapons Market Revenue (Million), by Export Market Analysis (Value & Volume) 2024 & 2032
- Figure 11: North America US Conducted Energy Weapons Market Revenue Share (%), by Export Market Analysis (Value & Volume) 2024 & 2032
- Figure 12: North America US Conducted Energy Weapons Market Revenue (Million), by Price Trend Analysis 2024 & 2032
- Figure 13: North America US Conducted Energy Weapons Market Revenue Share (%), by Price Trend Analysis 2024 & 2032
- Figure 14: North America US Conducted Energy Weapons Market Revenue (Million), by Country 2024 & 2032
- Figure 15: North America US Conducted Energy Weapons Market Revenue Share (%), by Country 2024 & 2032
- Figure 16: South America US Conducted Energy Weapons Market Revenue (Million), by Production Analysis 2024 & 2032
- Figure 17: South America US Conducted Energy Weapons Market Revenue Share (%), by Production Analysis 2024 & 2032
- Figure 18: South America US Conducted Energy Weapons Market Revenue (Million), by Consumption Analysis 2024 & 2032
- Figure 19: South America US Conducted Energy Weapons Market Revenue Share (%), by Consumption Analysis 2024 & 2032
- Figure 20: South America US Conducted Energy Weapons Market Revenue (Million), by Import Market Analysis (Value & Volume) 2024 & 2032
- Figure 21: South America US Conducted Energy Weapons Market Revenue Share (%), by Import Market Analysis (Value & Volume) 2024 & 2032
- Figure 22: South America US Conducted Energy Weapons Market Revenue (Million), by Export Market Analysis (Value & Volume) 2024 & 2032
- Figure 23: South America US Conducted Energy Weapons Market Revenue Share (%), by Export Market Analysis (Value & Volume) 2024 & 2032
- Figure 24: South America US Conducted Energy Weapons Market Revenue (Million), by Price Trend Analysis 2024 & 2032
- Figure 25: South America US Conducted Energy Weapons Market Revenue Share (%), by Price Trend Analysis 2024 & 2032
- Figure 26: South America US Conducted Energy Weapons Market Revenue (Million), by Country 2024 & 2032
- Figure 27: South America US Conducted Energy Weapons Market Revenue Share (%), by Country 2024 & 2032
- Figure 28: Europe US Conducted Energy Weapons Market Revenue (Million), by Production Analysis 2024 & 2032
- Figure 29: Europe US Conducted Energy Weapons Market Revenue Share (%), by Production Analysis 2024 & 2032
- Figure 30: Europe US Conducted Energy Weapons Market Revenue (Million), by Consumption Analysis 2024 & 2032
- Figure 31: Europe US Conducted Energy Weapons Market Revenue Share (%), by Consumption Analysis 2024 & 2032
- Figure 32: Europe US Conducted Energy Weapons Market Revenue (Million), by Import Market Analysis (Value & Volume) 2024 & 2032
- Figure 33: Europe US Conducted Energy Weapons Market Revenue Share (%), by Import Market Analysis (Value & Volume) 2024 & 2032
- Figure 34: Europe US Conducted Energy Weapons Market Revenue (Million), by Export Market Analysis (Value & Volume) 2024 & 2032
- Figure 35: Europe US Conducted Energy Weapons Market Revenue Share (%), by Export Market Analysis (Value & Volume) 2024 & 2032
- Figure 36: Europe US Conducted Energy Weapons Market Revenue (Million), by Price Trend Analysis 2024 & 2032
- Figure 37: Europe US Conducted Energy Weapons Market Revenue Share (%), by Price Trend Analysis 2024 & 2032
- Figure 38: Europe US Conducted Energy Weapons Market Revenue (Million), by Country 2024 & 2032
- Figure 39: Europe US Conducted Energy Weapons Market Revenue Share (%), by Country 2024 & 2032
- Figure 40: Middle East & Africa US Conducted Energy Weapons Market Revenue (Million), by Production Analysis 2024 & 2032
- Figure 41: Middle East & Africa US Conducted Energy Weapons Market Revenue Share (%), by Production Analysis 2024 & 2032
- Figure 42: Middle East & Africa US Conducted Energy Weapons Market Revenue (Million), by Consumption Analysis 2024 & 2032
- Figure 43: Middle East & Africa US Conducted Energy Weapons Market Revenue Share (%), by Consumption Analysis 2024 & 2032
- Figure 44: Middle East & Africa US Conducted Energy Weapons Market Revenue (Million), by Import Market Analysis (Value & Volume) 2024 & 2032
- Figure 45: Middle East & Africa US Conducted Energy Weapons Market Revenue Share (%), by Import Market Analysis (Value & Volume) 2024 & 2032
- Figure 46: Middle East & Africa US Conducted Energy Weapons Market Revenue (Million), by Export Market Analysis (Value & Volume) 2024 & 2032
- Figure 47: Middle East & Africa US Conducted Energy Weapons Market Revenue Share (%), by Export Market Analysis (Value & Volume) 2024 & 2032
- Figure 48: Middle East & Africa US Conducted Energy Weapons Market Revenue (Million), by Price Trend Analysis 2024 & 2032
- Figure 49: Middle East & Africa US Conducted Energy Weapons Market Revenue Share (%), by Price Trend Analysis 2024 & 2032
- Figure 50: Middle East & Africa US Conducted Energy Weapons Market Revenue (Million), by Country 2024 & 2032
- Figure 51: Middle East & Africa US Conducted Energy Weapons Market Revenue Share (%), by Country 2024 & 2032
- Figure 52: Asia Pacific US Conducted Energy Weapons Market Revenue (Million), by Production Analysis 2024 & 2032
- Figure 53: Asia Pacific US Conducted Energy Weapons Market Revenue Share (%), by Production Analysis 2024 & 2032
- Figure 54: Asia Pacific US Conducted Energy Weapons Market Revenue (Million), by Consumption Analysis 2024 & 2032
- Figure 55: Asia Pacific US Conducted Energy Weapons Market Revenue Share (%), by Consumption Analysis 2024 & 2032
- Figure 56: Asia Pacific US Conducted Energy Weapons Market Revenue (Million), by Import Market Analysis (Value & Volume) 2024 & 2032
- Figure 57: Asia Pacific US Conducted Energy Weapons Market Revenue Share (%), by Import Market Analysis (Value & Volume) 2024 & 2032
- Figure 58: Asia Pacific US Conducted Energy Weapons Market Revenue (Million), by Export Market Analysis (Value & Volume) 2024 & 2032
- Figure 59: Asia Pacific US Conducted Energy Weapons Market Revenue Share (%), by Export Market Analysis (Value & Volume) 2024 & 2032
- Figure 60: Asia Pacific US Conducted Energy Weapons Market Revenue (Million), by Price Trend Analysis 2024 & 2032
- Figure 61: Asia Pacific US Conducted Energy Weapons Market Revenue Share (%), by Price Trend Analysis 2024 & 2032
- Figure 62: Asia Pacific US Conducted Energy Weapons Market Revenue (Million), by Country 2024 & 2032
- Figure 63: Asia Pacific US Conducted Energy Weapons Market Revenue Share (%), by Country 2024 & 2032
List of Tables
- Table 1: Global US Conducted Energy Weapons Market Revenue Million Forecast, by Region 2019 & 2032
- Table 2: Global US Conducted Energy Weapons Market Revenue Million Forecast, by Production Analysis 2019 & 2032
- Table 3: Global US Conducted Energy Weapons Market Revenue Million Forecast, by Consumption Analysis 2019 & 2032
- Table 4: Global US Conducted Energy Weapons Market Revenue Million Forecast, by Import Market Analysis (Value & Volume) 2019 & 2032
- Table 5: Global US Conducted Energy Weapons Market Revenue Million Forecast, by Export Market Analysis (Value & Volume) 2019 & 2032
- Table 6: Global US Conducted Energy Weapons Market Revenue Million Forecast, by Price Trend Analysis 2019 & 2032
- Table 7: Global US Conducted Energy Weapons Market Revenue Million Forecast, by Region 2019 & 2032
- Table 8: Global US Conducted Energy Weapons Market Revenue Million Forecast, by Country 2019 & 2032
- Table 9: Northeast US Conducted Energy Weapons Market Revenue (Million) Forecast, by Application 2019 & 2032
- Table 10: Southeast US Conducted Energy Weapons Market Revenue (Million) Forecast, by Application 2019 & 2032
- Table 11: Midwest US Conducted Energy Weapons Market Revenue (Million) Forecast, by Application 2019 & 2032
- Table 12: Southwest US Conducted Energy Weapons Market Revenue (Million) Forecast, by Application 2019 & 2032
- Table 13: West US Conducted Energy Weapons Market Revenue (Million) Forecast, by Application 2019 & 2032
- Table 14: Global US Conducted Energy Weapons Market Revenue Million Forecast, by Production Analysis 2019 & 2032
- Table 15: Global US Conducted Energy Weapons Market Revenue Million Forecast, by Consumption Analysis 2019 & 2032
- Table 16: Global US Conducted Energy Weapons Market Revenue Million Forecast, by Import Market Analysis (Value & Volume) 2019 & 2032
- Table 17: Global US Conducted Energy Weapons Market Revenue Million Forecast, by Export Market Analysis (Value & Volume) 2019 & 2032
- Table 18: Global US Conducted Energy Weapons Market Revenue Million Forecast, by Price Trend Analysis 2019 & 2032
- Table 19: Global US Conducted Energy Weapons Market Revenue Million Forecast, by Country 2019 & 2032
- Table 20: United States US Conducted Energy Weapons Market Revenue (Million) Forecast, by Application 2019 & 2032
- Table 21: Canada US Conducted Energy Weapons Market Revenue (Million) Forecast, by Application 2019 & 2032
- Table 22: Mexico US Conducted Energy Weapons Market Revenue (Million) Forecast, by Application 2019 & 2032
- Table 23: Global US Conducted Energy Weapons Market Revenue Million Forecast, by Production Analysis 2019 & 2032
- Table 24: Global US Conducted Energy Weapons Market Revenue Million Forecast, by Consumption Analysis 2019 & 2032
- Table 25: Global US Conducted Energy Weapons Market Revenue Million Forecast, by Import Market Analysis (Value & Volume) 2019 & 2032
- Table 26: Global US Conducted Energy Weapons Market Revenue Million Forecast, by Export Market Analysis (Value & Volume) 2019 & 2032
- Table 27: Global US Conducted Energy Weapons Market Revenue Million Forecast, by Price Trend Analysis 2019 & 2032
- Table 28: Global US Conducted Energy Weapons Market Revenue Million Forecast, by Country 2019 & 2032
- Table 29: Brazil US Conducted Energy Weapons Market Revenue (Million) Forecast, by Application 2019 & 2032
- Table 30: Argentina US Conducted Energy Weapons Market Revenue (Million) Forecast, by Application 2019 & 2032
- Table 31: Rest of South America US Conducted Energy Weapons Market Revenue (Million) Forecast, by Application 2019 & 2032
- Table 32: Global US Conducted Energy Weapons Market Revenue Million Forecast, by Production Analysis 2019 & 2032
- Table 33: Global US Conducted Energy Weapons Market Revenue Million Forecast, by Consumption Analysis 2019 & 2032
- Table 34: Global US Conducted Energy Weapons Market Revenue Million Forecast, by Import Market Analysis (Value & Volume) 2019 & 2032
- Table 35: Global US Conducted Energy Weapons Market Revenue Million Forecast, by Export Market Analysis (Value & Volume) 2019 & 2032
- Table 36: Global US Conducted Energy Weapons Market Revenue Million Forecast, by Price Trend Analysis 2019 & 2032
- Table 37: Global US Conducted Energy Weapons Market Revenue Million Forecast, by Country 2019 & 2032
- Table 38: United Kingdom US Conducted Energy Weapons Market Revenue (Million) Forecast, by Application 2019 & 2032
- Table 39: Germany US Conducted Energy Weapons Market Revenue (Million) Forecast, by Application 2019 & 2032
- Table 40: France US Conducted Energy Weapons Market Revenue (Million) Forecast, by Application 2019 & 2032
- Table 41: Italy US Conducted Energy Weapons Market Revenue (Million) Forecast, by Application 2019 & 2032
- Table 42: Spain US Conducted Energy Weapons Market Revenue (Million) Forecast, by Application 2019 & 2032
- Table 43: Russia US Conducted Energy Weapons Market Revenue (Million) Forecast, by Application 2019 & 2032
- Table 44: Benelux US Conducted Energy Weapons Market Revenue (Million) Forecast, by Application 2019 & 2032
- Table 45: Nordics US Conducted Energy Weapons Market Revenue (Million) Forecast, by Application 2019 & 2032
- Table 46: Rest of Europe US Conducted Energy Weapons Market Revenue (Million) Forecast, by Application 2019 & 2032
- Table 47: Global US Conducted Energy Weapons Market Revenue Million Forecast, by Production Analysis 2019 & 2032
- Table 48: Global US Conducted Energy Weapons Market Revenue Million Forecast, by Consumption Analysis 2019 & 2032
- Table 49: Global US Conducted Energy Weapons Market Revenue Million Forecast, by Import Market Analysis (Value & Volume) 2019 & 2032
- Table 50: Global US Conducted Energy Weapons Market Revenue Million Forecast, by Export Market Analysis (Value & Volume) 2019 & 2032
- Table 51: Global US Conducted Energy Weapons Market Revenue Million Forecast, by Price Trend Analysis 2019 & 2032
- Table 52: Global US Conducted Energy Weapons Market Revenue Million Forecast, by Country 2019 & 2032
- Table 53: Turkey US Conducted Energy Weapons Market Revenue (Million) Forecast, by Application 2019 & 2032
- Table 54: Israel US Conducted Energy Weapons Market Revenue (Million) Forecast, by Application 2019 & 2032
- Table 55: GCC US Conducted Energy Weapons Market Revenue (Million) Forecast, by Application 2019 & 2032
- Table 56: North Africa US Conducted Energy Weapons Market Revenue (Million) Forecast, by Application 2019 & 2032
- Table 57: South Africa US Conducted Energy Weapons Market Revenue (Million) Forecast, by Application 2019 & 2032
- Table 58: Rest of Middle East & Africa US Conducted Energy Weapons Market Revenue (Million) Forecast, by Application 2019 & 2032
- Table 59: Global US Conducted Energy Weapons Market Revenue Million Forecast, by Production Analysis 2019 & 2032
- Table 60: Global US Conducted Energy Weapons Market Revenue Million Forecast, by Consumption Analysis 2019 & 2032
- Table 61: Global US Conducted Energy Weapons Market Revenue Million Forecast, by Import Market Analysis (Value & Volume) 2019 & 2032
- Table 62: Global US Conducted Energy Weapons Market Revenue Million Forecast, by Export Market Analysis (Value & Volume) 2019 & 2032
- Table 63: Global US Conducted Energy Weapons Market Revenue Million Forecast, by Price Trend Analysis 2019 & 2032
- Table 64: Global US Conducted Energy Weapons Market Revenue Million Forecast, by Country 2019 & 2032
- Table 65: China US Conducted Energy Weapons Market Revenue (Million) Forecast, by Application 2019 & 2032
- Table 66: India US Conducted Energy Weapons Market Revenue (Million) Forecast, by Application 2019 & 2032
- Table 67: Japan US Conducted Energy Weapons Market Revenue (Million) Forecast, by Application 2019 & 2032
- Table 68: South Korea US Conducted Energy Weapons Market Revenue (Million) Forecast, by Application 2019 & 2032
- Table 69: ASEAN US Conducted Energy Weapons Market Revenue (Million) Forecast, by Application 2019 & 2032
- Table 70: Oceania US Conducted Energy Weapons Market Revenue (Million) Forecast, by Application 2019 & 2032
- Table 71: Rest of Asia Pacific US Conducted Energy Weapons Market Revenue (Million) Forecast, by Application 2019 & 2032
Frequently Asked Questions
1. What is the projected Compound Annual Growth Rate (CAGR) of the US Conducted Energy Weapons Market?
The projected CAGR is approximately 6.21%.
2. Which companies are prominent players in the US Conducted Energy Weapons Market?
Key companies in the market include SABRE - Security Equipment Corp, Streetwise Security Products, Axon Enterprise Inc, Vipertek, Guard Dog Security, PhaZZer LL, Foxfend.
3. What are the main segments of the US Conducted Energy Weapons Market?
The market segments include Production Analysis, Consumption Analysis, Import Market Analysis (Value & Volume), Export Market Analysis (Value & Volume), Price Trend Analysis.
4. Can you provide details about the market size?
The market size is estimated to be USD 657.12 Million as of 2022.
5. What are some drivers contributing to market growth?
; Increased Seaborne Threats And Ambiguous Maritime Security Policies; Increasing Adoption Of Security Technologies In Bric Countries.
6. What are the notable trends driving market growth?
Increasing Incidents of Civil Unrest Driving Procurement.
7. Are there any restraints impacting market growth?
; High Risk Rate In Ungoverned Zones; Unstructured Security Standards And Technologies.
8. Can you provide examples of recent developments in the market?
N/A
9. What pricing options are available for accessing the report?
Pricing options include single-user, multi-user, and enterprise licenses priced at USD 3800, USD 4500, and USD 5800 respectively.
10. Is the market size provided in terms of value or volume?
The market size is provided in terms of value, measured in Million.
11. Are there any specific market keywords associated with the report?
Yes, the market keyword associated with the report is "US Conducted Energy Weapons Market," which aids in identifying and referencing the specific market segment covered.
12. How do I determine which pricing option suits my needs best?
The pricing options vary based on user requirements and access needs. Individual users may opt for single-user licenses, while businesses requiring broader access may choose multi-user or enterprise licenses for cost-effective access to the report.
13. Are there any additional resources or data provided in the US Conducted Energy Weapons Market report?
While the report offers comprehensive insights, it's advisable to review the specific contents or supplementary materials provided to ascertain if additional resources or data are available.
14. How can I stay updated on further developments or reports in the US Conducted Energy Weapons Market?
To stay informed about further developments, trends, and reports in the US Conducted Energy Weapons Market, consider subscribing to industry newsletters, following relevant companies and organizations, or regularly checking reputable industry news sources and publications.
Methodology
Step 1 - Identification of Relevant Samples Size from Population Database


Step 2 - Approaches for Defining Global Market Size (Value, Volume* & Price*)

Note*: In applicable scenarios
Step 3 - Data Sources
Primary Research
- Web Analytics
- Survey Reports
- Research Institute
- Latest Research Reports
- Opinion Leaders
Secondary Research
- Annual Reports
- White Paper
- Latest Press Release
- Industry Association
- Paid Database
- Investor Presentations

Step 4 - Data Triangulation
Involves using different sources of information in order to increase the validity of a study
These sources are likely to be stakeholders in a program - participants, other researchers, program staff, other community members, and so on.
Then we put all data in single framework & apply various statistical tools to find out the dynamic on the market.
During the analysis stage, feedback from the stakeholder groups would be compared to determine areas of agreement as well as areas of divergence
