

Key Insights
The United States flexible office space market is experiencing robust growth, driven by the increasing demand for adaptable workspaces among diverse businesses and individual professionals. The market's expansion is fueled by several key factors. Firstly, the rise of remote work and hybrid work models necessitates flexible lease terms and scalable solutions that traditional office leases often lack. Secondly, smaller businesses and startups benefit from the cost-effectiveness and readily available amenities offered by shared office spaces, avoiding the significant upfront investment and ongoing management of a traditional office. Large corporations also utilize flexible office spaces for satellite offices, project-based teams, and to accommodate fluctuating workforce needs. Finally, the increasing prevalence of collaborative work environments and the desire for networking opportunities further enhances the appeal of shared office spaces.
This market segmentation, encompassing flexible managed offices, serviced offices, and catering to various industries (Information Technology, Legal Services, BFSI, Consulting), demonstrates a diversified demand. While the exact market size for the US in 2025 requires further data, a logical estimation based on a reported CAGR exceeding 11% and a global market size in the millions could place the US market size in the billions of dollars range. Growth will likely be concentrated in major metropolitan areas with high concentrations of businesses and skilled workers. However, restraints such as economic downturns, fluctuating real estate prices, and competition from traditional office spaces need consideration. The forecast period of 2025-2033 projects continued expansion, driven by evolving work styles and technological advancements that support remote and hybrid work environments. The competitive landscape, including established players like WeWork and Regus alongside emerging providers, promises continued innovation and refinement within the shared office space sector.
United States Office Space to Share Market: A Comprehensive Report (2019-2033)
This comprehensive report provides an in-depth analysis of the United States office space to share market, covering market dynamics, industry trends, leading players, and future growth prospects. The study period spans from 2019 to 2033, with 2025 serving as the base and estimated year. This report is essential for investors, industry stakeholders, and businesses seeking to understand and capitalize on this dynamic market.
United States Office Space to Share Market Market Dynamics & Concentration
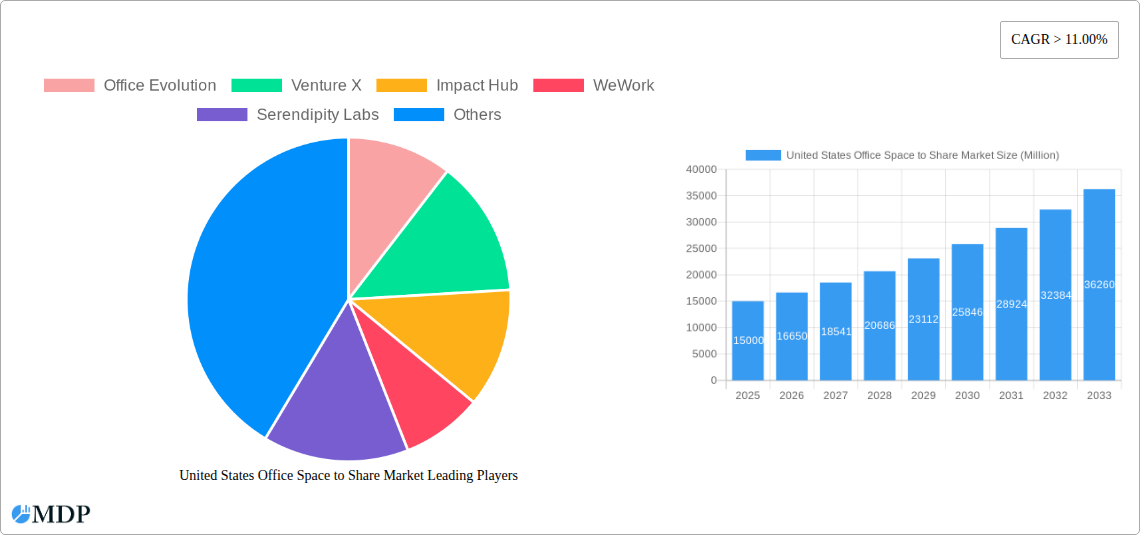
The US office space to share market exhibits a dynamic interplay of concentration, innovation, and regulatory influences. Market concentration is moderately high, with a few major players like WeWork and Regus holding significant market share, estimated at xx% and xx%, respectively, in 2025. However, numerous smaller, specialized providers like Office Evolution and Venture X are also actively competing, fostering innovation in space design and service offerings. The market is characterized by frequent mergers and acquisitions (M&A) activity, with an estimated xx M&A deals recorded between 2019 and 2024. These deals often involve larger companies acquiring smaller players to expand their geographic reach and service offerings.
Regulatory frameworks, particularly zoning laws and building codes, significantly impact market growth and location choices. Product substitutes, such as traditional leased offices and remote work setups, pose a continuous competitive challenge. End-user trends are shifting towards flexible work arrangements and a preference for collaborative workspaces, driving demand for shared office spaces.
- Market Share (2025 Estimate): WeWork: xx%, Regus: xx%, Others: xx%
- M&A Deal Count (2019-2024): xx
- Key Innovation Drivers: Flexible work arrangements, technological advancements (e.g., booking platforms, smart office technologies), focus on community building.
- Major Regulatory Influences: Zoning regulations, building codes, accessibility standards.
United States Office Space to Share Market Industry Trends & Analysis
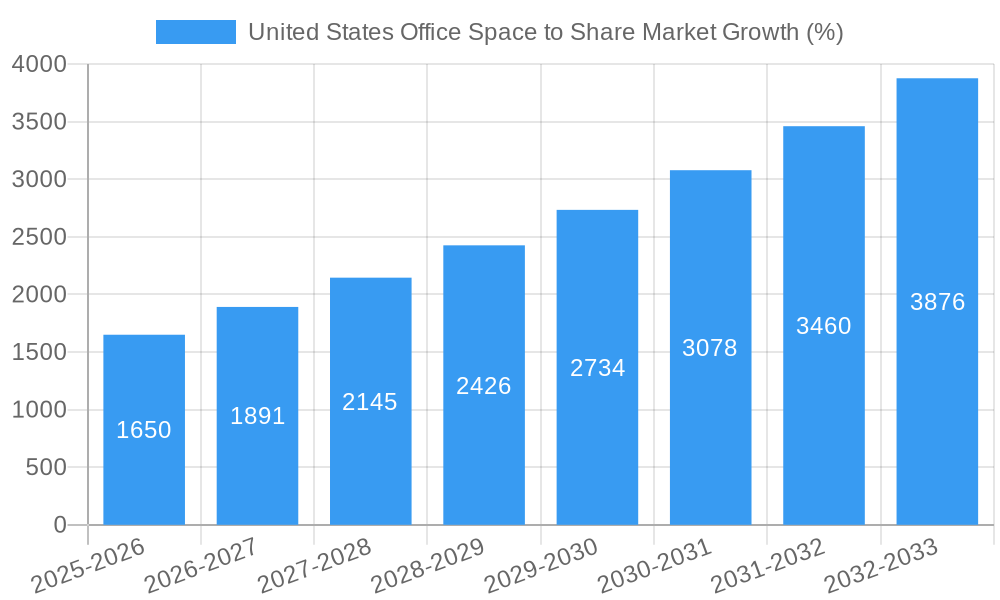
The US office space to share market demonstrates robust growth, driven by several factors. The increasing adoption of flexible work arrangements among both small-scale and large-scale companies fuels the demand for shared office spaces. The market's Compound Annual Growth Rate (CAGR) is projected to be xx% during the forecast period (2025-2033), with market penetration expected to reach xx% by 2033. Technological disruptions, such as the rise of booking platforms and smart office technologies, are streamlining operations and improving user experience. Consumer preferences are shifting towards amenity-rich spaces that offer networking opportunities and a sense of community. Competitive dynamics are intensifying, with players constantly striving to differentiate through innovative designs, premium services, and strategic partnerships.
Leading Markets & Segments in United States Office Space to Share Market
The leading segments within the US office space to share market are diverse. By end-user, small-scale companies and large-scale companies represent the most significant market share in 2025, due to their need for flexible workspace solutions and cost optimization. The flexible managed office type holds the largest market share by type, reflecting a preference for comprehensive service packages. By application, the Information Technology (IT and ITES) sector currently dominates, followed by the Consulting and BFSI sectors. This is likely due to the industry's need for agile workspaces and collaborative environments. Geographic dominance is concentrated in major metropolitan areas with robust economies and high concentrations of businesses.
- Key Drivers by Segment:
- Small-scale Companies: Cost-effectiveness, flexibility, networking opportunities.
- Large-scale Companies: Flexibility for expansion, talent acquisition, cost savings.
- Flexible Managed Offices: Comprehensive service packages, convenience.
- IT and ITES: Need for agile workspaces, collaborative environments.
- Dominant Regions: New York, California, Texas, Illinois, and other major metropolitan areas.
United States Office Space to Share Market Product Developments
Recent product innovations have focused on enhancing the user experience and expanding service offerings. This includes the integration of smart building technologies, improved booking systems, and the addition of amenities such as childcare facilities and fitness centers. The competitive advantage lies in offering a unique blend of functionality, design, and community-building opportunities tailored to the specific needs of different user segments. The integration of technology is key, allowing for better space management, optimized resource allocation, and enhanced customer service.
Key Drivers of United States Office Space to Share Market Growth
The growth of the US office space to share market is fueled by several key factors. The increasing popularity of flexible work arrangements, driven by evolving workforce demographics and a preference for work-life balance, is a major catalyst. Technological advancements, including sophisticated booking systems and smart office technology, are enhancing efficiency and attracting users. Favorable economic conditions and government policies supporting entrepreneurship also contribute to market growth.
Challenges in the United States Office Space to Share Market Market
Despite its growth potential, the US office space to share market faces challenges. The high initial investment costs for setting up shared office spaces can be a significant barrier for new entrants. Competition is intense, with established players and new entrants vying for market share. Fluctuations in the economy can impact demand, especially during periods of economic uncertainty.
Emerging Opportunities in United States Office Space to Share Market
The long-term growth of the US office space to share market is supported by several emerging opportunities. Technological advancements like AI-powered space optimization and virtual reality office tours are poised to enhance the user experience. Strategic partnerships between shared office providers and technology companies can unlock new avenues for growth. Expanding into secondary and tertiary markets offers considerable potential for expansion.
Leading Players in the United States Office Space to Share Market Sector
- Office Evolution
- Venture X
- Impact Hub
- WeWork
- Serendipity Labs
- Spaces
- Industrious Office
- Regus
- The Wing
- Knotel
Key Milestones in United States Office Space to Share Market Industry
- December 2021: WeWork's strategic partnership with Vertis leverages data science to optimize workplace solutions.
- January 2021: Venture X opens a new location in Denver, expanding its footprint and demonstrating franchise success.
Strategic Outlook for United States Office Space to Share Market Market
The future of the US office space to share market is bright. Continued technological advancements, strategic partnerships, and expansion into underserved markets will drive substantial growth. Companies that adapt to evolving user preferences and embrace innovation will be best positioned to succeed in this competitive landscape. The market's long-term potential is significant, driven by the increasing demand for flexible and collaborative workspaces.
United States Office Space to Share Market Segmentation
-
1. End User
- 1.1. Personal User
- 1.2. Small-scale Company
- 1.3. Large-scale Company
- 1.4. Other End Users
-
2. Type
- 2.1. Flexible Managed Office
- 2.2. Serviced Office
-
3. Application
- 3.1. Information Technology (IT and ITES)
- 3.2. Legal Services
- 3.3. BFSI (Banking, Financial Services, and Insurance)
- 3.4. Consulting
- 3.5. Other Services
United States Office Space to Share Market Segmentation By Geography
- 1. United States
United States Office Space to Share Market REPORT HIGHLIGHTS
| Aspects | Details |
|---|---|
| Study Period | 2019-2033 |
| Base Year | 2024 |
| Estimated Year | 2025 |
| Forecast Period | 2025-2033 |
| Historical Period | 2019-2024 |
| Growth Rate | CAGR of > 11.00% from 2019-2033 |
| Segmentation |
|
Table of Contents
- 1. Introduction
- 1.1. Research Scope
- 1.2. Market Segmentation
- 1.3. Research Methodology
- 1.4. Definitions and Assumptions
- 2. Executive Summary
- 2.1. Introduction
- 3. Market Dynamics
- 3.1. Introduction
- 3.2. Market Drivers
- 3.2.1. The Rise in e-commerce and digitalization
- 3.3. Market Restrains
- 3.3.1. The Complexity of regulations and property ownership
- 3.4. Market Trends
- 3.4.1. The Rise of the Startup Culture
- 4. Market Factor Analysis
- 4.1. Porters Five Forces
- 4.2. Supply/Value Chain
- 4.3. PESTEL analysis
- 4.4. Market Entropy
- 4.5. Patent/Trademark Analysis
- 5. United States Office Space to Share Market Analysis, Insights and Forecast, 2019-2031
- 5.1. Market Analysis, Insights and Forecast - by End User
- 5.1.1. Personal User
- 5.1.2. Small-scale Company
- 5.1.3. Large-scale Company
- 5.1.4. Other End Users
- 5.2. Market Analysis, Insights and Forecast - by Type
- 5.2.1. Flexible Managed Office
- 5.2.2. Serviced Office
- 5.3. Market Analysis, Insights and Forecast - by Application
- 5.3.1. Information Technology (IT and ITES)
- 5.3.2. Legal Services
- 5.3.3. BFSI (Banking, Financial Services, and Insurance)
- 5.3.4. Consulting
- 5.3.5. Other Services
- 5.4. Market Analysis, Insights and Forecast - by Region
- 5.4.1. United States
- 5.1. Market Analysis, Insights and Forecast - by End User
- 6. United States United States Office Space to Share Market Analysis, Insights and Forecast, 2019-2031
- 6.1. Market Analysis, Insights and Forecast - By Country/Sub-region
- 6.1.1.
- 7. Canada United States Office Space to Share Market Analysis, Insights and Forecast, 2019-2031
- 7.1. Market Analysis, Insights and Forecast - By Country/Sub-region
- 7.1.1.
- 8. Mexico United States Office Space to Share Market Analysis, Insights and Forecast, 2019-2031
- 8.1. Market Analysis, Insights and Forecast - By Country/Sub-region
- 8.1.1.
- 9. Rest of North America United States Office Space to Share Market Analysis, Insights and Forecast, 2019-2031
- 9.1. Market Analysis, Insights and Forecast - By Country/Sub-region
- 9.1.1.
- 10. Competitive Analysis
- 10.1. Market Share Analysis 2024
- 10.2. Company Profiles
- 10.2.1 Office Evolution
- 10.2.1.1. Overview
- 10.2.1.2. Products
- 10.2.1.3. SWOT Analysis
- 10.2.1.4. Recent Developments
- 10.2.1.5. Financials (Based on Availability)
- 10.2.2 Venture X
- 10.2.2.1. Overview
- 10.2.2.2. Products
- 10.2.2.3. SWOT Analysis
- 10.2.2.4. Recent Developments
- 10.2.2.5. Financials (Based on Availability)
- 10.2.3 Impact Hub
- 10.2.3.1. Overview
- 10.2.3.2. Products
- 10.2.3.3. SWOT Analysis
- 10.2.3.4. Recent Developments
- 10.2.3.5. Financials (Based on Availability)
- 10.2.4 WeWork
- 10.2.4.1. Overview
- 10.2.4.2. Products
- 10.2.4.3. SWOT Analysis
- 10.2.4.4. Recent Developments
- 10.2.4.5. Financials (Based on Availability)
- 10.2.5 Serendipity Labs
- 10.2.5.1. Overview
- 10.2.5.2. Products
- 10.2.5.3. SWOT Analysis
- 10.2.5.4. Recent Developments
- 10.2.5.5. Financials (Based on Availability)
- 10.2.6 Spaces
- 10.2.6.1. Overview
- 10.2.6.2. Products
- 10.2.6.3. SWOT Analysis
- 10.2.6.4. Recent Developments
- 10.2.6.5. Financials (Based on Availability)
- 10.2.7 Industrious Office
- 10.2.7.1. Overview
- 10.2.7.2. Products
- 10.2.7.3. SWOT Analysis
- 10.2.7.4. Recent Developments
- 10.2.7.5. Financials (Based on Availability)
- 10.2.8 Regus
- 10.2.8.1. Overview
- 10.2.8.2. Products
- 10.2.8.3. SWOT Analysis
- 10.2.8.4. Recent Developments
- 10.2.8.5. Financials (Based on Availability)
- 10.2.9 The Wing**List Not Exhaustive
- 10.2.9.1. Overview
- 10.2.9.2. Products
- 10.2.9.3. SWOT Analysis
- 10.2.9.4. Recent Developments
- 10.2.9.5. Financials (Based on Availability)
- 10.2.10 Knotel
- 10.2.10.1. Overview
- 10.2.10.2. Products
- 10.2.10.3. SWOT Analysis
- 10.2.10.4. Recent Developments
- 10.2.10.5. Financials (Based on Availability)
- 10.2.1 Office Evolution
List of Figures
- Figure 1: United States Office Space to Share Market Revenue Breakdown (Million, %) by Product 2024 & 2032
- Figure 2: United States Office Space to Share Market Share (%) by Company 2024
List of Tables
- Table 1: United States Office Space to Share Market Revenue Million Forecast, by Region 2019 & 2032
- Table 2: United States Office Space to Share Market Revenue Million Forecast, by End User 2019 & 2032
- Table 3: United States Office Space to Share Market Revenue Million Forecast, by Type 2019 & 2032
- Table 4: United States Office Space to Share Market Revenue Million Forecast, by Application 2019 & 2032
- Table 5: United States Office Space to Share Market Revenue Million Forecast, by Region 2019 & 2032
- Table 6: United States Office Space to Share Market Revenue Million Forecast, by Country 2019 & 2032
- Table 7: United States Office Space to Share Market Revenue (Million) Forecast, by Application 2019 & 2032
- Table 8: United States Office Space to Share Market Revenue Million Forecast, by Country 2019 & 2032
- Table 9: United States Office Space to Share Market Revenue (Million) Forecast, by Application 2019 & 2032
- Table 10: United States Office Space to Share Market Revenue Million Forecast, by Country 2019 & 2032
- Table 11: United States Office Space to Share Market Revenue (Million) Forecast, by Application 2019 & 2032
- Table 12: United States Office Space to Share Market Revenue Million Forecast, by Country 2019 & 2032
- Table 13: United States Office Space to Share Market Revenue (Million) Forecast, by Application 2019 & 2032
- Table 14: United States Office Space to Share Market Revenue Million Forecast, by End User 2019 & 2032
- Table 15: United States Office Space to Share Market Revenue Million Forecast, by Type 2019 & 2032
- Table 16: United States Office Space to Share Market Revenue Million Forecast, by Application 2019 & 2032
- Table 17: United States Office Space to Share Market Revenue Million Forecast, by Country 2019 & 2032
Frequently Asked Questions
1. What is the projected Compound Annual Growth Rate (CAGR) of the United States Office Space to Share Market?
The projected CAGR is approximately > 11.00%.
2. Which companies are prominent players in the United States Office Space to Share Market?
Key companies in the market include Office Evolution, Venture X, Impact Hub, WeWork, Serendipity Labs, Spaces, Industrious Office, Regus, The Wing**List Not Exhaustive, Knotel.
3. What are the main segments of the United States Office Space to Share Market?
The market segments include End User, Type, Application.
4. Can you provide details about the market size?
The market size is estimated to be USD XX Million as of 2022.
5. What are some drivers contributing to market growth?
The Rise in e-commerce and digitalization.
6. What are the notable trends driving market growth?
The Rise of the Startup Culture.
7. Are there any restraints impacting market growth?
The Complexity of regulations and property ownership.
8. Can you provide examples of recent developments in the market?
In December 2021, WeWork (a commercial real estate company) announced a strategic partnership with Vertis (data science talent and location platform). This partnership aims to use data to help members overcome some of the most difficult workplace-related challenges, such as determining where specific talent pools are growing in target markets and the impact of employee commute times on productivity.
9. What pricing options are available for accessing the report?
Pricing options include single-user, multi-user, and enterprise licenses priced at USD 3800, USD 4500, and USD 5800 respectively.
10. Is the market size provided in terms of value or volume?
The market size is provided in terms of value, measured in Million.
11. Are there any specific market keywords associated with the report?
Yes, the market keyword associated with the report is "United States Office Space to Share Market," which aids in identifying and referencing the specific market segment covered.
12. How do I determine which pricing option suits my needs best?
The pricing options vary based on user requirements and access needs. Individual users may opt for single-user licenses, while businesses requiring broader access may choose multi-user or enterprise licenses for cost-effective access to the report.
13. Are there any additional resources or data provided in the United States Office Space to Share Market report?
While the report offers comprehensive insights, it's advisable to review the specific contents or supplementary materials provided to ascertain if additional resources or data are available.
14. How can I stay updated on further developments or reports in the United States Office Space to Share Market?
To stay informed about further developments, trends, and reports in the United States Office Space to Share Market, consider subscribing to industry newsletters, following relevant companies and organizations, or regularly checking reputable industry news sources and publications.
Methodology
Step 1 - Identification of Relevant Samples Size from Population Database


Step 2 - Approaches for Defining Global Market Size (Value, Volume* & Price*)

Note*: In applicable scenarios
Step 3 - Data Sources
Primary Research
- Web Analytics
- Survey Reports
- Research Institute
- Latest Research Reports
- Opinion Leaders
Secondary Research
- Annual Reports
- White Paper
- Latest Press Release
- Industry Association
- Paid Database
- Investor Presentations

Step 4 - Data Triangulation
Involves using different sources of information in order to increase the validity of a study
These sources are likely to be stakeholders in a program - participants, other researchers, program staff, other community members, and so on.
Then we put all data in single framework & apply various statistical tools to find out the dynamic on the market.
During the analysis stage, feedback from the stakeholder groups would be compared to determine areas of agreement as well as areas of divergence
