

Key Insights
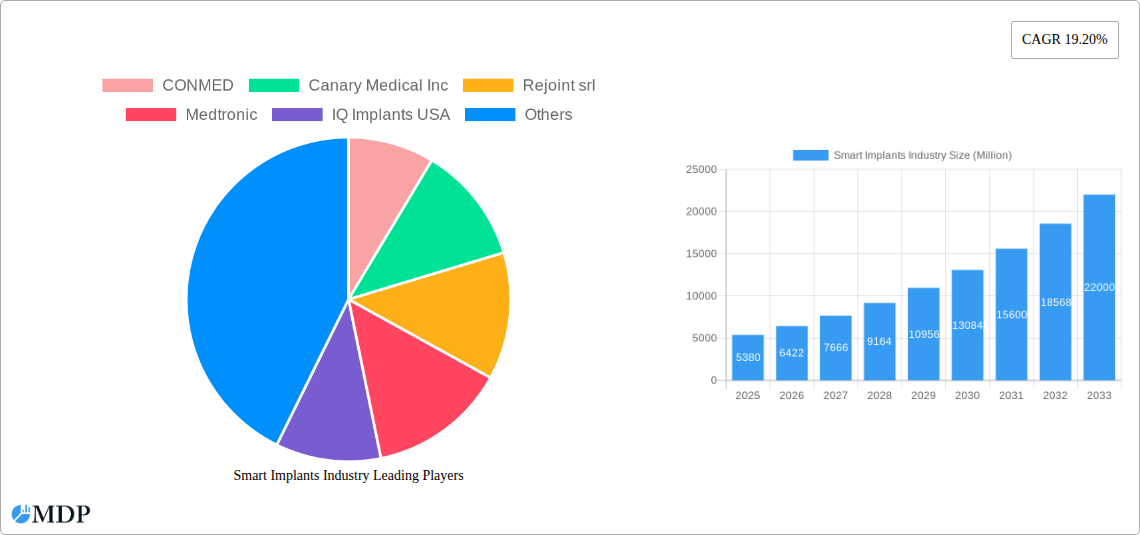
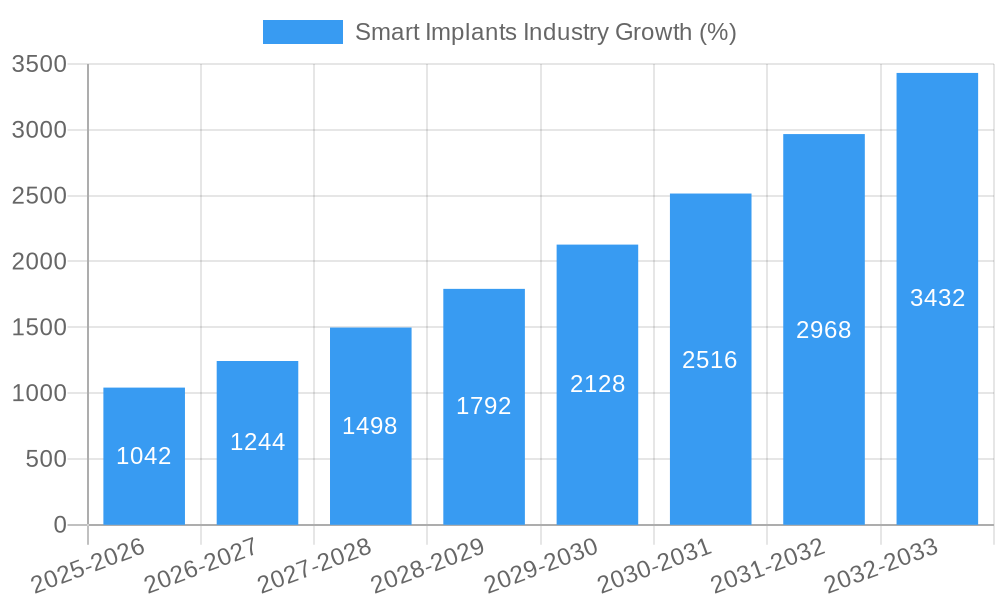
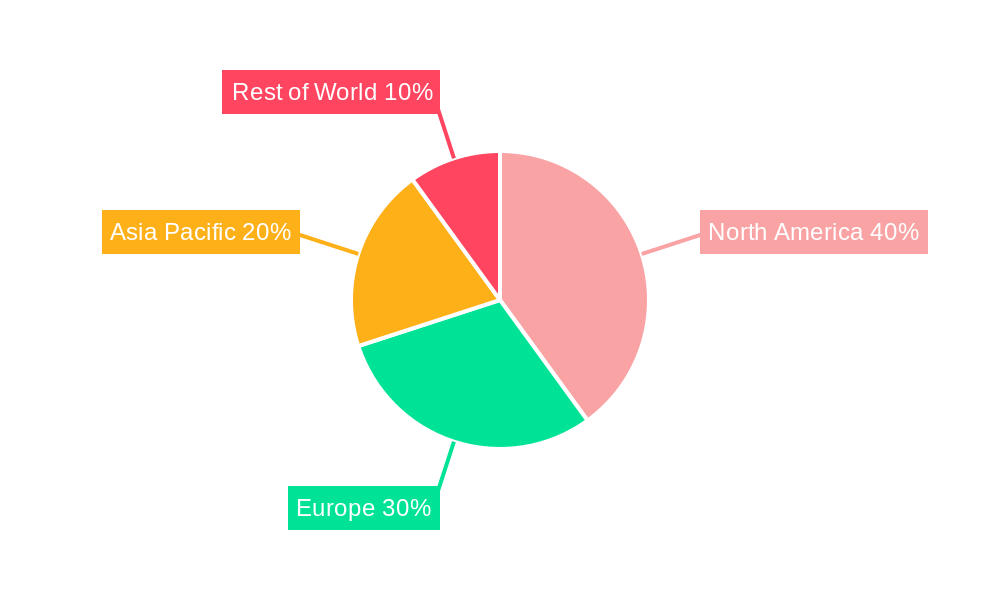
The global smart implants market is experiencing robust growth, projected to reach \$5.38 billion in 2025 and maintain a Compound Annual Growth Rate (CAGR) of 19.20% from 2025 to 2033. This expansion is driven by several key factors. Technological advancements in miniaturization, sensor technology, and wireless communication are enabling the development of increasingly sophisticated smart implants with enhanced functionalities. The rising prevalence of chronic diseases, such as cardiovascular conditions and orthopedic injuries, fuels demand for minimally invasive procedures and improved patient outcomes, which smart implants effectively address. Furthermore, increasing healthcare expenditure globally, coupled with a growing elderly population requiring more sophisticated medical interventions, further bolsters market growth. The integration of data analytics and artificial intelligence (AI) within the smart implant ecosystem enhances remote patient monitoring capabilities and allows for personalized treatment strategies, further driving adoption. The market is segmented by product type (orthopedic, cardiovascular, ophthalmic, dental, cosmetic, etc.) and end-user (hospitals, ambulatory surgical centers, clinics, etc.), providing diverse growth opportunities across various segments. North America and Europe currently hold significant market shares, driven by advanced healthcare infrastructure and high adoption rates. However, Asia-Pacific is expected to witness substantial growth in the coming years due to increasing disposable incomes, improving healthcare systems, and a large patient pool.
The competitive landscape is characterized by the presence of both established medical device giants like Medtronic, Johnson & Johnson (DePuy Synthes), and Zimmer Biomet, and smaller, specialized companies focusing on innovation within specific implant types. Ongoing research and development efforts are focused on improving biocompatibility, reducing the risk of complications, and extending the lifespan of smart implants. Regulatory approvals and reimbursement policies remain crucial factors influencing market dynamics. While challenges exist, such as high initial costs and potential cybersecurity concerns associated with connected medical devices, the overall market outlook for smart implants remains exceptionally positive, driven by a confluence of technological advancements, demographic shifts, and increasing healthcare needs.
Smart Implants Industry Market Report: 2019-2033 Forecast
This comprehensive report provides an in-depth analysis of the global Smart Implants market, projecting a market value of $XX Million by 2033. It offers actionable insights for stakeholders across the value chain, covering market dynamics, leading players, technological advancements, and future growth opportunities. The report leverages data from the historical period (2019-2024), base year (2025), and estimated year (2025) to forecast market trends until 2033. Key segments analyzed include Orthopedics, Cardiovascular, Ophthalmic, Dental, and Cosmetic Smart Implants, across various end-user markets. This report is essential for strategic decision-making and investment planning in this rapidly evolving sector.
Smart Implants Industry Market Dynamics & Concentration
The global smart implants market exhibits a moderately concentrated landscape, with key players like Medtronic, Johnson & Johnson (DePuy Synthes), Zimmer Biomet, and Stryker holding significant market share. The market share of these top 4 players is estimated at approximately 60% in 2025. Innovation is a primary driver, fueled by advancements in materials science, miniaturization, and wireless communication technologies. Stringent regulatory frameworks, particularly in regions like the US and Europe, significantly influence market entry and product approvals. The market faces competition from traditional implants, but smart implants offer superior functionalities and outcomes, driving substitution. End-user trends show a clear preference for minimally invasive procedures and personalized medicine, boosting demand for smart implants. M&A activity has been moderate in recent years, with approximately 15-20 deals recorded annually, reflecting consolidation and strategic expansion efforts.
- Market Concentration: Top 4 players hold ~60% market share (2025).
- Innovation Drivers: Advancements in materials, miniaturization, wireless technology.
- Regulatory Landscape: Stringent approvals in US and EU.
- Product Substitutes: Competition from traditional implants.
- End-User Trends: Preference for minimally invasive procedures and personalized medicine.
- M&A Activity: ~15-20 deals annually (2019-2024).
Smart Implants Industry Industry Trends & Analysis
The smart implants market is experiencing robust growth, driven by several key factors. Technological advancements, particularly in sensor technology, data analytics, and AI, are enabling the development of increasingly sophisticated implants with enhanced functionalities. The rising prevalence of chronic diseases, an aging global population, and increased healthcare expenditure are creating significant demand. Consumer preferences are shifting towards improved patient outcomes, reduced recovery times, and enhanced quality of life, aligning perfectly with the benefits offered by smart implants. The competitive landscape is dynamic, with both established players and new entrants vying for market share through product innovation and strategic partnerships. The CAGR for the forecast period (2025-2033) is estimated at xx%, indicating strong market expansion. Market penetration is currently estimated at xx% and is expected to reach xx% by 2033.
Leading Markets & Segments in Smart Implants Industry
The North American region currently dominates the smart implants market, driven by factors such as high healthcare expenditure, advanced medical infrastructure, and a substantial elderly population. Within product types, Orthopedics Smart Implants hold the largest market share, followed by Cardiovascular Smart Implants. Among end-users, Hospitals constitute the largest segment, due to their comprehensive infrastructure and surgical capabilities.
- Dominant Region: North America (High healthcare expenditure, advanced infrastructure)
- Leading Product Type: Orthopedics Smart Implants (High prevalence of orthopedic conditions)
- Largest End-User Segment: Hospitals (Comprehensive infrastructure and surgical capabilities)
- Key Drivers (North America): Robust healthcare infrastructure, high R&D investment, favorable regulatory environment.
- Key Drivers (Europe): Growing geriatric population, increasing prevalence of chronic diseases, rising healthcare expenditure.
- Key Drivers (Asia Pacific): Rapid economic growth, rising healthcare awareness, increasing disposable incomes.
Smart Implants Industry Product Developments
Recent product innovations in smart implants emphasize miniaturization, improved biocompatibility, enhanced data transmission capabilities, and integration with advanced diagnostic tools. These advancements are enhancing the therapeutic efficacy of implants, improving patient outcomes, and expanding the range of clinical applications. The market is witnessing the emergence of implants with sophisticated sensors that monitor vital signs in real-time, facilitating remote patient monitoring and personalized treatment. This trend is leading to more effective and efficient healthcare delivery.
Key Drivers of Smart Implants Industry Growth
Technological advancements such as the development of smaller, more powerful sensors, improved wireless communication capabilities, and advanced data analytics are propelling the growth of the smart implants market. The increasing prevalence of chronic diseases and the growing geriatric population are creating significant demand. Furthermore, favorable regulatory policies and increasing healthcare expenditure are contributing to market expansion.
Challenges in the Smart Implants Industry Market
High initial costs associated with implant development, regulatory hurdles and stringent approval processes, potential cybersecurity risks related to data transmission, and the complexities associated with implant integration with existing healthcare infrastructure pose significant challenges to the growth of the smart implants market. Supply chain disruptions can also impact the availability and cost of these advanced medical devices, potentially hindering market expansion.
Emerging Opportunities in Smart Implants Industry
The integration of Artificial Intelligence (AI) and machine learning in smart implants offers significant opportunities for enhanced diagnostics and personalized therapies. Strategic partnerships between medical device manufacturers, technology companies, and healthcare providers are driving innovation and market expansion. The development of biocompatible and biodegradable materials will expand the range of clinical applications and reduce the risk of adverse effects. Expansion into emerging markets will further propel the growth of this sector.
Leading Players in the Smart Implants Industry Sector
- CONMED
- Canary Medical Inc
- Rejoint srl
- Medtronic
- IQ Implants USA
- Stryker
- Johnson & Johnson (DePuy Synthes)
- Zimmer Biomet
- NuVasive Inc
- Smart Implant Solutions
Key Milestones in Smart Implants Industry Industry
- 2020: FDA approval of a new smart implant for spinal fusion.
- 2022: Launch of a next-generation smart knee implant with advanced sensor technology.
- 2023: Merger between two leading smart implant companies, leading to increased market share.
- 2024: Introduction of an AI-powered diagnostic tool for smart implants.
Strategic Outlook for Smart Implants Industry Market
The future of the smart implants market is bright, driven by continuous technological advancements, increasing healthcare expenditure, and a growing elderly population globally. Strategic partnerships and collaborations will play a crucial role in accelerating innovation and expanding market reach. The focus on personalized medicine and remote patient monitoring will further enhance the adoption of smart implants. The market is poised for significant growth in the coming years, offering attractive investment opportunities for industry stakeholders.
Smart Implants Industry Segmentation
-
1. Product Type
-
1.1. Orthopedics Smart Implants
- 1.1.1. Knee Arthroplasty
- 1.1.2. Hip Arthroplasty
- 1.1.3. Spine Fusion
- 1.1.4. Fracture Fixation
- 1.1.5. Others
-
1.2. Cardiovascular Smart Implants
- 1.2.1. Pacing devices
- 1.2.2. Stents
- 1.2.3. Structural Cardiac Implants
-
1.3. Opthalmic Smart Implants
- 1.3.1. Intraocular lens
- 1.3.2. Glaucoma Implants
- 1.4. Dental Smart Implants
- 1.5. Cosmetic smart Implants
-
1.1. Orthopedics Smart Implants
-
2. End User
- 2.1. Hospitals
- 2.2. Ambulatory Surgical Centers
- 2.3. Orthopedics Clinics
- 2.4. Opthalmic Clinics
- 2.5. Dental Labs
- 2.6. Others
Smart Implants Industry Segmentation By Geography
-
1. North America
- 1.1. United States
- 1.2. Canada
- 1.3. Mexico
-
2. Europe
- 2.1. Germany
- 2.2. United Kingdom
- 2.3. France
- 2.4. Italy
- 2.5. Spain
- 2.6. Rest of Europe
-
3. Asia Pacific
- 3.1. China
- 3.2. Japan
- 3.3. India
- 3.4. Australia
- 3.5. South Korea
- 3.6. Rest of Asia Pacific
-
4. Middle East and Africa
- 4.1. GCC
- 4.2. South Africa
- 4.3. Rest of Middle East and Africa
-
5. South America
- 5.1. Brazil
- 5.2. Argentina
- 5.3. Rest of South America
Smart Implants Industry REPORT HIGHLIGHTS
| Aspects | Details |
|---|---|
| Study Period | 2019-2033 |
| Base Year | 2024 |
| Estimated Year | 2025 |
| Forecast Period | 2025-2033 |
| Historical Period | 2019-2024 |
| Growth Rate | CAGR of 19.20% from 2019-2033 |
| Segmentation |
|
Table of Contents
- 1. Introduction
- 1.1. Research Scope
- 1.2. Market Segmentation
- 1.3. Research Methodology
- 1.4. Definitions and Assumptions
- 2. Executive Summary
- 2.1. Introduction
- 3. Market Dynamics
- 3.1. Introduction
- 3.2. Market Drivers
- 3.2.1. Increase in the Geriatric Population with Various Chronic Disorder; Rising Incidence of Accidents and Sport Injuries; Technological Advancements in the Field of Smart Implants
- 3.3. Market Restrains
- 3.3.1. Stringent Regulatory Framework
- 3.4. Market Trends
- 3.4.1. Orthopedic Smart Implants Segment is Expected to Witness high Growth Over the Forecast Period
- 4. Market Factor Analysis
- 4.1. Porters Five Forces
- 4.2. Supply/Value Chain
- 4.3. PESTEL analysis
- 4.4. Market Entropy
- 4.5. Patent/Trademark Analysis
- 5. Global Smart Implants Industry Analysis, Insights and Forecast, 2019-2031
- 5.1. Market Analysis, Insights and Forecast - by Product Type
- 5.1.1. Orthopedics Smart Implants
- 5.1.1.1. Knee Arthroplasty
- 5.1.1.2. Hip Arthroplasty
- 5.1.1.3. Spine Fusion
- 5.1.1.4. Fracture Fixation
- 5.1.1.5. Others
- 5.1.2. Cardiovascular Smart Implants
- 5.1.2.1. Pacing devices
- 5.1.2.2. Stents
- 5.1.2.3. Structural Cardiac Implants
- 5.1.3. Opthalmic Smart Implants
- 5.1.3.1. Intraocular lens
- 5.1.3.2. Glaucoma Implants
- 5.1.4. Dental Smart Implants
- 5.1.5. Cosmetic smart Implants
- 5.1.1. Orthopedics Smart Implants
- 5.2. Market Analysis, Insights and Forecast - by End User
- 5.2.1. Hospitals
- 5.2.2. Ambulatory Surgical Centers
- 5.2.3. Orthopedics Clinics
- 5.2.4. Opthalmic Clinics
- 5.2.5. Dental Labs
- 5.2.6. Others
- 5.3. Market Analysis, Insights and Forecast - by Region
- 5.3.1. North America
- 5.3.2. Europe
- 5.3.3. Asia Pacific
- 5.3.4. Middle East and Africa
- 5.3.5. South America
- 5.1. Market Analysis, Insights and Forecast - by Product Type
- 6. North America Smart Implants Industry Analysis, Insights and Forecast, 2019-2031
- 6.1. Market Analysis, Insights and Forecast - by Product Type
- 6.1.1. Orthopedics Smart Implants
- 6.1.1.1. Knee Arthroplasty
- 6.1.1.2. Hip Arthroplasty
- 6.1.1.3. Spine Fusion
- 6.1.1.4. Fracture Fixation
- 6.1.1.5. Others
- 6.1.2. Cardiovascular Smart Implants
- 6.1.2.1. Pacing devices
- 6.1.2.2. Stents
- 6.1.2.3. Structural Cardiac Implants
- 6.1.3. Opthalmic Smart Implants
- 6.1.3.1. Intraocular lens
- 6.1.3.2. Glaucoma Implants
- 6.1.4. Dental Smart Implants
- 6.1.5. Cosmetic smart Implants
- 6.1.1. Orthopedics Smart Implants
- 6.2. Market Analysis, Insights and Forecast - by End User
- 6.2.1. Hospitals
- 6.2.2. Ambulatory Surgical Centers
- 6.2.3. Orthopedics Clinics
- 6.2.4. Opthalmic Clinics
- 6.2.5. Dental Labs
- 6.2.6. Others
- 6.1. Market Analysis, Insights and Forecast - by Product Type
- 7. Europe Smart Implants Industry Analysis, Insights and Forecast, 2019-2031
- 7.1. Market Analysis, Insights and Forecast - by Product Type
- 7.1.1. Orthopedics Smart Implants
- 7.1.1.1. Knee Arthroplasty
- 7.1.1.2. Hip Arthroplasty
- 7.1.1.3. Spine Fusion
- 7.1.1.4. Fracture Fixation
- 7.1.1.5. Others
- 7.1.2. Cardiovascular Smart Implants
- 7.1.2.1. Pacing devices
- 7.1.2.2. Stents
- 7.1.2.3. Structural Cardiac Implants
- 7.1.3. Opthalmic Smart Implants
- 7.1.3.1. Intraocular lens
- 7.1.3.2. Glaucoma Implants
- 7.1.4. Dental Smart Implants
- 7.1.5. Cosmetic smart Implants
- 7.1.1. Orthopedics Smart Implants
- 7.2. Market Analysis, Insights and Forecast - by End User
- 7.2.1. Hospitals
- 7.2.2. Ambulatory Surgical Centers
- 7.2.3. Orthopedics Clinics
- 7.2.4. Opthalmic Clinics
- 7.2.5. Dental Labs
- 7.2.6. Others
- 7.1. Market Analysis, Insights and Forecast - by Product Type
- 8. Asia Pacific Smart Implants Industry Analysis, Insights and Forecast, 2019-2031
- 8.1. Market Analysis, Insights and Forecast - by Product Type
- 8.1.1. Orthopedics Smart Implants
- 8.1.1.1. Knee Arthroplasty
- 8.1.1.2. Hip Arthroplasty
- 8.1.1.3. Spine Fusion
- 8.1.1.4. Fracture Fixation
- 8.1.1.5. Others
- 8.1.2. Cardiovascular Smart Implants
- 8.1.2.1. Pacing devices
- 8.1.2.2. Stents
- 8.1.2.3. Structural Cardiac Implants
- 8.1.3. Opthalmic Smart Implants
- 8.1.3.1. Intraocular lens
- 8.1.3.2. Glaucoma Implants
- 8.1.4. Dental Smart Implants
- 8.1.5. Cosmetic smart Implants
- 8.1.1. Orthopedics Smart Implants
- 8.2. Market Analysis, Insights and Forecast - by End User
- 8.2.1. Hospitals
- 8.2.2. Ambulatory Surgical Centers
- 8.2.3. Orthopedics Clinics
- 8.2.4. Opthalmic Clinics
- 8.2.5. Dental Labs
- 8.2.6. Others
- 8.1. Market Analysis, Insights and Forecast - by Product Type
- 9. Middle East and Africa Smart Implants Industry Analysis, Insights and Forecast, 2019-2031
- 9.1. Market Analysis, Insights and Forecast - by Product Type
- 9.1.1. Orthopedics Smart Implants
- 9.1.1.1. Knee Arthroplasty
- 9.1.1.2. Hip Arthroplasty
- 9.1.1.3. Spine Fusion
- 9.1.1.4. Fracture Fixation
- 9.1.1.5. Others
- 9.1.2. Cardiovascular Smart Implants
- 9.1.2.1. Pacing devices
- 9.1.2.2. Stents
- 9.1.2.3. Structural Cardiac Implants
- 9.1.3. Opthalmic Smart Implants
- 9.1.3.1. Intraocular lens
- 9.1.3.2. Glaucoma Implants
- 9.1.4. Dental Smart Implants
- 9.1.5. Cosmetic smart Implants
- 9.1.1. Orthopedics Smart Implants
- 9.2. Market Analysis, Insights and Forecast - by End User
- 9.2.1. Hospitals
- 9.2.2. Ambulatory Surgical Centers
- 9.2.3. Orthopedics Clinics
- 9.2.4. Opthalmic Clinics
- 9.2.5. Dental Labs
- 9.2.6. Others
- 9.1. Market Analysis, Insights and Forecast - by Product Type
- 10. South America Smart Implants Industry Analysis, Insights and Forecast, 2019-2031
- 10.1. Market Analysis, Insights and Forecast - by Product Type
- 10.1.1. Orthopedics Smart Implants
- 10.1.1.1. Knee Arthroplasty
- 10.1.1.2. Hip Arthroplasty
- 10.1.1.3. Spine Fusion
- 10.1.1.4. Fracture Fixation
- 10.1.1.5. Others
- 10.1.2. Cardiovascular Smart Implants
- 10.1.2.1. Pacing devices
- 10.1.2.2. Stents
- 10.1.2.3. Structural Cardiac Implants
- 10.1.3. Opthalmic Smart Implants
- 10.1.3.1. Intraocular lens
- 10.1.3.2. Glaucoma Implants
- 10.1.4. Dental Smart Implants
- 10.1.5. Cosmetic smart Implants
- 10.1.1. Orthopedics Smart Implants
- 10.2. Market Analysis, Insights and Forecast - by End User
- 10.2.1. Hospitals
- 10.2.2. Ambulatory Surgical Centers
- 10.2.3. Orthopedics Clinics
- 10.2.4. Opthalmic Clinics
- 10.2.5. Dental Labs
- 10.2.6. Others
- 10.1. Market Analysis, Insights and Forecast - by Product Type
- 11. North America Smart Implants Industry Analysis, Insights and Forecast, 2019-2031
- 11.1. Market Analysis, Insights and Forecast - By Country/Sub-region
- 11.1.1 United States
- 11.1.2 Canada
- 11.1.3 Mexico
- 12. Europe Smart Implants Industry Analysis, Insights and Forecast, 2019-2031
- 12.1. Market Analysis, Insights and Forecast - By Country/Sub-region
- 12.1.1 Germany
- 12.1.2 United Kingdom
- 12.1.3 France
- 12.1.4 Italy
- 12.1.5 Spain
- 12.1.6 Rest of Europe
- 13. Asia Pacific Smart Implants Industry Analysis, Insights and Forecast, 2019-2031
- 13.1. Market Analysis, Insights and Forecast - By Country/Sub-region
- 13.1.1 China
- 13.1.2 Japan
- 13.1.3 India
- 13.1.4 Australia
- 13.1.5 South Korea
- 13.1.6 Rest of Asia Pacific
- 14. Middle East and Africa Smart Implants Industry Analysis, Insights and Forecast, 2019-2031
- 14.1. Market Analysis, Insights and Forecast - By Country/Sub-region
- 14.1.1 GCC
- 14.1.2 South Africa
- 14.1.3 Rest of Middle East and Africa
- 15. South America Smart Implants Industry Analysis, Insights and Forecast, 2019-2031
- 15.1. Market Analysis, Insights and Forecast - By Country/Sub-region
- 15.1.1 Brazil
- 15.1.2 Argentina
- 15.1.3 Rest of South America
- 16. Competitive Analysis
- 16.1. Global Market Share Analysis 2024
- 16.2. Company Profiles
- 16.2.1 CONMED
- 16.2.1.1. Overview
- 16.2.1.2. Products
- 16.2.1.3. SWOT Analysis
- 16.2.1.4. Recent Developments
- 16.2.1.5. Financials (Based on Availability)
- 16.2.2 Canary Medical Inc
- 16.2.2.1. Overview
- 16.2.2.2. Products
- 16.2.2.3. SWOT Analysis
- 16.2.2.4. Recent Developments
- 16.2.2.5. Financials (Based on Availability)
- 16.2.3 Rejoint srl
- 16.2.3.1. Overview
- 16.2.3.2. Products
- 16.2.3.3. SWOT Analysis
- 16.2.3.4. Recent Developments
- 16.2.3.5. Financials (Based on Availability)
- 16.2.4 Medtronic
- 16.2.4.1. Overview
- 16.2.4.2. Products
- 16.2.4.3. SWOT Analysis
- 16.2.4.4. Recent Developments
- 16.2.4.5. Financials (Based on Availability)
- 16.2.5 IQ Implants USA
- 16.2.5.1. Overview
- 16.2.5.2. Products
- 16.2.5.3. SWOT Analysis
- 16.2.5.4. Recent Developments
- 16.2.5.5. Financials (Based on Availability)
- 16.2.6 Stryker
- 16.2.6.1. Overview
- 16.2.6.2. Products
- 16.2.6.3. SWOT Analysis
- 16.2.6.4. Recent Developments
- 16.2.6.5. Financials (Based on Availability)
- 16.2.7 Johnson & Johnson (DePuy Synthes)
- 16.2.7.1. Overview
- 16.2.7.2. Products
- 16.2.7.3. SWOT Analysis
- 16.2.7.4. Recent Developments
- 16.2.7.5. Financials (Based on Availability)
- 16.2.8 Zimmer Biomet
- 16.2.8.1. Overview
- 16.2.8.2. Products
- 16.2.8.3. SWOT Analysis
- 16.2.8.4. Recent Developments
- 16.2.8.5. Financials (Based on Availability)
- 16.2.9 NuVasive Inc
- 16.2.9.1. Overview
- 16.2.9.2. Products
- 16.2.9.3. SWOT Analysis
- 16.2.9.4. Recent Developments
- 16.2.9.5. Financials (Based on Availability)
- 16.2.10 Smart Implant Solutions
- 16.2.10.1. Overview
- 16.2.10.2. Products
- 16.2.10.3. SWOT Analysis
- 16.2.10.4. Recent Developments
- 16.2.10.5. Financials (Based on Availability)
- 16.2.1 CONMED
List of Figures
- Figure 1: Global Smart Implants Industry Revenue Breakdown (Million, %) by Region 2024 & 2032
- Figure 2: North America Smart Implants Industry Revenue (Million), by Country 2024 & 2032
- Figure 3: North America Smart Implants Industry Revenue Share (%), by Country 2024 & 2032
- Figure 4: Europe Smart Implants Industry Revenue (Million), by Country 2024 & 2032
- Figure 5: Europe Smart Implants Industry Revenue Share (%), by Country 2024 & 2032
- Figure 6: Asia Pacific Smart Implants Industry Revenue (Million), by Country 2024 & 2032
- Figure 7: Asia Pacific Smart Implants Industry Revenue Share (%), by Country 2024 & 2032
- Figure 8: Middle East and Africa Smart Implants Industry Revenue (Million), by Country 2024 & 2032
- Figure 9: Middle East and Africa Smart Implants Industry Revenue Share (%), by Country 2024 & 2032
- Figure 10: South America Smart Implants Industry Revenue (Million), by Country 2024 & 2032
- Figure 11: South America Smart Implants Industry Revenue Share (%), by Country 2024 & 2032
- Figure 12: North America Smart Implants Industry Revenue (Million), by Product Type 2024 & 2032
- Figure 13: North America Smart Implants Industry Revenue Share (%), by Product Type 2024 & 2032
- Figure 14: North America Smart Implants Industry Revenue (Million), by End User 2024 & 2032
- Figure 15: North America Smart Implants Industry Revenue Share (%), by End User 2024 & 2032
- Figure 16: North America Smart Implants Industry Revenue (Million), by Country 2024 & 2032
- Figure 17: North America Smart Implants Industry Revenue Share (%), by Country 2024 & 2032
- Figure 18: Europe Smart Implants Industry Revenue (Million), by Product Type 2024 & 2032
- Figure 19: Europe Smart Implants Industry Revenue Share (%), by Product Type 2024 & 2032
- Figure 20: Europe Smart Implants Industry Revenue (Million), by End User 2024 & 2032
- Figure 21: Europe Smart Implants Industry Revenue Share (%), by End User 2024 & 2032
- Figure 22: Europe Smart Implants Industry Revenue (Million), by Country 2024 & 2032
- Figure 23: Europe Smart Implants Industry Revenue Share (%), by Country 2024 & 2032
- Figure 24: Asia Pacific Smart Implants Industry Revenue (Million), by Product Type 2024 & 2032
- Figure 25: Asia Pacific Smart Implants Industry Revenue Share (%), by Product Type 2024 & 2032
- Figure 26: Asia Pacific Smart Implants Industry Revenue (Million), by End User 2024 & 2032
- Figure 27: Asia Pacific Smart Implants Industry Revenue Share (%), by End User 2024 & 2032
- Figure 28: Asia Pacific Smart Implants Industry Revenue (Million), by Country 2024 & 2032
- Figure 29: Asia Pacific Smart Implants Industry Revenue Share (%), by Country 2024 & 2032
- Figure 30: Middle East and Africa Smart Implants Industry Revenue (Million), by Product Type 2024 & 2032
- Figure 31: Middle East and Africa Smart Implants Industry Revenue Share (%), by Product Type 2024 & 2032
- Figure 32: Middle East and Africa Smart Implants Industry Revenue (Million), by End User 2024 & 2032
- Figure 33: Middle East and Africa Smart Implants Industry Revenue Share (%), by End User 2024 & 2032
- Figure 34: Middle East and Africa Smart Implants Industry Revenue (Million), by Country 2024 & 2032
- Figure 35: Middle East and Africa Smart Implants Industry Revenue Share (%), by Country 2024 & 2032
- Figure 36: South America Smart Implants Industry Revenue (Million), by Product Type 2024 & 2032
- Figure 37: South America Smart Implants Industry Revenue Share (%), by Product Type 2024 & 2032
- Figure 38: South America Smart Implants Industry Revenue (Million), by End User 2024 & 2032
- Figure 39: South America Smart Implants Industry Revenue Share (%), by End User 2024 & 2032
- Figure 40: South America Smart Implants Industry Revenue (Million), by Country 2024 & 2032
- Figure 41: South America Smart Implants Industry Revenue Share (%), by Country 2024 & 2032
List of Tables
- Table 1: Global Smart Implants Industry Revenue Million Forecast, by Region 2019 & 2032
- Table 2: Global Smart Implants Industry Revenue Million Forecast, by Product Type 2019 & 2032
- Table 3: Global Smart Implants Industry Revenue Million Forecast, by End User 2019 & 2032
- Table 4: Global Smart Implants Industry Revenue Million Forecast, by Region 2019 & 2032
- Table 5: Global Smart Implants Industry Revenue Million Forecast, by Country 2019 & 2032
- Table 6: United States Smart Implants Industry Revenue (Million) Forecast, by Application 2019 & 2032
- Table 7: Canada Smart Implants Industry Revenue (Million) Forecast, by Application 2019 & 2032
- Table 8: Mexico Smart Implants Industry Revenue (Million) Forecast, by Application 2019 & 2032
- Table 9: Global Smart Implants Industry Revenue Million Forecast, by Country 2019 & 2032
- Table 10: Germany Smart Implants Industry Revenue (Million) Forecast, by Application 2019 & 2032
- Table 11: United Kingdom Smart Implants Industry Revenue (Million) Forecast, by Application 2019 & 2032
- Table 12: France Smart Implants Industry Revenue (Million) Forecast, by Application 2019 & 2032
- Table 13: Italy Smart Implants Industry Revenue (Million) Forecast, by Application 2019 & 2032
- Table 14: Spain Smart Implants Industry Revenue (Million) Forecast, by Application 2019 & 2032
- Table 15: Rest of Europe Smart Implants Industry Revenue (Million) Forecast, by Application 2019 & 2032
- Table 16: Global Smart Implants Industry Revenue Million Forecast, by Country 2019 & 2032
- Table 17: China Smart Implants Industry Revenue (Million) Forecast, by Application 2019 & 2032
- Table 18: Japan Smart Implants Industry Revenue (Million) Forecast, by Application 2019 & 2032
- Table 19: India Smart Implants Industry Revenue (Million) Forecast, by Application 2019 & 2032
- Table 20: Australia Smart Implants Industry Revenue (Million) Forecast, by Application 2019 & 2032
- Table 21: South Korea Smart Implants Industry Revenue (Million) Forecast, by Application 2019 & 2032
- Table 22: Rest of Asia Pacific Smart Implants Industry Revenue (Million) Forecast, by Application 2019 & 2032
- Table 23: Global Smart Implants Industry Revenue Million Forecast, by Country 2019 & 2032
- Table 24: GCC Smart Implants Industry Revenue (Million) Forecast, by Application 2019 & 2032
- Table 25: South Africa Smart Implants Industry Revenue (Million) Forecast, by Application 2019 & 2032
- Table 26: Rest of Middle East and Africa Smart Implants Industry Revenue (Million) Forecast, by Application 2019 & 2032
- Table 27: Global Smart Implants Industry Revenue Million Forecast, by Country 2019 & 2032
- Table 28: Brazil Smart Implants Industry Revenue (Million) Forecast, by Application 2019 & 2032
- Table 29: Argentina Smart Implants Industry Revenue (Million) Forecast, by Application 2019 & 2032
- Table 30: Rest of South America Smart Implants Industry Revenue (Million) Forecast, by Application 2019 & 2032
- Table 31: Global Smart Implants Industry Revenue Million Forecast, by Product Type 2019 & 2032
- Table 32: Global Smart Implants Industry Revenue Million Forecast, by End User 2019 & 2032
- Table 33: Global Smart Implants Industry Revenue Million Forecast, by Country 2019 & 2032
- Table 34: United States Smart Implants Industry Revenue (Million) Forecast, by Application 2019 & 2032
- Table 35: Canada Smart Implants Industry Revenue (Million) Forecast, by Application 2019 & 2032
- Table 36: Mexico Smart Implants Industry Revenue (Million) Forecast, by Application 2019 & 2032
- Table 37: Global Smart Implants Industry Revenue Million Forecast, by Product Type 2019 & 2032
- Table 38: Global Smart Implants Industry Revenue Million Forecast, by End User 2019 & 2032
- Table 39: Global Smart Implants Industry Revenue Million Forecast, by Country 2019 & 2032
- Table 40: Germany Smart Implants Industry Revenue (Million) Forecast, by Application 2019 & 2032
- Table 41: United Kingdom Smart Implants Industry Revenue (Million) Forecast, by Application 2019 & 2032
- Table 42: France Smart Implants Industry Revenue (Million) Forecast, by Application 2019 & 2032
- Table 43: Italy Smart Implants Industry Revenue (Million) Forecast, by Application 2019 & 2032
- Table 44: Spain Smart Implants Industry Revenue (Million) Forecast, by Application 2019 & 2032
- Table 45: Rest of Europe Smart Implants Industry Revenue (Million) Forecast, by Application 2019 & 2032
- Table 46: Global Smart Implants Industry Revenue Million Forecast, by Product Type 2019 & 2032
- Table 47: Global Smart Implants Industry Revenue Million Forecast, by End User 2019 & 2032
- Table 48: Global Smart Implants Industry Revenue Million Forecast, by Country 2019 & 2032
- Table 49: China Smart Implants Industry Revenue (Million) Forecast, by Application 2019 & 2032
- Table 50: Japan Smart Implants Industry Revenue (Million) Forecast, by Application 2019 & 2032
- Table 51: India Smart Implants Industry Revenue (Million) Forecast, by Application 2019 & 2032
- Table 52: Australia Smart Implants Industry Revenue (Million) Forecast, by Application 2019 & 2032
- Table 53: South Korea Smart Implants Industry Revenue (Million) Forecast, by Application 2019 & 2032
- Table 54: Rest of Asia Pacific Smart Implants Industry Revenue (Million) Forecast, by Application 2019 & 2032
- Table 55: Global Smart Implants Industry Revenue Million Forecast, by Product Type 2019 & 2032
- Table 56: Global Smart Implants Industry Revenue Million Forecast, by End User 2019 & 2032
- Table 57: Global Smart Implants Industry Revenue Million Forecast, by Country 2019 & 2032
- Table 58: GCC Smart Implants Industry Revenue (Million) Forecast, by Application 2019 & 2032
- Table 59: South Africa Smart Implants Industry Revenue (Million) Forecast, by Application 2019 & 2032
- Table 60: Rest of Middle East and Africa Smart Implants Industry Revenue (Million) Forecast, by Application 2019 & 2032
- Table 61: Global Smart Implants Industry Revenue Million Forecast, by Product Type 2019 & 2032
- Table 62: Global Smart Implants Industry Revenue Million Forecast, by End User 2019 & 2032
- Table 63: Global Smart Implants Industry Revenue Million Forecast, by Country 2019 & 2032
- Table 64: Brazil Smart Implants Industry Revenue (Million) Forecast, by Application 2019 & 2032
- Table 65: Argentina Smart Implants Industry Revenue (Million) Forecast, by Application 2019 & 2032
- Table 66: Rest of South America Smart Implants Industry Revenue (Million) Forecast, by Application 2019 & 2032
Frequently Asked Questions
1. What is the projected Compound Annual Growth Rate (CAGR) of the Smart Implants Industry?
The projected CAGR is approximately 19.20%.
2. Which companies are prominent players in the Smart Implants Industry?
Key companies in the market include CONMED, Canary Medical Inc, Rejoint srl, Medtronic, IQ Implants USA, Stryker, Johnson & Johnson (DePuy Synthes), Zimmer Biomet, NuVasive Inc, Smart Implant Solutions.
3. What are the main segments of the Smart Implants Industry?
The market segments include Product Type, End User.
4. Can you provide details about the market size?
The market size is estimated to be USD 5.38 Million as of 2022.
5. What are some drivers contributing to market growth?
Increase in the Geriatric Population with Various Chronic Disorder; Rising Incidence of Accidents and Sport Injuries; Technological Advancements in the Field of Smart Implants.
6. What are the notable trends driving market growth?
Orthopedic Smart Implants Segment is Expected to Witness high Growth Over the Forecast Period.
7. Are there any restraints impacting market growth?
Stringent Regulatory Framework.
8. Can you provide examples of recent developments in the market?
N/A
9. What pricing options are available for accessing the report?
Pricing options include single-user, multi-user, and enterprise licenses priced at USD 4750, USD 5250, and USD 8750 respectively.
10. Is the market size provided in terms of value or volume?
The market size is provided in terms of value, measured in Million.
11. Are there any specific market keywords associated with the report?
Yes, the market keyword associated with the report is "Smart Implants Industry," which aids in identifying and referencing the specific market segment covered.
12. How do I determine which pricing option suits my needs best?
The pricing options vary based on user requirements and access needs. Individual users may opt for single-user licenses, while businesses requiring broader access may choose multi-user or enterprise licenses for cost-effective access to the report.
13. Are there any additional resources or data provided in the Smart Implants Industry report?
While the report offers comprehensive insights, it's advisable to review the specific contents or supplementary materials provided to ascertain if additional resources or data are available.
14. How can I stay updated on further developments or reports in the Smart Implants Industry?
To stay informed about further developments, trends, and reports in the Smart Implants Industry, consider subscribing to industry newsletters, following relevant companies and organizations, or regularly checking reputable industry news sources and publications.
Methodology
Step 1 - Identification of Relevant Samples Size from Population Database


Step 2 - Approaches for Defining Global Market Size (Value, Volume* & Price*)

Note*: In applicable scenarios
Step 3 - Data Sources
Primary Research
- Web Analytics
- Survey Reports
- Research Institute
- Latest Research Reports
- Opinion Leaders
Secondary Research
- Annual Reports
- White Paper
- Latest Press Release
- Industry Association
- Paid Database
- Investor Presentations

Step 4 - Data Triangulation
Involves using different sources of information in order to increase the validity of a study
These sources are likely to be stakeholders in a program - participants, other researchers, program staff, other community members, and so on.
Then we put all data in single framework & apply various statistical tools to find out the dynamic on the market.
During the analysis stage, feedback from the stakeholder groups would be compared to determine areas of agreement as well as areas of divergence
