

Key Insights
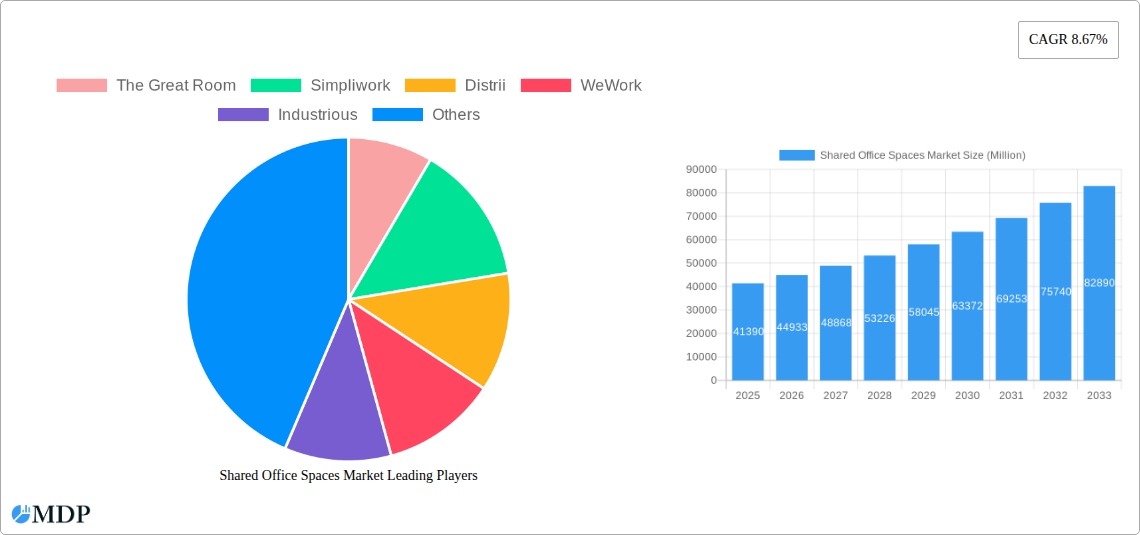
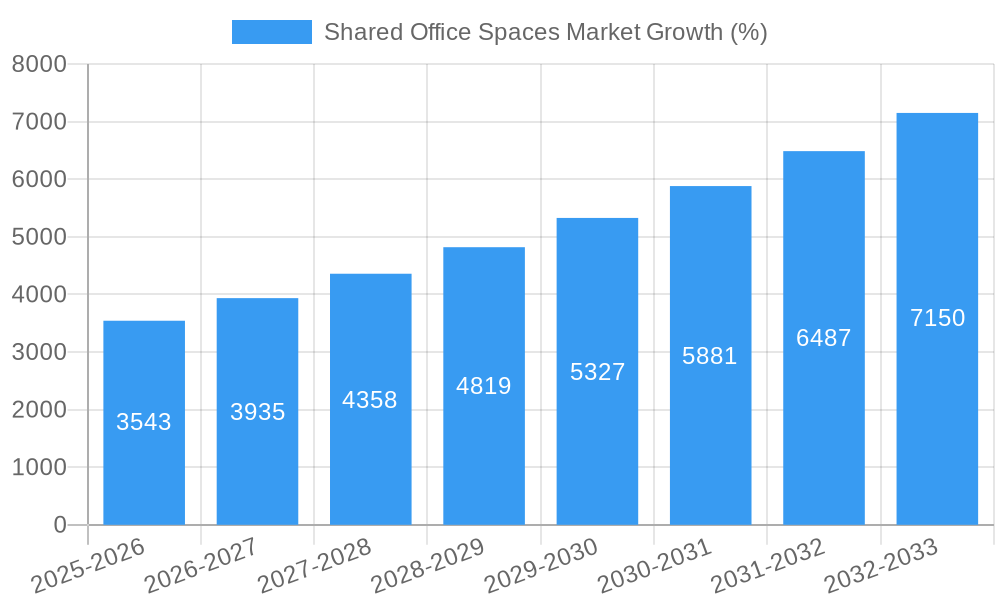
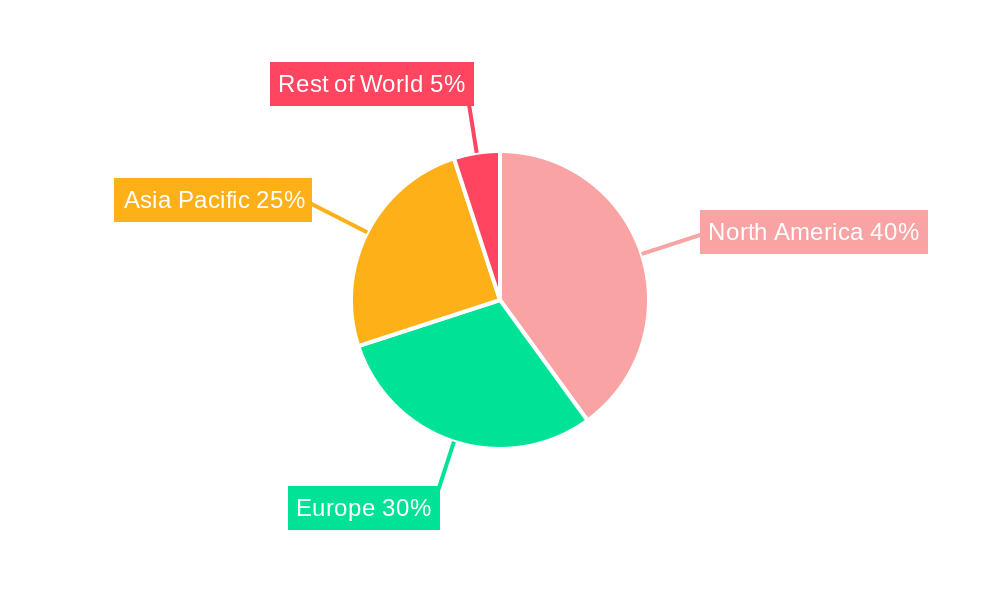
The global shared office space market, valued at $41.39 billion in 2025, is experiencing robust growth, projected to expand at a compound annual growth rate (CAGR) of 8.67% from 2025 to 2033. This expansion is driven by several key factors. The increasing adoption of flexible work models, particularly among startups, small and medium-sized enterprises (SMEs), and freelancers, fuels demand for cost-effective and adaptable workspaces. Technological advancements, such as improved booking systems and virtual office solutions, enhance the user experience and broaden the market's reach. Furthermore, the growing emphasis on collaboration and networking within the business community contributes to the popularity of shared workspaces, as they facilitate interaction and knowledge sharing among diverse professionals. The market is segmented by type (conventional, corporate, luxury, others), end-use (IT & ITES, legal services, BFSI, consulting, others), and user (freelancers, enterprises, others). North America and Asia-Pacific currently dominate the market, but significant growth potential exists in emerging economies. Challenges include competition from traditional office spaces, economic fluctuations impacting demand, and the need for providers to adapt to evolving technological and workplace trends.
The competitive landscape is dynamic, featuring both established international players like IWG Group and Regus, and agile local providers. Successful players are focusing on offering value-added services beyond basic workspace rental, including high-speed internet, meeting rooms, networking events, and administrative support. The market is further segmented geographically, with North America and Asia-Pacific commanding significant market share due to high concentrations of businesses and technologically advanced infrastructure. Future growth will be influenced by factors such as economic stability, technological innovation, and the continued evolution of work culture. The increasing demand for sustainable and environmentally friendly office spaces is also shaping the market, with providers incorporating green building practices and energy-efficient technologies to attract environmentally conscious businesses. The focus on providing flexible lease terms and customized solutions further enhances the attractiveness of shared office spaces, making them a viable alternative to traditional long-term office leases.
Shared Office Spaces Market: A Comprehensive Report (2019-2033)
This in-depth report provides a comprehensive analysis of the global Shared Office Spaces market, offering invaluable insights for investors, industry stakeholders, and strategic decision-makers. The study covers the period 2019-2033, with a focus on the 2025-2033 forecast period. We examine market dynamics, key trends, leading players, and future growth opportunities, providing actionable intelligence to navigate this dynamic sector. The market is projected to reach xx Million by 2033, demonstrating significant growth potential.
Shared Office Spaces Market Dynamics & Concentration
The shared office space market exhibits a moderately concentrated landscape, with key players like WeWork, IWG Group, and Regus holding significant market share. However, the market is also characterized by a considerable number of smaller, regional players, fostering competition and innovation. The market share of the top 5 players is estimated at xx%, indicating room for expansion by both established and emerging companies.
Market Concentration Drivers:
- Technological advancements: Improvements in booking systems, space management software, and communication tools enhance operational efficiency and user experience.
- Regulatory frameworks: Government policies supporting flexible work arrangements and promoting entrepreneurship influence market growth.
- Product substitutes: While traditional office spaces remain a primary competitor, the increasing demand for flexibility and cost-effectiveness favors shared office spaces.
- End-user trends: The rise of remote work, freelancing, and the need for collaborative workspaces drive market expansion across various industries.
- M&A Activities: Consolidation through mergers and acquisitions is shaping the market landscape, leading to increased economies of scale and enhanced service offerings. Over the historical period (2019-2024), approximately xx M&A deals were recorded in the shared office space sector.
Shared Office Spaces Market Industry Trends & Analysis
The shared office space market is experiencing robust growth, fueled by several key factors. The market's Compound Annual Growth Rate (CAGR) during the historical period (2019-2024) was estimated at xx%, and is projected to reach xx% during the forecast period (2025-2033). This growth is driven by several factors:
- Shifting work paradigms: The increasing adoption of remote work and flexible work arrangements fuels the demand for shared office spaces among both freelancers and enterprises.
- Technological advancements: The integration of smart technologies, such as IoT-enabled workspace management systems and virtual meeting platforms, enhances efficiency and user experience.
- Cost-effectiveness: Shared office spaces offer a cost-effective alternative to traditional office leases, particularly attractive to startups and small businesses.
- Enhanced networking opportunities: Shared spaces foster collaboration and networking among diverse professionals, leading to business growth and innovation.
- Premium offerings: The emergence of luxury and corporate-focused shared office spaces catering to specific needs, further driving market segmentation. Market penetration of premium spaces is estimated at xx% in 2025.
Leading Markets & Segments in Shared Office Spaces Market
The North American market currently dominates the global shared office space market, driven by factors such as strong economic growth, a large pool of freelancers and startups, and robust technological infrastructure. However, significant growth is projected in Asia-Pacific regions driven by rapid urbanization and economic expansion.
Dominant Segments:
- By Type: The corporate segment is experiencing rapid growth due to the increasing adoption of flexible work strategies by large organizations.
- By End Use: The Information Technology (IT and ITES) sector represents a significant portion of the market, followed by the BFSI and consulting sectors.
- By User: Enterprises are driving significant growth, while the freelancer segment contributes a considerable portion as well.
Key Drivers for Regional Dominance:
- Economic Policies: Government incentives promoting entrepreneurship and flexible work arrangements.
- Infrastructure: Availability of high-speed internet, robust transportation networks, and supportive urban planning.
Shared Office Spaces Market Product Developments
Recent product innovations focus on enhancing user experience, flexibility, and sustainability. This includes the integration of smart technology for workspace management, personalized service offerings, and eco-friendly designs. These innovations cater to evolving user preferences and competitive pressures, contributing to a more vibrant and adaptable market. Key features like virtual office solutions and enhanced security are further differentiating products.
Key Drivers of Shared Office Spaces Market Growth
The shared office space market is propelled by several key drivers, including:
- Technological advancements leading to efficient workspace management systems and improved communication platforms.
- Economic factors such as the increasing number of startups and freelancers.
- Government policies promoting flexible work arrangements and entrepreneurship.
Challenges in the Shared Office Spaces Market
The market faces certain challenges, including:
- Increased competition leading to pricing pressures.
- Economic downturns impacting occupancy rates.
- Supply chain disruptions affecting the construction and furnishing of shared office spaces. These have reduced capacity by approximately xx% in 2024.
Emerging Opportunities in Shared Office Spaces Market
Significant opportunities exist in the shared office space market, including:
- Expansion into emerging markets with high growth potential.
- Strategic partnerships to offer integrated services.
- Development of sustainable and technologically advanced spaces.
Leading Players in the Shared Office Spaces Market Sector
- The Great Room
- Simpliwork
- Distrii
- WeWork
- Industrious
- IWG Group
- Convene
- District Cowork
- Regus
- JustCo
- Servcorp Limited
Key Milestones in Shared Office Spaces Market Industry
- June 2023: The Great Room by Industrious expands into the Australian market, opening a new location in Sydney's CBD.
- July 2023: Industrious partners with Instacart to offer same-day delivery and Instacart+ memberships to its US clients.
Strategic Outlook for Shared Office Spaces Market
The shared office space market is poised for continued growth, driven by ongoing technological advancements, the rise of remote work, and the increasing demand for flexible and collaborative workspaces. Strategic partnerships, expansion into new markets, and innovative service offerings will be crucial for success in this dynamic sector.
Shared Office Spaces Market Segmentation
-
1. Type
- 1.1. Co-Working Space
- 1.2. Serviced offices / Executive suites
- 1.3. Others (Hybrid, Virtual Office)
-
2. End Use
- 2.1. Information Technology (IT and ITES)
- 2.2. BFSI (Banking, Financial Services and Insurance)
- 2.3. Business Consulting & Professional Services
- 2.4. Other Se
-
3. User
- 3.1. Freelancers
- 3.2. Enterprises
- 3.3. Start Ups
- 3.4. Others (Remote Worker, Digital Nomads)
Shared Office Spaces Market Segmentation By Geography
-
1. North America
- 1.1. United States
- 1.2. Canada
- 1.3. Mexico
-
2. Asia Pacific
- 2.1. India
- 2.2. China
- 2.3. Singapore
- 2.4. Japan
- 2.5. South Korea
- 2.6. Vietnam
- 2.7. Australia
- 2.8. Rest of Asia Pacific
-
3. Europe
- 3.1. Germany
- 3.2. United Kingdom
- 3.3. Spain
- 3.4. France
- 3.5. Italy
- 3.6. Rest of Europe
- 4. Middle East
-
5. United Arab Emirates
- 5.1. Saudi Arabia
- 5.2. Egypt
- 5.3. Rest of Middle East and Africa
- 6. Rest of the world
Shared Office Spaces Market REPORT HIGHLIGHTS
| Aspects | Details |
|---|---|
| Study Period | 2019-2033 |
| Base Year | 2024 |
| Estimated Year | 2025 |
| Forecast Period | 2025-2033 |
| Historical Period | 2019-2024 |
| Growth Rate | CAGR of 8.67% from 2019-2033 |
| Segmentation |
|
Table of Contents
- 1. Introduction
- 1.1. Research Scope
- 1.2. Market Segmentation
- 1.3. Research Methodology
- 1.4. Definitions and Assumptions
- 2. Executive Summary
- 2.1. Introduction
- 3. Market Dynamics
- 3.1. Introduction
- 3.2. Market Drivers
- 3.2.1. Increasing Adoption of Remote and Hybrid Work Model
- 3.3. Market Restrains
- 3.3.1. Lack of Privacy
- 3.4. Market Trends
- 3.4.1. Increasing Number of Co-working Space Members
- 4. Market Factor Analysis
- 4.1. Porters Five Forces
- 4.2. Supply/Value Chain
- 4.3. PESTEL analysis
- 4.4. Market Entropy
- 4.5. Patent/Trademark Analysis
- 5. Global Shared Office Spaces Market Analysis, Insights and Forecast, 2019-2031
- 5.1. Market Analysis, Insights and Forecast - by Type
- 5.1.1. Co-Working Space
- 5.1.2. Serviced offices / Executive suites
- 5.1.3. Others (Hybrid, Virtual Office)
- 5.2. Market Analysis, Insights and Forecast - by End Use
- 5.2.1. Information Technology (IT and ITES)
- 5.2.2. BFSI (Banking, Financial Services and Insurance)
- 5.2.3. Business Consulting & Professional Services
- 5.2.4. Other Se
- 5.3. Market Analysis, Insights and Forecast - by User
- 5.3.1. Freelancers
- 5.3.2. Enterprises
- 5.3.3. Start Ups
- 5.3.4. Others (Remote Worker, Digital Nomads)
- 5.4. Market Analysis, Insights and Forecast - by Region
- 5.4.1. North America
- 5.4.2. Asia Pacific
- 5.4.3. Europe
- 5.4.4. Middle East
- 5.4.5. United Arab Emirates
- 5.4.6. Rest of the world
- 5.1. Market Analysis, Insights and Forecast - by Type
- 6. North America Shared Office Spaces Market Analysis, Insights and Forecast, 2019-2031
- 6.1. Market Analysis, Insights and Forecast - by Type
- 6.1.1. Co-Working Space
- 6.1.2. Serviced offices / Executive suites
- 6.1.3. Others (Hybrid, Virtual Office)
- 6.2. Market Analysis, Insights and Forecast - by End Use
- 6.2.1. Information Technology (IT and ITES)
- 6.2.2. BFSI (Banking, Financial Services and Insurance)
- 6.2.3. Business Consulting & Professional Services
- 6.2.4. Other Se
- 6.3. Market Analysis, Insights and Forecast - by User
- 6.3.1. Freelancers
- 6.3.2. Enterprises
- 6.3.3. Start Ups
- 6.3.4. Others (Remote Worker, Digital Nomads)
- 6.1. Market Analysis, Insights and Forecast - by Type
- 7. Asia Pacific Shared Office Spaces Market Analysis, Insights and Forecast, 2019-2031
- 7.1. Market Analysis, Insights and Forecast - by Type
- 7.1.1. Co-Working Space
- 7.1.2. Serviced offices / Executive suites
- 7.1.3. Others (Hybrid, Virtual Office)
- 7.2. Market Analysis, Insights and Forecast - by End Use
- 7.2.1. Information Technology (IT and ITES)
- 7.2.2. BFSI (Banking, Financial Services and Insurance)
- 7.2.3. Business Consulting & Professional Services
- 7.2.4. Other Se
- 7.3. Market Analysis, Insights and Forecast - by User
- 7.3.1. Freelancers
- 7.3.2. Enterprises
- 7.3.3. Start Ups
- 7.3.4. Others (Remote Worker, Digital Nomads)
- 7.1. Market Analysis, Insights and Forecast - by Type
- 8. Europe Shared Office Spaces Market Analysis, Insights and Forecast, 2019-2031
- 8.1. Market Analysis, Insights and Forecast - by Type
- 8.1.1. Co-Working Space
- 8.1.2. Serviced offices / Executive suites
- 8.1.3. Others (Hybrid, Virtual Office)
- 8.2. Market Analysis, Insights and Forecast - by End Use
- 8.2.1. Information Technology (IT and ITES)
- 8.2.2. BFSI (Banking, Financial Services and Insurance)
- 8.2.3. Business Consulting & Professional Services
- 8.2.4. Other Se
- 8.3. Market Analysis, Insights and Forecast - by User
- 8.3.1. Freelancers
- 8.3.2. Enterprises
- 8.3.3. Start Ups
- 8.3.4. Others (Remote Worker, Digital Nomads)
- 8.1. Market Analysis, Insights and Forecast - by Type
- 9. Middle East Shared Office Spaces Market Analysis, Insights and Forecast, 2019-2031
- 9.1. Market Analysis, Insights and Forecast - by Type
- 9.1.1. Co-Working Space
- 9.1.2. Serviced offices / Executive suites
- 9.1.3. Others (Hybrid, Virtual Office)
- 9.2. Market Analysis, Insights and Forecast - by End Use
- 9.2.1. Information Technology (IT and ITES)
- 9.2.2. BFSI (Banking, Financial Services and Insurance)
- 9.2.3. Business Consulting & Professional Services
- 9.2.4. Other Se
- 9.3. Market Analysis, Insights and Forecast - by User
- 9.3.1. Freelancers
- 9.3.2. Enterprises
- 9.3.3. Start Ups
- 9.3.4. Others (Remote Worker, Digital Nomads)
- 9.1. Market Analysis, Insights and Forecast - by Type
- 10. United Arab Emirates Shared Office Spaces Market Analysis, Insights and Forecast, 2019-2031
- 10.1. Market Analysis, Insights and Forecast - by Type
- 10.1.1. Co-Working Space
- 10.1.2. Serviced offices / Executive suites
- 10.1.3. Others (Hybrid, Virtual Office)
- 10.2. Market Analysis, Insights and Forecast - by End Use
- 10.2.1. Information Technology (IT and ITES)
- 10.2.2. BFSI (Banking, Financial Services and Insurance)
- 10.2.3. Business Consulting & Professional Services
- 10.2.4. Other Se
- 10.3. Market Analysis, Insights and Forecast - by User
- 10.3.1. Freelancers
- 10.3.2. Enterprises
- 10.3.3. Start Ups
- 10.3.4. Others (Remote Worker, Digital Nomads)
- 10.1. Market Analysis, Insights and Forecast - by Type
- 11. Rest of the world Shared Office Spaces Market Analysis, Insights and Forecast, 2019-2031
- 11.1. Market Analysis, Insights and Forecast - by Type
- 11.1.1. Co-Working Space
- 11.1.2. Serviced offices / Executive suites
- 11.1.3. Others (Hybrid, Virtual Office)
- 11.2. Market Analysis, Insights and Forecast - by End Use
- 11.2.1. Information Technology (IT and ITES)
- 11.2.2. BFSI (Banking, Financial Services and Insurance)
- 11.2.3. Business Consulting & Professional Services
- 11.2.4. Other Se
- 11.3. Market Analysis, Insights and Forecast - by User
- 11.3.1. Freelancers
- 11.3.2. Enterprises
- 11.3.3. Start Ups
- 11.3.4. Others (Remote Worker, Digital Nomads)
- 11.1. Market Analysis, Insights and Forecast - by Type
- 12. North America Shared Office Spaces Market Analysis, Insights and Forecast, 2019-2031
- 12.1. Market Analysis, Insights and Forecast - By Country/Sub-region
- 12.1.1 United States
- 12.1.2 Canada
- 12.1.3 Mexico
- 13. Asia Pacific Shared Office Spaces Market Analysis, Insights and Forecast, 2019-2031
- 13.1. Market Analysis, Insights and Forecast - By Country/Sub-region
- 13.1.1 India
- 13.1.2 China
- 13.1.3 Singapore
- 13.1.4 Japan
- 13.1.5 South Korea
- 13.1.6 Vietnam
- 13.1.7 Australia
- 13.1.8 Rest of Asia Pacific
- 14. Europe Shared Office Spaces Market Analysis, Insights and Forecast, 2019-2031
- 14.1. Market Analysis, Insights and Forecast - By Country/Sub-region
- 14.1.1 Germany
- 14.1.2 United Kingdom
- 14.1.3 Spain
- 14.1.4 France
- 14.1.5 Italy
- 14.1.6 Rest of Europe
- 15. Middle East Shared Office Spaces Market Analysis, Insights and Forecast, 2019-2031
- 15.1. Market Analysis, Insights and Forecast - By Country/Sub-region
- 15.1.1.
- 16. United Arab Emirates Shared Office Spaces Market Analysis, Insights and Forecast, 2019-2031
- 16.1. Market Analysis, Insights and Forecast - By Country/Sub-region
- 16.1.1 Saudi Arabia
- 16.1.2 Egypt
- 16.1.3 Rest of Middle East and Africa
- 17. Rest of the world Shared Office Spaces Market Analysis, Insights and Forecast, 2019-2031
- 17.1. Market Analysis, Insights and Forecast - By Country/Sub-region
- 17.1.1.
- 18. Competitive Analysis
- 18.1. Global Market Share Analysis 2024
- 18.2. Company Profiles
- 18.2.1 The Great Room
- 18.2.1.1. Overview
- 18.2.1.2. Products
- 18.2.1.3. SWOT Analysis
- 18.2.1.4. Recent Developments
- 18.2.1.5. Financials (Based on Availability)
- 18.2.2 Simpliwork
- 18.2.2.1. Overview
- 18.2.2.2. Products
- 18.2.2.3. SWOT Analysis
- 18.2.2.4. Recent Developments
- 18.2.2.5. Financials (Based on Availability)
- 18.2.3 Distrii
- 18.2.3.1. Overview
- 18.2.3.2. Products
- 18.2.3.3. SWOT Analysis
- 18.2.3.4. Recent Developments
- 18.2.3.5. Financials (Based on Availability)
- 18.2.4 WeWork
- 18.2.4.1. Overview
- 18.2.4.2. Products
- 18.2.4.3. SWOT Analysis
- 18.2.4.4. Recent Developments
- 18.2.4.5. Financials (Based on Availability)
- 18.2.5 Industrious
- 18.2.5.1. Overview
- 18.2.5.2. Products
- 18.2.5.3. SWOT Analysis
- 18.2.5.4. Recent Developments
- 18.2.5.5. Financials (Based on Availability)
- 18.2.6 IWG Group
- 18.2.6.1. Overview
- 18.2.6.2. Products
- 18.2.6.3. SWOT Analysis
- 18.2.6.4. Recent Developments
- 18.2.6.5. Financials (Based on Availability)
- 18.2.7 Convene**List Not Exhaustive
- 18.2.7.1. Overview
- 18.2.7.2. Products
- 18.2.7.3. SWOT Analysis
- 18.2.7.4. Recent Developments
- 18.2.7.5. Financials (Based on Availability)
- 18.2.8 District Cowork
- 18.2.8.1. Overview
- 18.2.8.2. Products
- 18.2.8.3. SWOT Analysis
- 18.2.8.4. Recent Developments
- 18.2.8.5. Financials (Based on Availability)
- 18.2.9 Regus
- 18.2.9.1. Overview
- 18.2.9.2. Products
- 18.2.9.3. SWOT Analysis
- 18.2.9.4. Recent Developments
- 18.2.9.5. Financials (Based on Availability)
- 18.2.10 JustCo
- 18.2.10.1. Overview
- 18.2.10.2. Products
- 18.2.10.3. SWOT Analysis
- 18.2.10.4. Recent Developments
- 18.2.10.5. Financials (Based on Availability)
- 18.2.11 Servcorp Limited
- 18.2.11.1. Overview
- 18.2.11.2. Products
- 18.2.11.3. SWOT Analysis
- 18.2.11.4. Recent Developments
- 18.2.11.5. Financials (Based on Availability)
- 18.2.1 The Great Room
List of Figures
- Figure 1: Global Shared Office Spaces Market Revenue Breakdown (Million, %) by Region 2024 & 2032
- Figure 2: North America Shared Office Spaces Market Revenue (Million), by Country 2024 & 2032
- Figure 3: North America Shared Office Spaces Market Revenue Share (%), by Country 2024 & 2032
- Figure 4: Asia Pacific Shared Office Spaces Market Revenue (Million), by Country 2024 & 2032
- Figure 5: Asia Pacific Shared Office Spaces Market Revenue Share (%), by Country 2024 & 2032
- Figure 6: Europe Shared Office Spaces Market Revenue (Million), by Country 2024 & 2032
- Figure 7: Europe Shared Office Spaces Market Revenue Share (%), by Country 2024 & 2032
- Figure 8: Middle East Shared Office Spaces Market Revenue (Million), by Country 2024 & 2032
- Figure 9: Middle East Shared Office Spaces Market Revenue Share (%), by Country 2024 & 2032
- Figure 10: United Arab Emirates Shared Office Spaces Market Revenue (Million), by Country 2024 & 2032
- Figure 11: United Arab Emirates Shared Office Spaces Market Revenue Share (%), by Country 2024 & 2032
- Figure 12: Rest of the world Shared Office Spaces Market Revenue (Million), by Country 2024 & 2032
- Figure 13: Rest of the world Shared Office Spaces Market Revenue Share (%), by Country 2024 & 2032
- Figure 14: North America Shared Office Spaces Market Revenue (Million), by Type 2024 & 2032
- Figure 15: North America Shared Office Spaces Market Revenue Share (%), by Type 2024 & 2032
- Figure 16: North America Shared Office Spaces Market Revenue (Million), by End Use 2024 & 2032
- Figure 17: North America Shared Office Spaces Market Revenue Share (%), by End Use 2024 & 2032
- Figure 18: North America Shared Office Spaces Market Revenue (Million), by User 2024 & 2032
- Figure 19: North America Shared Office Spaces Market Revenue Share (%), by User 2024 & 2032
- Figure 20: North America Shared Office Spaces Market Revenue (Million), by Country 2024 & 2032
- Figure 21: North America Shared Office Spaces Market Revenue Share (%), by Country 2024 & 2032
- Figure 22: Asia Pacific Shared Office Spaces Market Revenue (Million), by Type 2024 & 2032
- Figure 23: Asia Pacific Shared Office Spaces Market Revenue Share (%), by Type 2024 & 2032
- Figure 24: Asia Pacific Shared Office Spaces Market Revenue (Million), by End Use 2024 & 2032
- Figure 25: Asia Pacific Shared Office Spaces Market Revenue Share (%), by End Use 2024 & 2032
- Figure 26: Asia Pacific Shared Office Spaces Market Revenue (Million), by User 2024 & 2032
- Figure 27: Asia Pacific Shared Office Spaces Market Revenue Share (%), by User 2024 & 2032
- Figure 28: Asia Pacific Shared Office Spaces Market Revenue (Million), by Country 2024 & 2032
- Figure 29: Asia Pacific Shared Office Spaces Market Revenue Share (%), by Country 2024 & 2032
- Figure 30: Europe Shared Office Spaces Market Revenue (Million), by Type 2024 & 2032
- Figure 31: Europe Shared Office Spaces Market Revenue Share (%), by Type 2024 & 2032
- Figure 32: Europe Shared Office Spaces Market Revenue (Million), by End Use 2024 & 2032
- Figure 33: Europe Shared Office Spaces Market Revenue Share (%), by End Use 2024 & 2032
- Figure 34: Europe Shared Office Spaces Market Revenue (Million), by User 2024 & 2032
- Figure 35: Europe Shared Office Spaces Market Revenue Share (%), by User 2024 & 2032
- Figure 36: Europe Shared Office Spaces Market Revenue (Million), by Country 2024 & 2032
- Figure 37: Europe Shared Office Spaces Market Revenue Share (%), by Country 2024 & 2032
- Figure 38: Middle East Shared Office Spaces Market Revenue (Million), by Type 2024 & 2032
- Figure 39: Middle East Shared Office Spaces Market Revenue Share (%), by Type 2024 & 2032
- Figure 40: Middle East Shared Office Spaces Market Revenue (Million), by End Use 2024 & 2032
- Figure 41: Middle East Shared Office Spaces Market Revenue Share (%), by End Use 2024 & 2032
- Figure 42: Middle East Shared Office Spaces Market Revenue (Million), by User 2024 & 2032
- Figure 43: Middle East Shared Office Spaces Market Revenue Share (%), by User 2024 & 2032
- Figure 44: Middle East Shared Office Spaces Market Revenue (Million), by Country 2024 & 2032
- Figure 45: Middle East Shared Office Spaces Market Revenue Share (%), by Country 2024 & 2032
- Figure 46: United Arab Emirates Shared Office Spaces Market Revenue (Million), by Type 2024 & 2032
- Figure 47: United Arab Emirates Shared Office Spaces Market Revenue Share (%), by Type 2024 & 2032
- Figure 48: United Arab Emirates Shared Office Spaces Market Revenue (Million), by End Use 2024 & 2032
- Figure 49: United Arab Emirates Shared Office Spaces Market Revenue Share (%), by End Use 2024 & 2032
- Figure 50: United Arab Emirates Shared Office Spaces Market Revenue (Million), by User 2024 & 2032
- Figure 51: United Arab Emirates Shared Office Spaces Market Revenue Share (%), by User 2024 & 2032
- Figure 52: United Arab Emirates Shared Office Spaces Market Revenue (Million), by Country 2024 & 2032
- Figure 53: United Arab Emirates Shared Office Spaces Market Revenue Share (%), by Country 2024 & 2032
- Figure 54: Rest of the world Shared Office Spaces Market Revenue (Million), by Type 2024 & 2032
- Figure 55: Rest of the world Shared Office Spaces Market Revenue Share (%), by Type 2024 & 2032
- Figure 56: Rest of the world Shared Office Spaces Market Revenue (Million), by End Use 2024 & 2032
- Figure 57: Rest of the world Shared Office Spaces Market Revenue Share (%), by End Use 2024 & 2032
- Figure 58: Rest of the world Shared Office Spaces Market Revenue (Million), by User 2024 & 2032
- Figure 59: Rest of the world Shared Office Spaces Market Revenue Share (%), by User 2024 & 2032
- Figure 60: Rest of the world Shared Office Spaces Market Revenue (Million), by Country 2024 & 2032
- Figure 61: Rest of the world Shared Office Spaces Market Revenue Share (%), by Country 2024 & 2032
List of Tables
- Table 1: Global Shared Office Spaces Market Revenue Million Forecast, by Region 2019 & 2032
- Table 2: Global Shared Office Spaces Market Revenue Million Forecast, by Type 2019 & 2032
- Table 3: Global Shared Office Spaces Market Revenue Million Forecast, by End Use 2019 & 2032
- Table 4: Global Shared Office Spaces Market Revenue Million Forecast, by User 2019 & 2032
- Table 5: Global Shared Office Spaces Market Revenue Million Forecast, by Region 2019 & 2032
- Table 6: Global Shared Office Spaces Market Revenue Million Forecast, by Country 2019 & 2032
- Table 7: United States Shared Office Spaces Market Revenue (Million) Forecast, by Application 2019 & 2032
- Table 8: Canada Shared Office Spaces Market Revenue (Million) Forecast, by Application 2019 & 2032
- Table 9: Mexico Shared Office Spaces Market Revenue (Million) Forecast, by Application 2019 & 2032
- Table 10: Global Shared Office Spaces Market Revenue Million Forecast, by Country 2019 & 2032
- Table 11: India Shared Office Spaces Market Revenue (Million) Forecast, by Application 2019 & 2032
- Table 12: China Shared Office Spaces Market Revenue (Million) Forecast, by Application 2019 & 2032
- Table 13: Singapore Shared Office Spaces Market Revenue (Million) Forecast, by Application 2019 & 2032
- Table 14: Japan Shared Office Spaces Market Revenue (Million) Forecast, by Application 2019 & 2032
- Table 15: South Korea Shared Office Spaces Market Revenue (Million) Forecast, by Application 2019 & 2032
- Table 16: Vietnam Shared Office Spaces Market Revenue (Million) Forecast, by Application 2019 & 2032
- Table 17: Australia Shared Office Spaces Market Revenue (Million) Forecast, by Application 2019 & 2032
- Table 18: Rest of Asia Pacific Shared Office Spaces Market Revenue (Million) Forecast, by Application 2019 & 2032
- Table 19: Global Shared Office Spaces Market Revenue Million Forecast, by Country 2019 & 2032
- Table 20: Germany Shared Office Spaces Market Revenue (Million) Forecast, by Application 2019 & 2032
- Table 21: United Kingdom Shared Office Spaces Market Revenue (Million) Forecast, by Application 2019 & 2032
- Table 22: Spain Shared Office Spaces Market Revenue (Million) Forecast, by Application 2019 & 2032
- Table 23: France Shared Office Spaces Market Revenue (Million) Forecast, by Application 2019 & 2032
- Table 24: Italy Shared Office Spaces Market Revenue (Million) Forecast, by Application 2019 & 2032
- Table 25: Rest of Europe Shared Office Spaces Market Revenue (Million) Forecast, by Application 2019 & 2032
- Table 26: Global Shared Office Spaces Market Revenue Million Forecast, by Country 2019 & 2032
- Table 27: Shared Office Spaces Market Revenue (Million) Forecast, by Application 2019 & 2032
- Table 28: Global Shared Office Spaces Market Revenue Million Forecast, by Country 2019 & 2032
- Table 29: Saudi Arabia Shared Office Spaces Market Revenue (Million) Forecast, by Application 2019 & 2032
- Table 30: Egypt Shared Office Spaces Market Revenue (Million) Forecast, by Application 2019 & 2032
- Table 31: Rest of Middle East and Africa Shared Office Spaces Market Revenue (Million) Forecast, by Application 2019 & 2032
- Table 32: Global Shared Office Spaces Market Revenue Million Forecast, by Country 2019 & 2032
- Table 33: Shared Office Spaces Market Revenue (Million) Forecast, by Application 2019 & 2032
- Table 34: Global Shared Office Spaces Market Revenue Million Forecast, by Type 2019 & 2032
- Table 35: Global Shared Office Spaces Market Revenue Million Forecast, by End Use 2019 & 2032
- Table 36: Global Shared Office Spaces Market Revenue Million Forecast, by User 2019 & 2032
- Table 37: Global Shared Office Spaces Market Revenue Million Forecast, by Country 2019 & 2032
- Table 38: United States Shared Office Spaces Market Revenue (Million) Forecast, by Application 2019 & 2032
- Table 39: Canada Shared Office Spaces Market Revenue (Million) Forecast, by Application 2019 & 2032
- Table 40: Mexico Shared Office Spaces Market Revenue (Million) Forecast, by Application 2019 & 2032
- Table 41: Global Shared Office Spaces Market Revenue Million Forecast, by Type 2019 & 2032
- Table 42: Global Shared Office Spaces Market Revenue Million Forecast, by End Use 2019 & 2032
- Table 43: Global Shared Office Spaces Market Revenue Million Forecast, by User 2019 & 2032
- Table 44: Global Shared Office Spaces Market Revenue Million Forecast, by Country 2019 & 2032
- Table 45: India Shared Office Spaces Market Revenue (Million) Forecast, by Application 2019 & 2032
- Table 46: China Shared Office Spaces Market Revenue (Million) Forecast, by Application 2019 & 2032
- Table 47: Singapore Shared Office Spaces Market Revenue (Million) Forecast, by Application 2019 & 2032
- Table 48: Japan Shared Office Spaces Market Revenue (Million) Forecast, by Application 2019 & 2032
- Table 49: South Korea Shared Office Spaces Market Revenue (Million) Forecast, by Application 2019 & 2032
- Table 50: Vietnam Shared Office Spaces Market Revenue (Million) Forecast, by Application 2019 & 2032
- Table 51: Australia Shared Office Spaces Market Revenue (Million) Forecast, by Application 2019 & 2032
- Table 52: Rest of Asia Pacific Shared Office Spaces Market Revenue (Million) Forecast, by Application 2019 & 2032
- Table 53: Global Shared Office Spaces Market Revenue Million Forecast, by Type 2019 & 2032
- Table 54: Global Shared Office Spaces Market Revenue Million Forecast, by End Use 2019 & 2032
- Table 55: Global Shared Office Spaces Market Revenue Million Forecast, by User 2019 & 2032
- Table 56: Global Shared Office Spaces Market Revenue Million Forecast, by Country 2019 & 2032
- Table 57: Germany Shared Office Spaces Market Revenue (Million) Forecast, by Application 2019 & 2032
- Table 58: United Kingdom Shared Office Spaces Market Revenue (Million) Forecast, by Application 2019 & 2032
- Table 59: Spain Shared Office Spaces Market Revenue (Million) Forecast, by Application 2019 & 2032
- Table 60: France Shared Office Spaces Market Revenue (Million) Forecast, by Application 2019 & 2032
- Table 61: Italy Shared Office Spaces Market Revenue (Million) Forecast, by Application 2019 & 2032
- Table 62: Rest of Europe Shared Office Spaces Market Revenue (Million) Forecast, by Application 2019 & 2032
- Table 63: Global Shared Office Spaces Market Revenue Million Forecast, by Type 2019 & 2032
- Table 64: Global Shared Office Spaces Market Revenue Million Forecast, by End Use 2019 & 2032
- Table 65: Global Shared Office Spaces Market Revenue Million Forecast, by User 2019 & 2032
- Table 66: Global Shared Office Spaces Market Revenue Million Forecast, by Country 2019 & 2032
- Table 67: Global Shared Office Spaces Market Revenue Million Forecast, by Type 2019 & 2032
- Table 68: Global Shared Office Spaces Market Revenue Million Forecast, by End Use 2019 & 2032
- Table 69: Global Shared Office Spaces Market Revenue Million Forecast, by User 2019 & 2032
- Table 70: Global Shared Office Spaces Market Revenue Million Forecast, by Country 2019 & 2032
- Table 71: Saudi Arabia Shared Office Spaces Market Revenue (Million) Forecast, by Application 2019 & 2032
- Table 72: Egypt Shared Office Spaces Market Revenue (Million) Forecast, by Application 2019 & 2032
- Table 73: Rest of Middle East and Africa Shared Office Spaces Market Revenue (Million) Forecast, by Application 2019 & 2032
- Table 74: Global Shared Office Spaces Market Revenue Million Forecast, by Type 2019 & 2032
- Table 75: Global Shared Office Spaces Market Revenue Million Forecast, by End Use 2019 & 2032
- Table 76: Global Shared Office Spaces Market Revenue Million Forecast, by User 2019 & 2032
- Table 77: Global Shared Office Spaces Market Revenue Million Forecast, by Country 2019 & 2032
Frequently Asked Questions
1. What is the projected Compound Annual Growth Rate (CAGR) of the Shared Office Spaces Market?
The projected CAGR is approximately 8.67%.
2. Which companies are prominent players in the Shared Office Spaces Market?
Key companies in the market include The Great Room, Simpliwork, Distrii, WeWork, Industrious, IWG Group, Convene**List Not Exhaustive, District Cowork, Regus, JustCo, Servcorp Limited.
3. What are the main segments of the Shared Office Spaces Market?
The market segments include Type, End Use, User.
4. Can you provide details about the market size?
The market size is estimated to be USD 41.39 Million as of 2022.
5. What are some drivers contributing to market growth?
Increasing Adoption of Remote and Hybrid Work Model.
6. What are the notable trends driving market growth?
Increasing Number of Co-working Space Members.
7. Are there any restraints impacting market growth?
Lack of Privacy.
8. Can you provide examples of recent developments in the market?
June 2023: Premium hospitality-led coworking space, THE GREAT ROOM by Industrious, is announced its expansion into the Australian market. The Great Room is set to open its doors in the heart of Sydney’s CBD at Level 29, 85 Castlereagh Street, marking its first foray into the country in partnership with Australia & New Zealand-based asset manager 151 Property. Spanning 1,200 sqm, 35 dedicated offices and enterprise customised spaces, the new Sydney location will overlook iconic Hyde Park and provide the same high standard of comfort, aesthetics, and performance synonymous with The Great Room brand.
9. What pricing options are available for accessing the report?
Pricing options include single-user, multi-user, and enterprise licenses priced at USD 4750, USD 5250, and USD 8750 respectively.
10. Is the market size provided in terms of value or volume?
The market size is provided in terms of value, measured in Million.
11. Are there any specific market keywords associated with the report?
Yes, the market keyword associated with the report is "Shared Office Spaces Market," which aids in identifying and referencing the specific market segment covered.
12. How do I determine which pricing option suits my needs best?
The pricing options vary based on user requirements and access needs. Individual users may opt for single-user licenses, while businesses requiring broader access may choose multi-user or enterprise licenses for cost-effective access to the report.
13. Are there any additional resources or data provided in the Shared Office Spaces Market report?
While the report offers comprehensive insights, it's advisable to review the specific contents or supplementary materials provided to ascertain if additional resources or data are available.
14. How can I stay updated on further developments or reports in the Shared Office Spaces Market?
To stay informed about further developments, trends, and reports in the Shared Office Spaces Market, consider subscribing to industry newsletters, following relevant companies and organizations, or regularly checking reputable industry news sources and publications.
Methodology
Step 1 - Identification of Relevant Samples Size from Population Database


Step 2 - Approaches for Defining Global Market Size (Value, Volume* & Price*)

Note*: In applicable scenarios
Step 3 - Data Sources
Primary Research
- Web Analytics
- Survey Reports
- Research Institute
- Latest Research Reports
- Opinion Leaders
Secondary Research
- Annual Reports
- White Paper
- Latest Press Release
- Industry Association
- Paid Database
- Investor Presentations

Step 4 - Data Triangulation
Involves using different sources of information in order to increase the validity of a study
These sources are likely to be stakeholders in a program - participants, other researchers, program staff, other community members, and so on.
Then we put all data in single framework & apply various statistical tools to find out the dynamic on the market.
During the analysis stage, feedback from the stakeholder groups would be compared to determine areas of agreement as well as areas of divergence
