

Key Insights
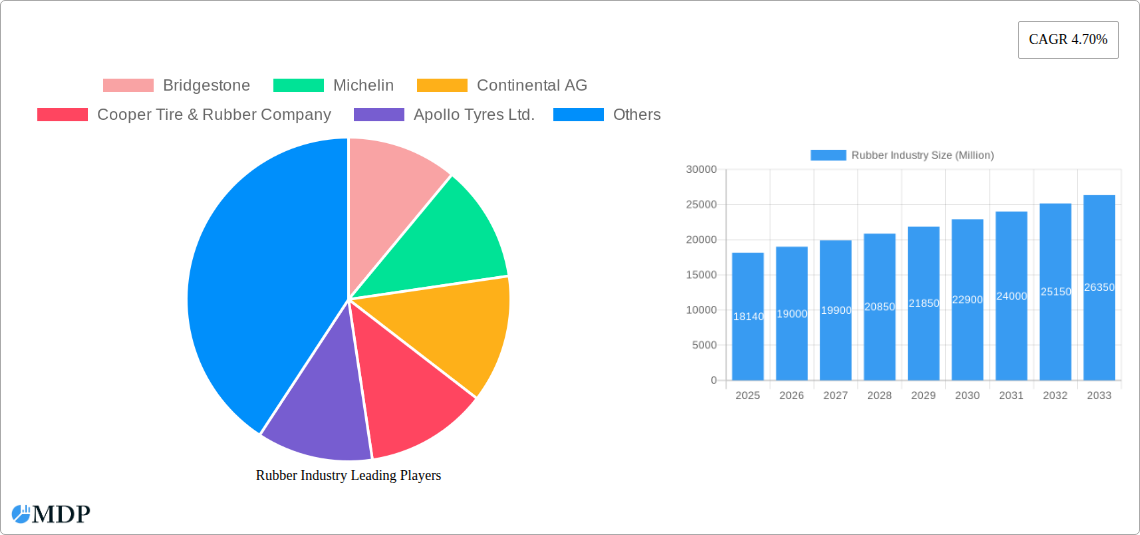
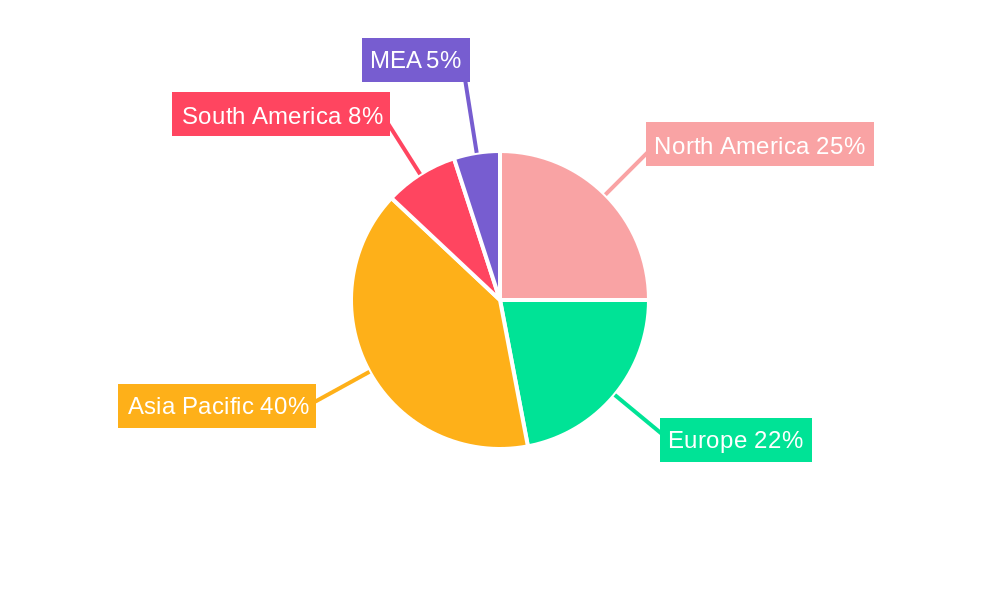
The global rubber industry, valued at $18.14 billion in 2025, is projected to experience robust growth, driven by increasing demand across diverse sectors. A compound annual growth rate (CAGR) of 4.70% from 2025 to 2033 indicates a significant expansion of the market. Key drivers include the burgeoning automotive industry, particularly the rise of electric vehicles requiring specialized rubber components, and the growth of the manufacturing and construction sectors. Advancements in material science are leading to the development of high-performance, sustainable rubber compounds, further fueling market expansion. The increasing adoption of rubber in medical devices and consumer goods also contributes to market growth. However, fluctuating raw material prices, particularly natural rubber, and environmental concerns regarding the sustainability of rubber production pose challenges to the industry's growth trajectory. The market is segmented by product type (natural rubber, synthetic rubber, specialty rubber, rubber compounds), application (automotive, industrial, medical, consumer goods), distribution channel (direct sales, distributors, retail), and end-user (automotive industry, manufacturing, healthcare, construction, consumer). The Asia-Pacific region, led by China and India, is expected to dominate the market due to robust industrialization and automotive production. North America and Europe also represent significant markets, showcasing a balanced global distribution of demand. Competition among major players like Bridgestone, Michelin, and Goodyear is fierce, with companies focusing on innovation, expansion into new markets, and strategic partnerships to maintain their market share.
The forecast period (2025-2033) promises sustained growth, influenced by technological advancements, increasing consumer spending, and infrastructure development worldwide. However, potential economic downturns and geopolitical instability could impact the market's trajectory. Companies are expected to focus on sustainable practices and the development of eco-friendly rubber alternatives to address growing environmental concerns. Diversification of product offerings and expansion into high-growth segments, such as medical and consumer goods applications, will be crucial for market success. The increasing adoption of advanced manufacturing technologies and the development of high-performance rubber compounds will play a significant role in shaping the future of the industry. Strategic mergers and acquisitions are likely to occur as companies compete for market share and seek to enhance their technological capabilities.
Rubber Industry Market Report: 2019-2033 Forecast
This comprehensive report provides an in-depth analysis of the global rubber industry, encompassing market dynamics, leading players, and future growth prospects. Covering the period 2019-2033, with a focus on 2025, this report is an essential resource for industry stakeholders, investors, and strategic decision-makers. The report leverages extensive market research to deliver actionable insights and forecasts, enabling informed strategic planning. This report is available for immediate download, requiring no further modification.
Rubber Industry Market Dynamics & Concentration
The global rubber industry, valued at $XX Million in 2024, is experiencing moderate consolidation, driven by a mix of factors. Market leaders like Bridgestone, Michelin, and Goodyear hold significant market share, exerting considerable influence on pricing and innovation. However, smaller players continue to compete fiercely, particularly in niche segments. The industry exhibits a moderately fragmented landscape, with a Herfindahl-Hirschman Index (HHI) of approximately xx, indicating moderate concentration. The automotive segment dominates, accounting for approximately 60% of total consumption, followed by the industrial sector at 25%.
Key Dynamics:
- Market Share: Bridgestone holds approximately 15% market share, followed by Michelin at 12% and Goodyear at 10%. The remaining share is distributed across numerous players.
- Innovation Drivers: The push towards sustainable materials, including bio-based rubbers and recycled rubber content, is a significant driver of innovation. Advancements in rubber compound formulations are also improving product performance and efficiency.
- Regulatory Frameworks: Stringent environmental regulations concerning tire waste and volatile organic compound emissions impact manufacturing processes and material selection, influencing the industry's growth trajectory.
- Product Substitutes: The emergence of alternative materials like plastics and composites presents a growing competitive challenge to the rubber industry, particularly in certain applications.
- M&A Activities: The period 2019-2024 witnessed approximately 15 major M&A deals within the industry, primarily focused on expanding geographic reach and product portfolios.
Rubber Industry Industry Trends & Analysis
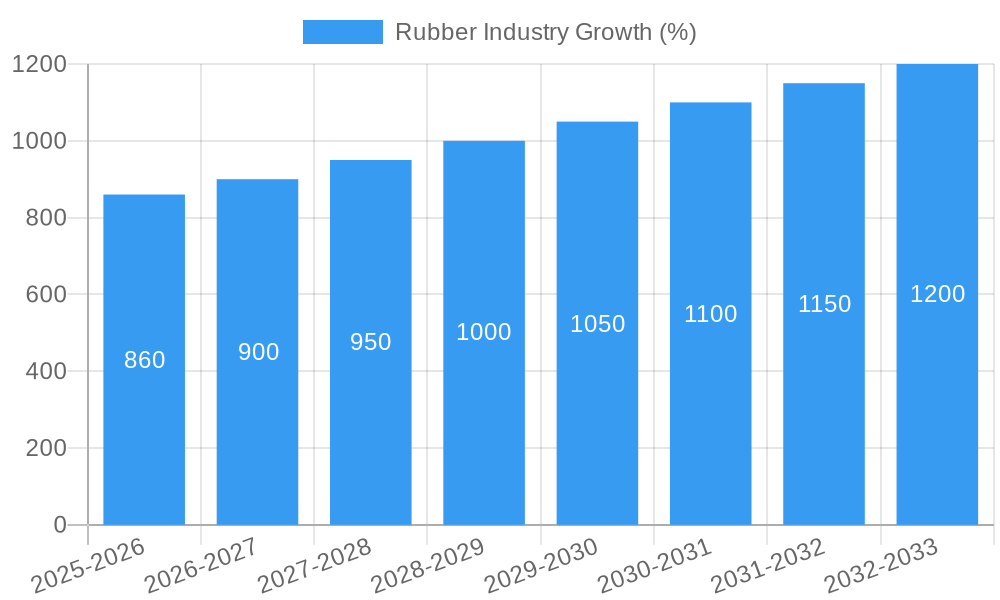
The global rubber industry is projected to witness a Compound Annual Growth Rate (CAGR) of xx% during the forecast period (2025-2033), driven by several factors. Rising global vehicle production and infrastructural development fuel demand for rubber products. Technological advancements, such as the development of high-performance rubber compounds with improved durability and fuel efficiency, are also positively influencing industry growth. Consumer preferences for sustainable and eco-friendly products are shaping the demand for bio-based rubbers and recycled rubber applications. Furthermore, increasing urbanization and industrialization in developing economies create substantial growth opportunities. The market penetration of synthetic rubbers is expected to rise by approximately xx% in the forecast period due to their versatility and cost-effectiveness. Competitive dynamics are characterized by ongoing investments in R&D, strategic partnerships, and expansion into new geographical markets.
Leading Markets & Segments in Rubber Industry
The Asia-Pacific region is the dominant market for rubber products, accounting for approximately 55% of global consumption in 2024. This dominance is largely attributed to the robust automotive and industrial sectors in countries like China and India, along with significant manufacturing activity.
Key Drivers:
- Automotive: Rapid growth in automotive production is the primary driver in Asia-Pacific.
- Industrial: Infrastructure development and industrial expansion are significantly boosting industrial rubber demand.
- Economic Policies: Government incentives and infrastructure investments in various Asian countries have positively impacted industry growth.
Dominant Segments:
- Product Type: Synthetic rubber dominates due to its versatility and cost-effectiveness.
- Application: The automotive industry accounts for the largest share of consumption, driven by tire manufacturing.
- Distribution Channel: Distributors currently dominate, owing to their established networks.
Country Dominance: China stands out as the largest consumer of rubber products globally, followed by India and Japan.
Rubber Industry Product Developments
Recent product innovations focus on improving performance characteristics such as durability, fuel efficiency, and sustainability. Advancements in polymer chemistry and compounding techniques have led to the development of high-performance rubbers with enhanced resilience and resistance to wear and tear. The increasing demand for eco-friendly products drives the development of bio-based rubbers and sustainable manufacturing processes, further enhancing the market fit of new products. These developments provide strong competitive advantages by improving product performance and addressing environmental concerns.
Key Drivers of Rubber Industry Growth
Several factors contribute to the growth of the rubber industry. Firstly, technological advancements in rubber compound formulations and manufacturing processes enable the creation of higher-performance and more sustainable products. Secondly, strong economic growth in developing countries stimulates demand for rubber in diverse applications, especially in automotive and construction. Lastly, supportive government policies, such as investments in infrastructure projects, further propel industry growth.
Challenges in the Rubber Industry Market
The rubber industry faces several challenges. Fluctuating raw material prices, particularly natural rubber, significantly impact profitability. Stringent environmental regulations regarding waste management and emissions present compliance hurdles. Intense competition from alternative materials and substitute products also poses a significant threat. These factors collectively impede industry growth and require strategic adaptations by market players.
Emerging Opportunities in Rubber Industry
The rubber industry presents significant long-term opportunities. The development of innovative bio-based rubbers offers avenues for sustainable growth, meeting rising environmental concerns. Strategic partnerships and joint ventures for research and development are expected to drive innovation and market expansion. Furthermore, the continued growth of emerging economies offers promising new markets for rubber products, expanding the overall market potential.
Leading Players in the Rubber Industry Sector
- Bridgestone
- Michelin
- Continental AG
- Cooper Tire & Rubber Company
- Apollo Tyres Ltd.
- Kumho Tire Co., Inc.
- The Goodyear Tire & Rubber Company
- Pirelli & C. S.p.A.
- Sumitomo Rubber Industries, Ltd.
- Hankook Tire & Technology
Key Milestones in Rubber Industry Industry
- 2020: Increased focus on sustainable rubber sourcing and production practices.
- 2021: Several major players announced investments in R&D for bio-based rubbers.
- 2022: Significant mergers and acquisitions aimed at consolidating market share.
- 2023: Launch of several new high-performance tire models incorporating advanced rubber compounds.
- 2024: Implementation of stricter environmental regulations in key markets.
Strategic Outlook for Rubber Industry Market
The future of the rubber industry is bright, driven by sustained growth in key end-use sectors and technological advancements. Strategic opportunities lie in developing sustainable and high-performance rubber products, focusing on niche applications, and expanding into emerging markets. Strategic partnerships and investments in R&D will be crucial for maintaining a competitive edge and capturing the expanding market potential.
Rubber Industry Segmentation
- 1. Production Analysis
- 2. Consumption Analysis
- 3. Import Market Analysis (Value & Volume)
- 4. Export Market Analysis (Value & Volume)
- 5. Price Trend Analysis
Rubber Industry Segmentation By Geography
-
1. North America
- 1.1. United States
- 1.2. Mexico
-
2. Europe
- 2.1. Germany
- 2.2. France
- 2.3. Italy
- 2.4. Turkey
-
3. Asia Pacific
- 3.1. China
- 3.2. Malaysia
- 3.3. Thailand
- 3.4. Japan
- 3.5. India
- 3.6. Indonesia
-
4. South America
- 4.1. Brazil
- 4.2. Chile
-
5. Africa
- 5.1. South Africa
Rubber Industry REPORT HIGHLIGHTS
| Aspects | Details |
|---|---|
| Study Period | 2019-2033 |
| Base Year | 2024 |
| Estimated Year | 2025 |
| Forecast Period | 2025-2033 |
| Historical Period | 2019-2024 |
| Growth Rate | CAGR of 4.70% from 2019-2033 |
| Segmentation |
|
Table of Contents
- 1. Introduction
- 1.1. Research Scope
- 1.2. Market Segmentation
- 1.3. Research Methodology
- 1.4. Definitions and Assumptions
- 2. Executive Summary
- 2.1. Introduction
- 3. Market Dynamics
- 3.1. Introduction
- 3.2. Market Drivers
- 3.2.1. Increasing Berry Consumption for Health Benefits; Increasing Adoption of High-Technology Farm Practices; Growing Usage of Berries in the Food and Beverage Industries
- 3.3. Market Restrains
- 3.3.1. High Production Cost Involved in Berry Production; Increasing Disease and Pest Infestations
- 3.4. Market Trends
- 3.4.1. Increasing demand from Various Industries
- 4. Market Factor Analysis
- 4.1. Porters Five Forces
- 4.2. Supply/Value Chain
- 4.3. PESTEL analysis
- 4.4. Market Entropy
- 4.5. Patent/Trademark Analysis
- 5. Global Rubber Industry Analysis, Insights and Forecast, 2019-2031
- 5.1. Market Analysis, Insights and Forecast - by Production Analysis
- 5.2. Market Analysis, Insights and Forecast - by Consumption Analysis
- 5.3. Market Analysis, Insights and Forecast - by Import Market Analysis (Value & Volume)
- 5.4. Market Analysis, Insights and Forecast - by Export Market Analysis (Value & Volume)
- 5.5. Market Analysis, Insights and Forecast - by Price Trend Analysis
- 5.6. Market Analysis, Insights and Forecast - by Region
- 5.6.1. North America
- 5.6.2. Europe
- 5.6.3. Asia Pacific
- 5.6.4. South America
- 5.6.5. Africa
- 5.1. Market Analysis, Insights and Forecast - by Production Analysis
- 6. North America Rubber Industry Analysis, Insights and Forecast, 2019-2031
- 6.1. Market Analysis, Insights and Forecast - by Production Analysis
- 6.2. Market Analysis, Insights and Forecast - by Consumption Analysis
- 6.3. Market Analysis, Insights and Forecast - by Import Market Analysis (Value & Volume)
- 6.4. Market Analysis, Insights and Forecast - by Export Market Analysis (Value & Volume)
- 6.5. Market Analysis, Insights and Forecast - by Price Trend Analysis
- 6.1. Market Analysis, Insights and Forecast - by Production Analysis
- 7. Europe Rubber Industry Analysis, Insights and Forecast, 2019-2031
- 7.1. Market Analysis, Insights and Forecast - by Production Analysis
- 7.2. Market Analysis, Insights and Forecast - by Consumption Analysis
- 7.3. Market Analysis, Insights and Forecast - by Import Market Analysis (Value & Volume)
- 7.4. Market Analysis, Insights and Forecast - by Export Market Analysis (Value & Volume)
- 7.5. Market Analysis, Insights and Forecast - by Price Trend Analysis
- 7.1. Market Analysis, Insights and Forecast - by Production Analysis
- 8. Asia Pacific Rubber Industry Analysis, Insights and Forecast, 2019-2031
- 8.1. Market Analysis, Insights and Forecast - by Production Analysis
- 8.2. Market Analysis, Insights and Forecast - by Consumption Analysis
- 8.3. Market Analysis, Insights and Forecast - by Import Market Analysis (Value & Volume)
- 8.4. Market Analysis, Insights and Forecast - by Export Market Analysis (Value & Volume)
- 8.5. Market Analysis, Insights and Forecast - by Price Trend Analysis
- 8.1. Market Analysis, Insights and Forecast - by Production Analysis
- 9. South America Rubber Industry Analysis, Insights and Forecast, 2019-2031
- 9.1. Market Analysis, Insights and Forecast - by Production Analysis
- 9.2. Market Analysis, Insights and Forecast - by Consumption Analysis
- 9.3. Market Analysis, Insights and Forecast - by Import Market Analysis (Value & Volume)
- 9.4. Market Analysis, Insights and Forecast - by Export Market Analysis (Value & Volume)
- 9.5. Market Analysis, Insights and Forecast - by Price Trend Analysis
- 9.1. Market Analysis, Insights and Forecast - by Production Analysis
- 10. Africa Rubber Industry Analysis, Insights and Forecast, 2019-2031
- 10.1. Market Analysis, Insights and Forecast - by Production Analysis
- 10.2. Market Analysis, Insights and Forecast - by Consumption Analysis
- 10.3. Market Analysis, Insights and Forecast - by Import Market Analysis (Value & Volume)
- 10.4. Market Analysis, Insights and Forecast - by Export Market Analysis (Value & Volume)
- 10.5. Market Analysis, Insights and Forecast - by Price Trend Analysis
- 10.1. Market Analysis, Insights and Forecast - by Production Analysis
- 11. North America Rubber Industry Analysis, Insights and Forecast, 2019-2031
- 11.1. Market Analysis, Insights and Forecast - By Country/Sub-region
- 11.1.1 United States
- 11.1.2 Canada
- 11.1.3 Mexico
- 12. Europe Rubber Industry Analysis, Insights and Forecast, 2019-2031
- 12.1. Market Analysis, Insights and Forecast - By Country/Sub-region
- 12.1.1 Germany
- 12.1.2 United Kingdom
- 12.1.3 France
- 12.1.4 Spain
- 12.1.5 Italy
- 12.1.6 Spain
- 12.1.7 Belgium
- 12.1.8 Netherland
- 12.1.9 Nordics
- 12.1.10 Rest of Europe
- 13. Asia Pacific Rubber Industry Analysis, Insights and Forecast, 2019-2031
- 13.1. Market Analysis, Insights and Forecast - By Country/Sub-region
- 13.1.1 China
- 13.1.2 Japan
- 13.1.3 India
- 13.1.4 South Korea
- 13.1.5 Southeast Asia
- 13.1.6 Australia
- 13.1.7 Indonesia
- 13.1.8 Phillipes
- 13.1.9 Singapore
- 13.1.10 Thailandc
- 13.1.11 Rest of Asia Pacific
- 14. South America Rubber Industry Analysis, Insights and Forecast, 2019-2031
- 14.1. Market Analysis, Insights and Forecast - By Country/Sub-region
- 14.1.1 Brazil
- 14.1.2 Argentina
- 14.1.3 Peru
- 14.1.4 Chile
- 14.1.5 Colombia
- 14.1.6 Ecuador
- 14.1.7 Venezuela
- 14.1.8 Rest of South America
- 15. MEA Rubber Industry Analysis, Insights and Forecast, 2019-2031
- 15.1. Market Analysis, Insights and Forecast - By Country/Sub-region
- 15.1.1 United Arab Emirates
- 15.1.2 Saudi Arabia
- 15.1.3 South Africa
- 15.1.4 Rest of Middle East and Africa
- 16. Competitive Analysis
- 16.1. Global Market Share Analysis 2024
- 16.2. Company Profiles
- 16.2.1 Bridgestone
- 16.2.1.1. Overview
- 16.2.1.2. Products
- 16.2.1.3. SWOT Analysis
- 16.2.1.4. Recent Developments
- 16.2.1.5. Financials (Based on Availability)
- 16.2.2 Michelin
- 16.2.2.1. Overview
- 16.2.2.2. Products
- 16.2.2.3. SWOT Analysis
- 16.2.2.4. Recent Developments
- 16.2.2.5. Financials (Based on Availability)
- 16.2.3 Continental AG
- 16.2.3.1. Overview
- 16.2.3.2. Products
- 16.2.3.3. SWOT Analysis
- 16.2.3.4. Recent Developments
- 16.2.3.5. Financials (Based on Availability)
- 16.2.4 Cooper Tire & Rubber Company
- 16.2.4.1. Overview
- 16.2.4.2. Products
- 16.2.4.3. SWOT Analysis
- 16.2.4.4. Recent Developments
- 16.2.4.5. Financials (Based on Availability)
- 16.2.5 Apollo Tyres Ltd.
- 16.2.5.1. Overview
- 16.2.5.2. Products
- 16.2.5.3. SWOT Analysis
- 16.2.5.4. Recent Developments
- 16.2.5.5. Financials (Based on Availability)
- 16.2.6 Kumho Tire Co. Inc.
- 16.2.6.1. Overview
- 16.2.6.2. Products
- 16.2.6.3. SWOT Analysis
- 16.2.6.4. Recent Developments
- 16.2.6.5. Financials (Based on Availability)
- 16.2.7 The Goodyear Tire & Rubber Company
- 16.2.7.1. Overview
- 16.2.7.2. Products
- 16.2.7.3. SWOT Analysis
- 16.2.7.4. Recent Developments
- 16.2.7.5. Financials (Based on Availability)
- 16.2.8 Pirelli & C. S.p.A.
- 16.2.8.1. Overview
- 16.2.8.2. Products
- 16.2.8.3. SWOT Analysis
- 16.2.8.4. Recent Developments
- 16.2.8.5. Financials (Based on Availability)
- 16.2.9 Sumitomo Rubber Industries Ltd.
- 16.2.9.1. Overview
- 16.2.9.2. Products
- 16.2.9.3. SWOT Analysis
- 16.2.9.4. Recent Developments
- 16.2.9.5. Financials (Based on Availability)
- 16.2.10 Hankook Tire & Technology
- 16.2.10.1. Overview
- 16.2.10.2. Products
- 16.2.10.3. SWOT Analysis
- 16.2.10.4. Recent Developments
- 16.2.10.5. Financials (Based on Availability)
- 16.2.1 Bridgestone
List of Figures
- Figure 1: Global Rubber Industry Revenue Breakdown (Million, %) by Region 2024 & 2032
- Figure 2: North America Rubber Industry Revenue (Million), by Country 2024 & 2032
- Figure 3: North America Rubber Industry Revenue Share (%), by Country 2024 & 2032
- Figure 4: Europe Rubber Industry Revenue (Million), by Country 2024 & 2032
- Figure 5: Europe Rubber Industry Revenue Share (%), by Country 2024 & 2032
- Figure 6: Asia Pacific Rubber Industry Revenue (Million), by Country 2024 & 2032
- Figure 7: Asia Pacific Rubber Industry Revenue Share (%), by Country 2024 & 2032
- Figure 8: South America Rubber Industry Revenue (Million), by Country 2024 & 2032
- Figure 9: South America Rubber Industry Revenue Share (%), by Country 2024 & 2032
- Figure 10: MEA Rubber Industry Revenue (Million), by Country 2024 & 2032
- Figure 11: MEA Rubber Industry Revenue Share (%), by Country 2024 & 2032
- Figure 12: North America Rubber Industry Revenue (Million), by Production Analysis 2024 & 2032
- Figure 13: North America Rubber Industry Revenue Share (%), by Production Analysis 2024 & 2032
- Figure 14: North America Rubber Industry Revenue (Million), by Consumption Analysis 2024 & 2032
- Figure 15: North America Rubber Industry Revenue Share (%), by Consumption Analysis 2024 & 2032
- Figure 16: North America Rubber Industry Revenue (Million), by Import Market Analysis (Value & Volume) 2024 & 2032
- Figure 17: North America Rubber Industry Revenue Share (%), by Import Market Analysis (Value & Volume) 2024 & 2032
- Figure 18: North America Rubber Industry Revenue (Million), by Export Market Analysis (Value & Volume) 2024 & 2032
- Figure 19: North America Rubber Industry Revenue Share (%), by Export Market Analysis (Value & Volume) 2024 & 2032
- Figure 20: North America Rubber Industry Revenue (Million), by Price Trend Analysis 2024 & 2032
- Figure 21: North America Rubber Industry Revenue Share (%), by Price Trend Analysis 2024 & 2032
- Figure 22: North America Rubber Industry Revenue (Million), by Country 2024 & 2032
- Figure 23: North America Rubber Industry Revenue Share (%), by Country 2024 & 2032
- Figure 24: Europe Rubber Industry Revenue (Million), by Production Analysis 2024 & 2032
- Figure 25: Europe Rubber Industry Revenue Share (%), by Production Analysis 2024 & 2032
- Figure 26: Europe Rubber Industry Revenue (Million), by Consumption Analysis 2024 & 2032
- Figure 27: Europe Rubber Industry Revenue Share (%), by Consumption Analysis 2024 & 2032
- Figure 28: Europe Rubber Industry Revenue (Million), by Import Market Analysis (Value & Volume) 2024 & 2032
- Figure 29: Europe Rubber Industry Revenue Share (%), by Import Market Analysis (Value & Volume) 2024 & 2032
- Figure 30: Europe Rubber Industry Revenue (Million), by Export Market Analysis (Value & Volume) 2024 & 2032
- Figure 31: Europe Rubber Industry Revenue Share (%), by Export Market Analysis (Value & Volume) 2024 & 2032
- Figure 32: Europe Rubber Industry Revenue (Million), by Price Trend Analysis 2024 & 2032
- Figure 33: Europe Rubber Industry Revenue Share (%), by Price Trend Analysis 2024 & 2032
- Figure 34: Europe Rubber Industry Revenue (Million), by Country 2024 & 2032
- Figure 35: Europe Rubber Industry Revenue Share (%), by Country 2024 & 2032
- Figure 36: Asia Pacific Rubber Industry Revenue (Million), by Production Analysis 2024 & 2032
- Figure 37: Asia Pacific Rubber Industry Revenue Share (%), by Production Analysis 2024 & 2032
- Figure 38: Asia Pacific Rubber Industry Revenue (Million), by Consumption Analysis 2024 & 2032
- Figure 39: Asia Pacific Rubber Industry Revenue Share (%), by Consumption Analysis 2024 & 2032
- Figure 40: Asia Pacific Rubber Industry Revenue (Million), by Import Market Analysis (Value & Volume) 2024 & 2032
- Figure 41: Asia Pacific Rubber Industry Revenue Share (%), by Import Market Analysis (Value & Volume) 2024 & 2032
- Figure 42: Asia Pacific Rubber Industry Revenue (Million), by Export Market Analysis (Value & Volume) 2024 & 2032
- Figure 43: Asia Pacific Rubber Industry Revenue Share (%), by Export Market Analysis (Value & Volume) 2024 & 2032
- Figure 44: Asia Pacific Rubber Industry Revenue (Million), by Price Trend Analysis 2024 & 2032
- Figure 45: Asia Pacific Rubber Industry Revenue Share (%), by Price Trend Analysis 2024 & 2032
- Figure 46: Asia Pacific Rubber Industry Revenue (Million), by Country 2024 & 2032
- Figure 47: Asia Pacific Rubber Industry Revenue Share (%), by Country 2024 & 2032
- Figure 48: South America Rubber Industry Revenue (Million), by Production Analysis 2024 & 2032
- Figure 49: South America Rubber Industry Revenue Share (%), by Production Analysis 2024 & 2032
- Figure 50: South America Rubber Industry Revenue (Million), by Consumption Analysis 2024 & 2032
- Figure 51: South America Rubber Industry Revenue Share (%), by Consumption Analysis 2024 & 2032
- Figure 52: South America Rubber Industry Revenue (Million), by Import Market Analysis (Value & Volume) 2024 & 2032
- Figure 53: South America Rubber Industry Revenue Share (%), by Import Market Analysis (Value & Volume) 2024 & 2032
- Figure 54: South America Rubber Industry Revenue (Million), by Export Market Analysis (Value & Volume) 2024 & 2032
- Figure 55: South America Rubber Industry Revenue Share (%), by Export Market Analysis (Value & Volume) 2024 & 2032
- Figure 56: South America Rubber Industry Revenue (Million), by Price Trend Analysis 2024 & 2032
- Figure 57: South America Rubber Industry Revenue Share (%), by Price Trend Analysis 2024 & 2032
- Figure 58: South America Rubber Industry Revenue (Million), by Country 2024 & 2032
- Figure 59: South America Rubber Industry Revenue Share (%), by Country 2024 & 2032
- Figure 60: Africa Rubber Industry Revenue (Million), by Production Analysis 2024 & 2032
- Figure 61: Africa Rubber Industry Revenue Share (%), by Production Analysis 2024 & 2032
- Figure 62: Africa Rubber Industry Revenue (Million), by Consumption Analysis 2024 & 2032
- Figure 63: Africa Rubber Industry Revenue Share (%), by Consumption Analysis 2024 & 2032
- Figure 64: Africa Rubber Industry Revenue (Million), by Import Market Analysis (Value & Volume) 2024 & 2032
- Figure 65: Africa Rubber Industry Revenue Share (%), by Import Market Analysis (Value & Volume) 2024 & 2032
- Figure 66: Africa Rubber Industry Revenue (Million), by Export Market Analysis (Value & Volume) 2024 & 2032
- Figure 67: Africa Rubber Industry Revenue Share (%), by Export Market Analysis (Value & Volume) 2024 & 2032
- Figure 68: Africa Rubber Industry Revenue (Million), by Price Trend Analysis 2024 & 2032
- Figure 69: Africa Rubber Industry Revenue Share (%), by Price Trend Analysis 2024 & 2032
- Figure 70: Africa Rubber Industry Revenue (Million), by Country 2024 & 2032
- Figure 71: Africa Rubber Industry Revenue Share (%), by Country 2024 & 2032
List of Tables
- Table 1: Global Rubber Industry Revenue Million Forecast, by Region 2019 & 2032
- Table 2: Global Rubber Industry Revenue Million Forecast, by Production Analysis 2019 & 2032
- Table 3: Global Rubber Industry Revenue Million Forecast, by Consumption Analysis 2019 & 2032
- Table 4: Global Rubber Industry Revenue Million Forecast, by Import Market Analysis (Value & Volume) 2019 & 2032
- Table 5: Global Rubber Industry Revenue Million Forecast, by Export Market Analysis (Value & Volume) 2019 & 2032
- Table 6: Global Rubber Industry Revenue Million Forecast, by Price Trend Analysis 2019 & 2032
- Table 7: Global Rubber Industry Revenue Million Forecast, by Region 2019 & 2032
- Table 8: Global Rubber Industry Revenue Million Forecast, by Country 2019 & 2032
- Table 9: United States Rubber Industry Revenue (Million) Forecast, by Application 2019 & 2032
- Table 10: Canada Rubber Industry Revenue (Million) Forecast, by Application 2019 & 2032
- Table 11: Mexico Rubber Industry Revenue (Million) Forecast, by Application 2019 & 2032
- Table 12: Global Rubber Industry Revenue Million Forecast, by Country 2019 & 2032
- Table 13: Germany Rubber Industry Revenue (Million) Forecast, by Application 2019 & 2032
- Table 14: United Kingdom Rubber Industry Revenue (Million) Forecast, by Application 2019 & 2032
- Table 15: France Rubber Industry Revenue (Million) Forecast, by Application 2019 & 2032
- Table 16: Spain Rubber Industry Revenue (Million) Forecast, by Application 2019 & 2032
- Table 17: Italy Rubber Industry Revenue (Million) Forecast, by Application 2019 & 2032
- Table 18: Spain Rubber Industry Revenue (Million) Forecast, by Application 2019 & 2032
- Table 19: Belgium Rubber Industry Revenue (Million) Forecast, by Application 2019 & 2032
- Table 20: Netherland Rubber Industry Revenue (Million) Forecast, by Application 2019 & 2032
- Table 21: Nordics Rubber Industry Revenue (Million) Forecast, by Application 2019 & 2032
- Table 22: Rest of Europe Rubber Industry Revenue (Million) Forecast, by Application 2019 & 2032
- Table 23: Global Rubber Industry Revenue Million Forecast, by Country 2019 & 2032
- Table 24: China Rubber Industry Revenue (Million) Forecast, by Application 2019 & 2032
- Table 25: Japan Rubber Industry Revenue (Million) Forecast, by Application 2019 & 2032
- Table 26: India Rubber Industry Revenue (Million) Forecast, by Application 2019 & 2032
- Table 27: South Korea Rubber Industry Revenue (Million) Forecast, by Application 2019 & 2032
- Table 28: Southeast Asia Rubber Industry Revenue (Million) Forecast, by Application 2019 & 2032
- Table 29: Australia Rubber Industry Revenue (Million) Forecast, by Application 2019 & 2032
- Table 30: Indonesia Rubber Industry Revenue (Million) Forecast, by Application 2019 & 2032
- Table 31: Phillipes Rubber Industry Revenue (Million) Forecast, by Application 2019 & 2032
- Table 32: Singapore Rubber Industry Revenue (Million) Forecast, by Application 2019 & 2032
- Table 33: Thailandc Rubber Industry Revenue (Million) Forecast, by Application 2019 & 2032
- Table 34: Rest of Asia Pacific Rubber Industry Revenue (Million) Forecast, by Application 2019 & 2032
- Table 35: Global Rubber Industry Revenue Million Forecast, by Country 2019 & 2032
- Table 36: Brazil Rubber Industry Revenue (Million) Forecast, by Application 2019 & 2032
- Table 37: Argentina Rubber Industry Revenue (Million) Forecast, by Application 2019 & 2032
- Table 38: Peru Rubber Industry Revenue (Million) Forecast, by Application 2019 & 2032
- Table 39: Chile Rubber Industry Revenue (Million) Forecast, by Application 2019 & 2032
- Table 40: Colombia Rubber Industry Revenue (Million) Forecast, by Application 2019 & 2032
- Table 41: Ecuador Rubber Industry Revenue (Million) Forecast, by Application 2019 & 2032
- Table 42: Venezuela Rubber Industry Revenue (Million) Forecast, by Application 2019 & 2032
- Table 43: Rest of South America Rubber Industry Revenue (Million) Forecast, by Application 2019 & 2032
- Table 44: Global Rubber Industry Revenue Million Forecast, by Country 2019 & 2032
- Table 45: United Arab Emirates Rubber Industry Revenue (Million) Forecast, by Application 2019 & 2032
- Table 46: Saudi Arabia Rubber Industry Revenue (Million) Forecast, by Application 2019 & 2032
- Table 47: South Africa Rubber Industry Revenue (Million) Forecast, by Application 2019 & 2032
- Table 48: Rest of Middle East and Africa Rubber Industry Revenue (Million) Forecast, by Application 2019 & 2032
- Table 49: Global Rubber Industry Revenue Million Forecast, by Production Analysis 2019 & 2032
- Table 50: Global Rubber Industry Revenue Million Forecast, by Consumption Analysis 2019 & 2032
- Table 51: Global Rubber Industry Revenue Million Forecast, by Import Market Analysis (Value & Volume) 2019 & 2032
- Table 52: Global Rubber Industry Revenue Million Forecast, by Export Market Analysis (Value & Volume) 2019 & 2032
- Table 53: Global Rubber Industry Revenue Million Forecast, by Price Trend Analysis 2019 & 2032
- Table 54: Global Rubber Industry Revenue Million Forecast, by Country 2019 & 2032
- Table 55: United States Rubber Industry Revenue (Million) Forecast, by Application 2019 & 2032
- Table 56: Mexico Rubber Industry Revenue (Million) Forecast, by Application 2019 & 2032
- Table 57: Global Rubber Industry Revenue Million Forecast, by Production Analysis 2019 & 2032
- Table 58: Global Rubber Industry Revenue Million Forecast, by Consumption Analysis 2019 & 2032
- Table 59: Global Rubber Industry Revenue Million Forecast, by Import Market Analysis (Value & Volume) 2019 & 2032
- Table 60: Global Rubber Industry Revenue Million Forecast, by Export Market Analysis (Value & Volume) 2019 & 2032
- Table 61: Global Rubber Industry Revenue Million Forecast, by Price Trend Analysis 2019 & 2032
- Table 62: Global Rubber Industry Revenue Million Forecast, by Country 2019 & 2032
- Table 63: Germany Rubber Industry Revenue (Million) Forecast, by Application 2019 & 2032
- Table 64: France Rubber Industry Revenue (Million) Forecast, by Application 2019 & 2032
- Table 65: Italy Rubber Industry Revenue (Million) Forecast, by Application 2019 & 2032
- Table 66: Turkey Rubber Industry Revenue (Million) Forecast, by Application 2019 & 2032
- Table 67: Global Rubber Industry Revenue Million Forecast, by Production Analysis 2019 & 2032
- Table 68: Global Rubber Industry Revenue Million Forecast, by Consumption Analysis 2019 & 2032
- Table 69: Global Rubber Industry Revenue Million Forecast, by Import Market Analysis (Value & Volume) 2019 & 2032
- Table 70: Global Rubber Industry Revenue Million Forecast, by Export Market Analysis (Value & Volume) 2019 & 2032
- Table 71: Global Rubber Industry Revenue Million Forecast, by Price Trend Analysis 2019 & 2032
- Table 72: Global Rubber Industry Revenue Million Forecast, by Country 2019 & 2032
- Table 73: China Rubber Industry Revenue (Million) Forecast, by Application 2019 & 2032
- Table 74: Malaysia Rubber Industry Revenue (Million) Forecast, by Application 2019 & 2032
- Table 75: Thailand Rubber Industry Revenue (Million) Forecast, by Application 2019 & 2032
- Table 76: Japan Rubber Industry Revenue (Million) Forecast, by Application 2019 & 2032
- Table 77: India Rubber Industry Revenue (Million) Forecast, by Application 2019 & 2032
- Table 78: Indonesia Rubber Industry Revenue (Million) Forecast, by Application 2019 & 2032
- Table 79: Global Rubber Industry Revenue Million Forecast, by Production Analysis 2019 & 2032
- Table 80: Global Rubber Industry Revenue Million Forecast, by Consumption Analysis 2019 & 2032
- Table 81: Global Rubber Industry Revenue Million Forecast, by Import Market Analysis (Value & Volume) 2019 & 2032
- Table 82: Global Rubber Industry Revenue Million Forecast, by Export Market Analysis (Value & Volume) 2019 & 2032
- Table 83: Global Rubber Industry Revenue Million Forecast, by Price Trend Analysis 2019 & 2032
- Table 84: Global Rubber Industry Revenue Million Forecast, by Country 2019 & 2032
- Table 85: Brazil Rubber Industry Revenue (Million) Forecast, by Application 2019 & 2032
- Table 86: Chile Rubber Industry Revenue (Million) Forecast, by Application 2019 & 2032
- Table 87: Global Rubber Industry Revenue Million Forecast, by Production Analysis 2019 & 2032
- Table 88: Global Rubber Industry Revenue Million Forecast, by Consumption Analysis 2019 & 2032
- Table 89: Global Rubber Industry Revenue Million Forecast, by Import Market Analysis (Value & Volume) 2019 & 2032
- Table 90: Global Rubber Industry Revenue Million Forecast, by Export Market Analysis (Value & Volume) 2019 & 2032
- Table 91: Global Rubber Industry Revenue Million Forecast, by Price Trend Analysis 2019 & 2032
- Table 92: Global Rubber Industry Revenue Million Forecast, by Country 2019 & 2032
- Table 93: South Africa Rubber Industry Revenue (Million) Forecast, by Application 2019 & 2032
Frequently Asked Questions
1. What is the projected Compound Annual Growth Rate (CAGR) of the Rubber Industry?
The projected CAGR is approximately 4.70%.
2. Which companies are prominent players in the Rubber Industry?
Key companies in the market include Bridgestone , Michelin , Continental AG , Cooper Tire & Rubber Company , Apollo Tyres Ltd. , Kumho Tire Co., Inc., The Goodyear Tire & Rubber Company , Pirelli & C. S.p.A. , Sumitomo Rubber Industries, Ltd. , Hankook Tire & Technology.
3. What are the main segments of the Rubber Industry?
The market segments include Production Analysis, Consumption Analysis, Import Market Analysis (Value & Volume), Export Market Analysis (Value & Volume), Price Trend Analysis.
4. Can you provide details about the market size?
The market size is estimated to be USD 18.14 Million as of 2022.
5. What are some drivers contributing to market growth?
Increasing Berry Consumption for Health Benefits; Increasing Adoption of High-Technology Farm Practices; Growing Usage of Berries in the Food and Beverage Industries.
6. What are the notable trends driving market growth?
Increasing demand from Various Industries.
7. Are there any restraints impacting market growth?
High Production Cost Involved in Berry Production; Increasing Disease and Pest Infestations.
8. Can you provide examples of recent developments in the market?
N/A
9. What pricing options are available for accessing the report?
Pricing options include single-user, multi-user, and enterprise licenses priced at USD 4750, USD 5250, and USD 8750 respectively.
10. Is the market size provided in terms of value or volume?
The market size is provided in terms of value, measured in Million.
11. Are there any specific market keywords associated with the report?
Yes, the market keyword associated with the report is "Rubber Industry," which aids in identifying and referencing the specific market segment covered.
12. How do I determine which pricing option suits my needs best?
The pricing options vary based on user requirements and access needs. Individual users may opt for single-user licenses, while businesses requiring broader access may choose multi-user or enterprise licenses for cost-effective access to the report.
13. Are there any additional resources or data provided in the Rubber Industry report?
While the report offers comprehensive insights, it's advisable to review the specific contents or supplementary materials provided to ascertain if additional resources or data are available.
14. How can I stay updated on further developments or reports in the Rubber Industry?
To stay informed about further developments, trends, and reports in the Rubber Industry, consider subscribing to industry newsletters, following relevant companies and organizations, or regularly checking reputable industry news sources and publications.
Methodology
Step 1 - Identification of Relevant Samples Size from Population Database


Step 2 - Approaches for Defining Global Market Size (Value, Volume* & Price*)

Note*: In applicable scenarios
Step 3 - Data Sources
Primary Research
- Web Analytics
- Survey Reports
- Research Institute
- Latest Research Reports
- Opinion Leaders
Secondary Research
- Annual Reports
- White Paper
- Latest Press Release
- Industry Association
- Paid Database
- Investor Presentations

Step 4 - Data Triangulation
Involves using different sources of information in order to increase the validity of a study
These sources are likely to be stakeholders in a program - participants, other researchers, program staff, other community members, and so on.
Then we put all data in single framework & apply various statistical tools to find out the dynamic on the market.
During the analysis stage, feedback from the stakeholder groups would be compared to determine areas of agreement as well as areas of divergence
