

Key Insights
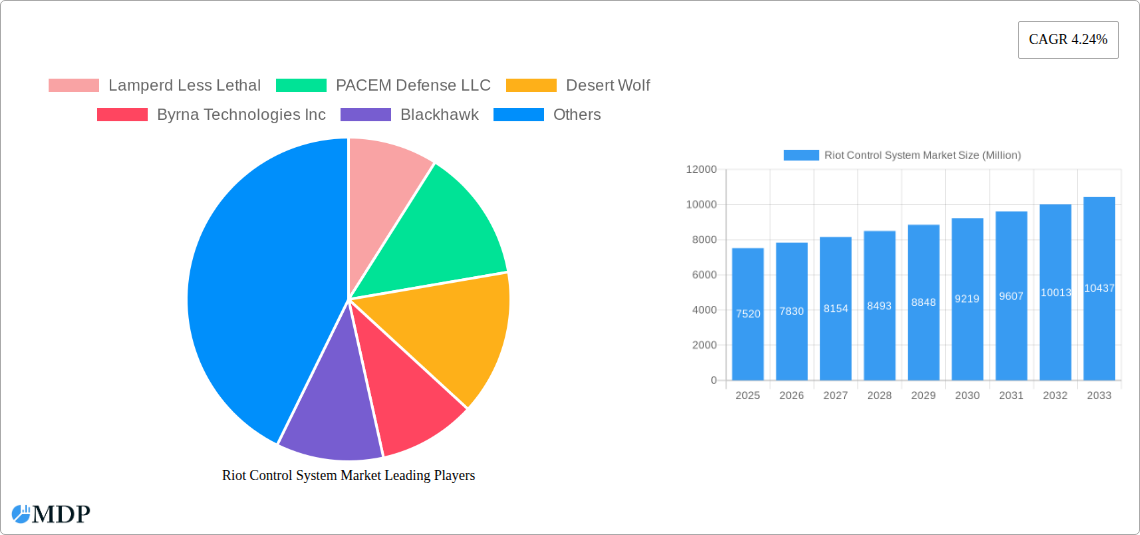
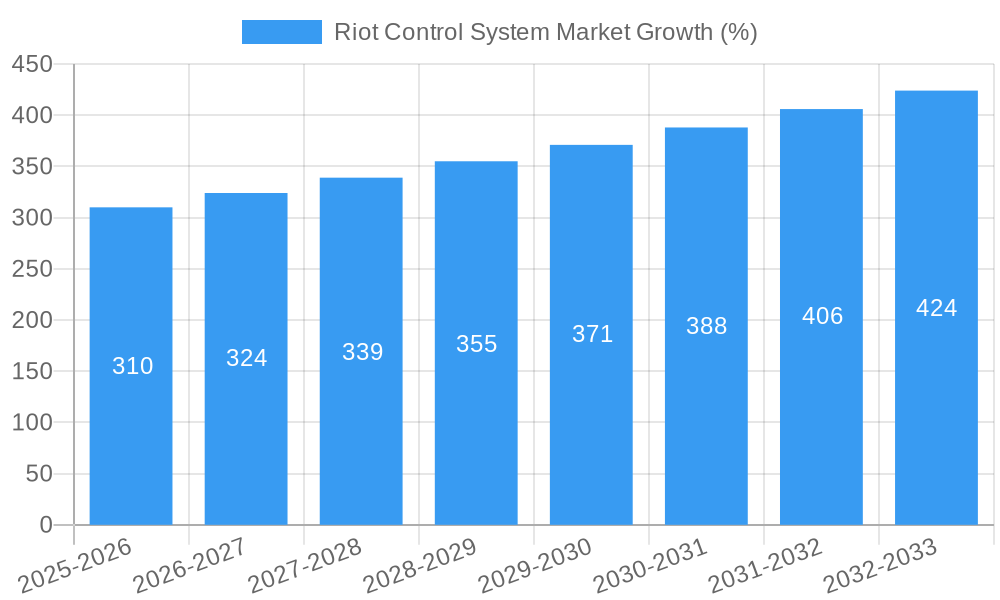
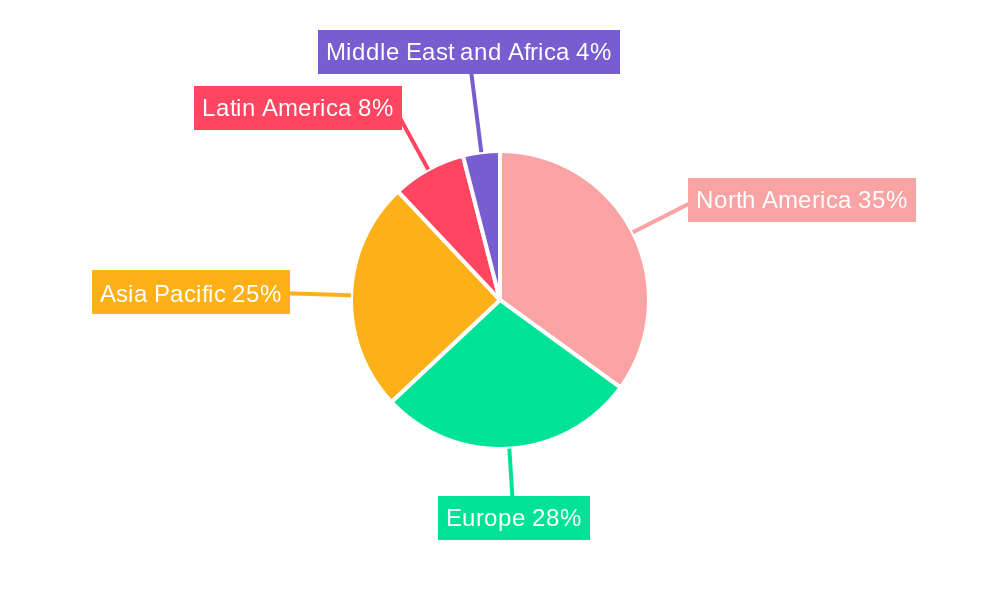
The global riot control systems market, valued at $7.52 billion in 2025, is projected to experience steady growth, driven by a compound annual growth rate (CAGR) of 4.24% from 2025 to 2033. This growth is fueled by several key factors. Increasing instances of civil unrest and social protests worldwide necessitate the adoption of effective and non-lethal riot control measures by law enforcement and military agencies. Furthermore, technological advancements in less-lethal weaponry, such as improved accuracy and reduced collateral damage potential in ammunition types (like rubber bullets and sponge grenades), are driving market expansion. The demand for sophisticated training programs and equipment upgrades within specialized units like SWAT teams and special forces further contribute to market growth. Regional variations exist, with North America and Europe currently holding significant market shares due to higher spending on security and well-established law enforcement infrastructure. However, growing urbanization and increasing political instability in regions like Asia-Pacific and the Middle East and Africa are expected to fuel substantial market growth in these areas over the forecast period.
The market segmentation reveals significant opportunities across various product types. Personal protective equipment (PPE) for law enforcement personnel remains a substantial segment, alongside a growing demand for advanced area denial systems (anti-vehicle and anti-personnel). The ammunition segment, encompassing a range of less-lethal options from rubber bullets to sponge grenades, is a key driver, with a focus on enhancing effectiveness while minimizing injury. Similarly, the adoption of gas and spray-based riot control systems continues, albeit with growing scrutiny regarding potential health impacts and evolving regulations. The increasing adoption of body cameras and improved data analysis technology by law enforcement agencies adds another dimension to market growth, enhancing accountability and situational awareness during crowd control operations. Competitive landscape analysis indicates the presence of both established and emerging players, driving innovation and competitive pricing in this crucial market.
Riot Control System Market: A Comprehensive Report (2019-2033)
This in-depth report provides a comprehensive analysis of the Riot Control System Market, covering market dynamics, industry trends, leading segments, key players, and future outlook. The study period spans from 2019 to 2033, with a base year of 2025 and a forecast period of 2025-2033. This report is essential for stakeholders seeking actionable insights and strategic planning within this crucial sector.
Riot Control System Market Market Dynamics & Concentration
The global Riot Control System market, valued at xx Million in 2024, is projected to reach xx Million by 2033, exhibiting a CAGR of xx% during the forecast period. Market concentration is moderately high, with several key players holding significant market share. Innovation is a key driver, with continuous advancements in non-lethal weaponry and crowd control technologies. Stringent regulatory frameworks governing the use and sale of riot control equipment significantly influence market dynamics. The market experiences competitive pressure from substitute products, such as advanced surveillance technologies and less lethal alternatives. End-user trends, particularly towards non-lethal solutions and improved officer safety, are shaping demand. M&A activity in the sector is moderate, with an estimated xx number of deals recorded between 2019 and 2024, indicating consolidation and strategic growth among key players.
- Market Share: Top 5 players account for approximately xx% of the market.
- M&A Activity: An average of xx M&A deals per year were observed during the historical period.
- Regulatory Landscape: Varying regulations across different geographies impact market access and product adoption.
Riot Control System Market Industry Trends & Analysis
The Riot Control System market is experiencing significant growth driven by factors such as escalating global unrest, increasing demand for public safety, and technological advancements in non-lethal weaponry. The market penetration of advanced technologies, such as drone-based tear gas deployment systems, is rising rapidly. Consumer preference for non-lethal and less harmful options is growing, prompting manufacturers to innovate in this area. Competitive dynamics are intense, with companies focused on product differentiation, technological superiority, and strategic partnerships. The market is segmented by product type, including personal protective equipment, shields, area denial systems, ammunition, explosives, and gases and sprays. The CAGR for the overall market is projected to be xx% during the forecast period. Technological disruptions, including AI-powered crowd monitoring and predictive policing systems, are altering the landscape and influencing market growth.
Leading Markets & Segments in Riot Control System Market
North America currently dominates the Riot Control System market, driven by high public safety budgets and a robust law enforcement infrastructure. Europe holds a significant share, while the Asia-Pacific region is expected to experience the highest growth rate during the forecast period due to increasing urbanization and political instability. Within the product segments, Personal Protective Equipment and Ammunition (including Rubber Bullets, Bean Bag Rounds, etc.) represent the largest segments in terms of revenue generation.
Key Drivers:
- North America: High government spending on security and robust law enforcement.
- Europe: Stringent regulations and a focus on non-lethal solutions.
- Asia-Pacific: Rapid urbanization, political instability, and increasing demand for public safety.
Dominance Analysis: North America's dominance is attributed to higher per capita spending on security, advanced technological adoption, and a strong established law enforcement infrastructure. Asia-Pacific's emerging market status is fueled by a growing demand for public safety measures coupled with increasing government investments.
Riot Control System Market Product Developments
Recent product innovations focus on enhancing officer safety, minimizing collateral damage, and improving the effectiveness of riot control operations. This includes the development of more precise and targeted non-lethal weapons, advanced protective gear, and intelligent systems for crowd monitoring and management. The market is witnessing an increasing integration of technology, including AI and robotics, for improved situational awareness and operational efficiency. This trend aligns with the market need for safer and more effective crowd control solutions.
Key Drivers of Riot Control System Market Growth
Several factors are driving the growth of the Riot Control System market, including:
- Technological advancements: Development of more effective and less lethal weaponry.
- Increased global unrest: Political instability and social unrest are leading to a greater demand for riot control equipment.
- Government investment: Increased spending on public safety and law enforcement by various governments.
- Stringent regulations: The need for enhanced safety and improved operational efficiency.
Challenges in the Riot Control System Market Market
The market faces several challenges, including:
- Stringent regulations and ethical concerns: Restrictions on the use of certain weapons and the potential for misuse.
- Supply chain disruptions: Global events can impact the availability of raw materials and components.
- High initial investment costs: Advanced riot control systems can be expensive to procure and maintain.
Emerging Opportunities in Riot Control System Market
The market presents significant opportunities for growth, driven by:
- Technological breakthroughs: The development of AI-powered crowd management systems and improved non-lethal weaponry.
- Strategic partnerships: Collaboration between technology providers and law enforcement agencies.
- Market expansion: Growing demand in emerging markets.
Leading Players in the Riot Control System Market Sector
- Lamperd Less Lethal
- PACEM Defense LLC
- Desert Wolf
- Byrna Technologies Inc
- Blackhawk
- NonLethal Technologies Inc
- Axon Enterprise Inc
- Genasys Inc
- Etienne Lacroix Group
- Condor Non-lethal Technologies
- Combined Systems Inc
- Safariland LLC
Key Milestones in Riot Control System Market Industry
- September 2022: BSF launched a tear gas shell-dropping drone system, highlighting the integration of UAV technology into riot control operations.
- June 2022: Iranian police invested nearly USD 10 Million in anti-riot equipment, demonstrating the escalating demand in regions with civil unrest.
Strategic Outlook for Riot Control System Market Market
The Riot Control System market is poised for continued growth, driven by technological advancements, increasing global demand for public safety solutions, and ongoing investments in law enforcement technologies. Strategic opportunities exist for companies to develop innovative and less lethal products, enhance supply chain resilience, and expand their market presence in emerging regions. Focusing on ethical considerations and responsible product development will be crucial for long-term success in this sector.
Riot Control System Market Segmentation
-
1. Product Type
-
1.1. Personal Protective Equipment
- 1.1.1. Vests
- 1.1.2. Helmets
- 1.1.3. Gas Masks
- 1.1.4. Shields
-
1.2. Offensive Equipment
-
1.2.1. Area Denial
- 1.2.1.1. Anti-vehicle
- 1.2.1.2. Anti-personnel
-
1.2.2. Ammunition
- 1.2.2.1. Rubber Bullets
- 1.2.2.2. Wax Bullets
- 1.2.2.3. Plastic Bullets
- 1.2.2.4. Bean Bag Rounds
- 1.2.2.5. Sponge Grenade
-
1.2.3. Explosives
- 1.2.3.1. Flash Bang Grenades
- 1.2.3.2. Sting Grenades
-
1.2.4. Gases and Sprays
- 1.2.4.1. Water Canons
- 1.2.4.2. Scent-based Weapons
- 1.2.4.3. Tear Gas
- 1.2.4.4. Pepper Spray
- 1.2.5. Directed Energy Weapons
- 1.2.6. Electroshock Weapons
- 1.2.7. Other Offensive Equipment
-
1.2.1. Area Denial
-
1.1. Personal Protective Equipment
-
2. End-User
- 2.1. Law Enforcement
- 2.2. Special Forces
Riot Control System Market Segmentation By Geography
-
1. North America
- 1.1. United States
- 1.2. Canada
-
2. Europe
- 2.1. United Kingdom
- 2.2. France
- 2.3. Germany
- 2.4. Russia
- 2.5. Rest of Europe
-
3. Asia Pacific
- 3.1. China
- 3.2. India
- 3.3. Japan
- 3.4. South Korea
- 3.5. Rest of Asia Pacific
-
4. Latin America
- 4.1. Brazil
- 4.2. Rest of Latin America
-
5. Middle East and Africa
- 5.1. Saudi Arabia
- 5.2. United Arab Emirates
- 5.3. Israel
- 5.4. Rest of Middle East and Africa
Riot Control System Market REPORT HIGHLIGHTS
| Aspects | Details |
|---|---|
| Study Period | 2019-2033 |
| Base Year | 2024 |
| Estimated Year | 2025 |
| Forecast Period | 2025-2033 |
| Historical Period | 2019-2024 |
| Growth Rate | CAGR of 4.24% from 2019-2033 |
| Segmentation |
|
Table of Contents
- 1. Introduction
- 1.1. Research Scope
- 1.2. Market Segmentation
- 1.3. Research Methodology
- 1.4. Definitions and Assumptions
- 2. Executive Summary
- 2.1. Introduction
- 3. Market Dynamics
- 3.1. Introduction
- 3.2. Market Drivers
- 3.3. Market Restrains
- 3.4. Market Trends
- 3.4.1. The Offensive Equipment Segment is Expected to Experience the Highest Growth During the Forecast Period
- 4. Market Factor Analysis
- 4.1. Porters Five Forces
- 4.2. Supply/Value Chain
- 4.3. PESTEL analysis
- 4.4. Market Entropy
- 4.5. Patent/Trademark Analysis
- 5. Global Riot Control System Market Analysis, Insights and Forecast, 2019-2031
- 5.1. Market Analysis, Insights and Forecast - by Product Type
- 5.1.1. Personal Protective Equipment
- 5.1.1.1. Vests
- 5.1.1.2. Helmets
- 5.1.1.3. Gas Masks
- 5.1.1.4. Shields
- 5.1.2. Offensive Equipment
- 5.1.2.1. Area Denial
- 5.1.2.1.1. Anti-vehicle
- 5.1.2.1.2. Anti-personnel
- 5.1.2.2. Ammunition
- 5.1.2.2.1. Rubber Bullets
- 5.1.2.2.2. Wax Bullets
- 5.1.2.2.3. Plastic Bullets
- 5.1.2.2.4. Bean Bag Rounds
- 5.1.2.2.5. Sponge Grenade
- 5.1.2.3. Explosives
- 5.1.2.3.1. Flash Bang Grenades
- 5.1.2.3.2. Sting Grenades
- 5.1.2.4. Gases and Sprays
- 5.1.2.4.1. Water Canons
- 5.1.2.4.2. Scent-based Weapons
- 5.1.2.4.3. Tear Gas
- 5.1.2.4.4. Pepper Spray
- 5.1.2.5. Directed Energy Weapons
- 5.1.2.6. Electroshock Weapons
- 5.1.2.7. Other Offensive Equipment
- 5.1.2.1. Area Denial
- 5.1.1. Personal Protective Equipment
- 5.2. Market Analysis, Insights and Forecast - by End-User
- 5.2.1. Law Enforcement
- 5.2.2. Special Forces
- 5.3. Market Analysis, Insights and Forecast - by Region
- 5.3.1. North America
- 5.3.2. Europe
- 5.3.3. Asia Pacific
- 5.3.4. Latin America
- 5.3.5. Middle East and Africa
- 5.1. Market Analysis, Insights and Forecast - by Product Type
- 6. North America Riot Control System Market Analysis, Insights and Forecast, 2019-2031
- 6.1. Market Analysis, Insights and Forecast - by Product Type
- 6.1.1. Personal Protective Equipment
- 6.1.1.1. Vests
- 6.1.1.2. Helmets
- 6.1.1.3. Gas Masks
- 6.1.1.4. Shields
- 6.1.2. Offensive Equipment
- 6.1.2.1. Area Denial
- 6.1.2.1.1. Anti-vehicle
- 6.1.2.1.2. Anti-personnel
- 6.1.2.2. Ammunition
- 6.1.2.2.1. Rubber Bullets
- 6.1.2.2.2. Wax Bullets
- 6.1.2.2.3. Plastic Bullets
- 6.1.2.2.4. Bean Bag Rounds
- 6.1.2.2.5. Sponge Grenade
- 6.1.2.3. Explosives
- 6.1.2.3.1. Flash Bang Grenades
- 6.1.2.3.2. Sting Grenades
- 6.1.2.4. Gases and Sprays
- 6.1.2.4.1. Water Canons
- 6.1.2.4.2. Scent-based Weapons
- 6.1.2.4.3. Tear Gas
- 6.1.2.4.4. Pepper Spray
- 6.1.2.5. Directed Energy Weapons
- 6.1.2.6. Electroshock Weapons
- 6.1.2.7. Other Offensive Equipment
- 6.1.2.1. Area Denial
- 6.1.1. Personal Protective Equipment
- 6.2. Market Analysis, Insights and Forecast - by End-User
- 6.2.1. Law Enforcement
- 6.2.2. Special Forces
- 6.1. Market Analysis, Insights and Forecast - by Product Type
- 7. Europe Riot Control System Market Analysis, Insights and Forecast, 2019-2031
- 7.1. Market Analysis, Insights and Forecast - by Product Type
- 7.1.1. Personal Protective Equipment
- 7.1.1.1. Vests
- 7.1.1.2. Helmets
- 7.1.1.3. Gas Masks
- 7.1.1.4. Shields
- 7.1.2. Offensive Equipment
- 7.1.2.1. Area Denial
- 7.1.2.1.1. Anti-vehicle
- 7.1.2.1.2. Anti-personnel
- 7.1.2.2. Ammunition
- 7.1.2.2.1. Rubber Bullets
- 7.1.2.2.2. Wax Bullets
- 7.1.2.2.3. Plastic Bullets
- 7.1.2.2.4. Bean Bag Rounds
- 7.1.2.2.5. Sponge Grenade
- 7.1.2.3. Explosives
- 7.1.2.3.1. Flash Bang Grenades
- 7.1.2.3.2. Sting Grenades
- 7.1.2.4. Gases and Sprays
- 7.1.2.4.1. Water Canons
- 7.1.2.4.2. Scent-based Weapons
- 7.1.2.4.3. Tear Gas
- 7.1.2.4.4. Pepper Spray
- 7.1.2.5. Directed Energy Weapons
- 7.1.2.6. Electroshock Weapons
- 7.1.2.7. Other Offensive Equipment
- 7.1.2.1. Area Denial
- 7.1.1. Personal Protective Equipment
- 7.2. Market Analysis, Insights and Forecast - by End-User
- 7.2.1. Law Enforcement
- 7.2.2. Special Forces
- 7.1. Market Analysis, Insights and Forecast - by Product Type
- 8. Asia Pacific Riot Control System Market Analysis, Insights and Forecast, 2019-2031
- 8.1. Market Analysis, Insights and Forecast - by Product Type
- 8.1.1. Personal Protective Equipment
- 8.1.1.1. Vests
- 8.1.1.2. Helmets
- 8.1.1.3. Gas Masks
- 8.1.1.4. Shields
- 8.1.2. Offensive Equipment
- 8.1.2.1. Area Denial
- 8.1.2.1.1. Anti-vehicle
- 8.1.2.1.2. Anti-personnel
- 8.1.2.2. Ammunition
- 8.1.2.2.1. Rubber Bullets
- 8.1.2.2.2. Wax Bullets
- 8.1.2.2.3. Plastic Bullets
- 8.1.2.2.4. Bean Bag Rounds
- 8.1.2.2.5. Sponge Grenade
- 8.1.2.3. Explosives
- 8.1.2.3.1. Flash Bang Grenades
- 8.1.2.3.2. Sting Grenades
- 8.1.2.4. Gases and Sprays
- 8.1.2.4.1. Water Canons
- 8.1.2.4.2. Scent-based Weapons
- 8.1.2.4.3. Tear Gas
- 8.1.2.4.4. Pepper Spray
- 8.1.2.5. Directed Energy Weapons
- 8.1.2.6. Electroshock Weapons
- 8.1.2.7. Other Offensive Equipment
- 8.1.2.1. Area Denial
- 8.1.1. Personal Protective Equipment
- 8.2. Market Analysis, Insights and Forecast - by End-User
- 8.2.1. Law Enforcement
- 8.2.2. Special Forces
- 8.1. Market Analysis, Insights and Forecast - by Product Type
- 9. Latin America Riot Control System Market Analysis, Insights and Forecast, 2019-2031
- 9.1. Market Analysis, Insights and Forecast - by Product Type
- 9.1.1. Personal Protective Equipment
- 9.1.1.1. Vests
- 9.1.1.2. Helmets
- 9.1.1.3. Gas Masks
- 9.1.1.4. Shields
- 9.1.2. Offensive Equipment
- 9.1.2.1. Area Denial
- 9.1.2.1.1. Anti-vehicle
- 9.1.2.1.2. Anti-personnel
- 9.1.2.2. Ammunition
- 9.1.2.2.1. Rubber Bullets
- 9.1.2.2.2. Wax Bullets
- 9.1.2.2.3. Plastic Bullets
- 9.1.2.2.4. Bean Bag Rounds
- 9.1.2.2.5. Sponge Grenade
- 9.1.2.3. Explosives
- 9.1.2.3.1. Flash Bang Grenades
- 9.1.2.3.2. Sting Grenades
- 9.1.2.4. Gases and Sprays
- 9.1.2.4.1. Water Canons
- 9.1.2.4.2. Scent-based Weapons
- 9.1.2.4.3. Tear Gas
- 9.1.2.4.4. Pepper Spray
- 9.1.2.5. Directed Energy Weapons
- 9.1.2.6. Electroshock Weapons
- 9.1.2.7. Other Offensive Equipment
- 9.1.2.1. Area Denial
- 9.1.1. Personal Protective Equipment
- 9.2. Market Analysis, Insights and Forecast - by End-User
- 9.2.1. Law Enforcement
- 9.2.2. Special Forces
- 9.1. Market Analysis, Insights and Forecast - by Product Type
- 10. Middle East and Africa Riot Control System Market Analysis, Insights and Forecast, 2019-2031
- 10.1. Market Analysis, Insights and Forecast - by Product Type
- 10.1.1. Personal Protective Equipment
- 10.1.1.1. Vests
- 10.1.1.2. Helmets
- 10.1.1.3. Gas Masks
- 10.1.1.4. Shields
- 10.1.2. Offensive Equipment
- 10.1.2.1. Area Denial
- 10.1.2.1.1. Anti-vehicle
- 10.1.2.1.2. Anti-personnel
- 10.1.2.2. Ammunition
- 10.1.2.2.1. Rubber Bullets
- 10.1.2.2.2. Wax Bullets
- 10.1.2.2.3. Plastic Bullets
- 10.1.2.2.4. Bean Bag Rounds
- 10.1.2.2.5. Sponge Grenade
- 10.1.2.3. Explosives
- 10.1.2.3.1. Flash Bang Grenades
- 10.1.2.3.2. Sting Grenades
- 10.1.2.4. Gases and Sprays
- 10.1.2.4.1. Water Canons
- 10.1.2.4.2. Scent-based Weapons
- 10.1.2.4.3. Tear Gas
- 10.1.2.4.4. Pepper Spray
- 10.1.2.5. Directed Energy Weapons
- 10.1.2.6. Electroshock Weapons
- 10.1.2.7. Other Offensive Equipment
- 10.1.2.1. Area Denial
- 10.1.1. Personal Protective Equipment
- 10.2. Market Analysis, Insights and Forecast - by End-User
- 10.2.1. Law Enforcement
- 10.2.2. Special Forces
- 10.1. Market Analysis, Insights and Forecast - by Product Type
- 11. North America Riot Control System Market Analysis, Insights and Forecast, 2019-2031
- 11.1. Market Analysis, Insights and Forecast - By Country/Sub-region
- 11.1.1 United States
- 11.1.2 Canada
- 12. Europe Riot Control System Market Analysis, Insights and Forecast, 2019-2031
- 12.1. Market Analysis, Insights and Forecast - By Country/Sub-region
- 12.1.1 United Kingdom
- 12.1.2 France
- 12.1.3 Germany
- 12.1.4 Italy
- 12.1.5 Rest of Europe
- 13. Asia Pacific Riot Control System Market Analysis, Insights and Forecast, 2019-2031
- 13.1. Market Analysis, Insights and Forecast - By Country/Sub-region
- 13.1.1 China
- 13.1.2 India
- 13.1.3 Japan
- 13.1.4 South Korea
- 13.1.5 Rest of Asia Pacific
- 14. Latin America Riot Control System Market Analysis, Insights and Forecast, 2019-2031
- 14.1. Market Analysis, Insights and Forecast - By Country/Sub-region
- 14.1.1 Brazil
- 14.1.2 Mexico
- 14.1.3 Rest of Latin America
- 15. Middle East and Africa Riot Control System Market Analysis, Insights and Forecast, 2019-2031
- 15.1. Market Analysis, Insights and Forecast - By Country/Sub-region
- 15.1.1 Saudi Arabia
- 15.1.2 United Arab Emirates
- 15.1.3 South Africa
- 15.1.4 Qatar
- 15.1.5 Rest of Middle East and Africa
- 16. Competitive Analysis
- 16.1. Global Market Share Analysis 2024
- 16.2. Company Profiles
- 16.2.1 Lamperd Less Lethal
- 16.2.1.1. Overview
- 16.2.1.2. Products
- 16.2.1.3. SWOT Analysis
- 16.2.1.4. Recent Developments
- 16.2.1.5. Financials (Based on Availability)
- 16.2.2 PACEM Defense LLC
- 16.2.2.1. Overview
- 16.2.2.2. Products
- 16.2.2.3. SWOT Analysis
- 16.2.2.4. Recent Developments
- 16.2.2.5. Financials (Based on Availability)
- 16.2.3 Desert Wolf
- 16.2.3.1. Overview
- 16.2.3.2. Products
- 16.2.3.3. SWOT Analysis
- 16.2.3.4. Recent Developments
- 16.2.3.5. Financials (Based on Availability)
- 16.2.4 Byrna Technologies Inc
- 16.2.4.1. Overview
- 16.2.4.2. Products
- 16.2.4.3. SWOT Analysis
- 16.2.4.4. Recent Developments
- 16.2.4.5. Financials (Based on Availability)
- 16.2.5 Blackhawk
- 16.2.5.1. Overview
- 16.2.5.2. Products
- 16.2.5.3. SWOT Analysis
- 16.2.5.4. Recent Developments
- 16.2.5.5. Financials (Based on Availability)
- 16.2.6 NonLethal Technologies Inc
- 16.2.6.1. Overview
- 16.2.6.2. Products
- 16.2.6.3. SWOT Analysis
- 16.2.6.4. Recent Developments
- 16.2.6.5. Financials (Based on Availability)
- 16.2.7 Axon Enterprise Inc
- 16.2.7.1. Overview
- 16.2.7.2. Products
- 16.2.7.3. SWOT Analysis
- 16.2.7.4. Recent Developments
- 16.2.7.5. Financials (Based on Availability)
- 16.2.8 Genasys Inc
- 16.2.8.1. Overview
- 16.2.8.2. Products
- 16.2.8.3. SWOT Analysis
- 16.2.8.4. Recent Developments
- 16.2.8.5. Financials (Based on Availability)
- 16.2.9 Etienne Lacroix Group
- 16.2.9.1. Overview
- 16.2.9.2. Products
- 16.2.9.3. SWOT Analysis
- 16.2.9.4. Recent Developments
- 16.2.9.5. Financials (Based on Availability)
- 16.2.10 Condor Non-lethal Technologies
- 16.2.10.1. Overview
- 16.2.10.2. Products
- 16.2.10.3. SWOT Analysis
- 16.2.10.4. Recent Developments
- 16.2.10.5. Financials (Based on Availability)
- 16.2.11 Combined Systems Inc
- 16.2.11.1. Overview
- 16.2.11.2. Products
- 16.2.11.3. SWOT Analysis
- 16.2.11.4. Recent Developments
- 16.2.11.5. Financials (Based on Availability)
- 16.2.12 Safariland LLC
- 16.2.12.1. Overview
- 16.2.12.2. Products
- 16.2.12.3. SWOT Analysis
- 16.2.12.4. Recent Developments
- 16.2.12.5. Financials (Based on Availability)
- 16.2.1 Lamperd Less Lethal
List of Figures
- Figure 1: Global Riot Control System Market Revenue Breakdown (Million, %) by Region 2024 & 2032
- Figure 2: North America Riot Control System Market Revenue (Million), by Country 2024 & 2032
- Figure 3: North America Riot Control System Market Revenue Share (%), by Country 2024 & 2032
- Figure 4: Europe Riot Control System Market Revenue (Million), by Country 2024 & 2032
- Figure 5: Europe Riot Control System Market Revenue Share (%), by Country 2024 & 2032
- Figure 6: Asia Pacific Riot Control System Market Revenue (Million), by Country 2024 & 2032
- Figure 7: Asia Pacific Riot Control System Market Revenue Share (%), by Country 2024 & 2032
- Figure 8: Latin America Riot Control System Market Revenue (Million), by Country 2024 & 2032
- Figure 9: Latin America Riot Control System Market Revenue Share (%), by Country 2024 & 2032
- Figure 10: Middle East and Africa Riot Control System Market Revenue (Million), by Country 2024 & 2032
- Figure 11: Middle East and Africa Riot Control System Market Revenue Share (%), by Country 2024 & 2032
- Figure 12: North America Riot Control System Market Revenue (Million), by Product Type 2024 & 2032
- Figure 13: North America Riot Control System Market Revenue Share (%), by Product Type 2024 & 2032
- Figure 14: North America Riot Control System Market Revenue (Million), by End-User 2024 & 2032
- Figure 15: North America Riot Control System Market Revenue Share (%), by End-User 2024 & 2032
- Figure 16: North America Riot Control System Market Revenue (Million), by Country 2024 & 2032
- Figure 17: North America Riot Control System Market Revenue Share (%), by Country 2024 & 2032
- Figure 18: Europe Riot Control System Market Revenue (Million), by Product Type 2024 & 2032
- Figure 19: Europe Riot Control System Market Revenue Share (%), by Product Type 2024 & 2032
- Figure 20: Europe Riot Control System Market Revenue (Million), by End-User 2024 & 2032
- Figure 21: Europe Riot Control System Market Revenue Share (%), by End-User 2024 & 2032
- Figure 22: Europe Riot Control System Market Revenue (Million), by Country 2024 & 2032
- Figure 23: Europe Riot Control System Market Revenue Share (%), by Country 2024 & 2032
- Figure 24: Asia Pacific Riot Control System Market Revenue (Million), by Product Type 2024 & 2032
- Figure 25: Asia Pacific Riot Control System Market Revenue Share (%), by Product Type 2024 & 2032
- Figure 26: Asia Pacific Riot Control System Market Revenue (Million), by End-User 2024 & 2032
- Figure 27: Asia Pacific Riot Control System Market Revenue Share (%), by End-User 2024 & 2032
- Figure 28: Asia Pacific Riot Control System Market Revenue (Million), by Country 2024 & 2032
- Figure 29: Asia Pacific Riot Control System Market Revenue Share (%), by Country 2024 & 2032
- Figure 30: Latin America Riot Control System Market Revenue (Million), by Product Type 2024 & 2032
- Figure 31: Latin America Riot Control System Market Revenue Share (%), by Product Type 2024 & 2032
- Figure 32: Latin America Riot Control System Market Revenue (Million), by End-User 2024 & 2032
- Figure 33: Latin America Riot Control System Market Revenue Share (%), by End-User 2024 & 2032
- Figure 34: Latin America Riot Control System Market Revenue (Million), by Country 2024 & 2032
- Figure 35: Latin America Riot Control System Market Revenue Share (%), by Country 2024 & 2032
- Figure 36: Middle East and Africa Riot Control System Market Revenue (Million), by Product Type 2024 & 2032
- Figure 37: Middle East and Africa Riot Control System Market Revenue Share (%), by Product Type 2024 & 2032
- Figure 38: Middle East and Africa Riot Control System Market Revenue (Million), by End-User 2024 & 2032
- Figure 39: Middle East and Africa Riot Control System Market Revenue Share (%), by End-User 2024 & 2032
- Figure 40: Middle East and Africa Riot Control System Market Revenue (Million), by Country 2024 & 2032
- Figure 41: Middle East and Africa Riot Control System Market Revenue Share (%), by Country 2024 & 2032
List of Tables
- Table 1: Global Riot Control System Market Revenue Million Forecast, by Region 2019 & 2032
- Table 2: Global Riot Control System Market Revenue Million Forecast, by Product Type 2019 & 2032
- Table 3: Global Riot Control System Market Revenue Million Forecast, by End-User 2019 & 2032
- Table 4: Global Riot Control System Market Revenue Million Forecast, by Region 2019 & 2032
- Table 5: Global Riot Control System Market Revenue Million Forecast, by Country 2019 & 2032
- Table 6: United States Riot Control System Market Revenue (Million) Forecast, by Application 2019 & 2032
- Table 7: Canada Riot Control System Market Revenue (Million) Forecast, by Application 2019 & 2032
- Table 8: Global Riot Control System Market Revenue Million Forecast, by Country 2019 & 2032
- Table 9: United Kingdom Riot Control System Market Revenue (Million) Forecast, by Application 2019 & 2032
- Table 10: France Riot Control System Market Revenue (Million) Forecast, by Application 2019 & 2032
- Table 11: Germany Riot Control System Market Revenue (Million) Forecast, by Application 2019 & 2032
- Table 12: Italy Riot Control System Market Revenue (Million) Forecast, by Application 2019 & 2032
- Table 13: Rest of Europe Riot Control System Market Revenue (Million) Forecast, by Application 2019 & 2032
- Table 14: Global Riot Control System Market Revenue Million Forecast, by Country 2019 & 2032
- Table 15: China Riot Control System Market Revenue (Million) Forecast, by Application 2019 & 2032
- Table 16: India Riot Control System Market Revenue (Million) Forecast, by Application 2019 & 2032
- Table 17: Japan Riot Control System Market Revenue (Million) Forecast, by Application 2019 & 2032
- Table 18: South Korea Riot Control System Market Revenue (Million) Forecast, by Application 2019 & 2032
- Table 19: Rest of Asia Pacific Riot Control System Market Revenue (Million) Forecast, by Application 2019 & 2032
- Table 20: Global Riot Control System Market Revenue Million Forecast, by Country 2019 & 2032
- Table 21: Brazil Riot Control System Market Revenue (Million) Forecast, by Application 2019 & 2032
- Table 22: Mexico Riot Control System Market Revenue (Million) Forecast, by Application 2019 & 2032
- Table 23: Rest of Latin America Riot Control System Market Revenue (Million) Forecast, by Application 2019 & 2032
- Table 24: Global Riot Control System Market Revenue Million Forecast, by Country 2019 & 2032
- Table 25: Saudi Arabia Riot Control System Market Revenue (Million) Forecast, by Application 2019 & 2032
- Table 26: United Arab Emirates Riot Control System Market Revenue (Million) Forecast, by Application 2019 & 2032
- Table 27: South Africa Riot Control System Market Revenue (Million) Forecast, by Application 2019 & 2032
- Table 28: Qatar Riot Control System Market Revenue (Million) Forecast, by Application 2019 & 2032
- Table 29: Rest of Middle East and Africa Riot Control System Market Revenue (Million) Forecast, by Application 2019 & 2032
- Table 30: Global Riot Control System Market Revenue Million Forecast, by Product Type 2019 & 2032
- Table 31: Global Riot Control System Market Revenue Million Forecast, by End-User 2019 & 2032
- Table 32: Global Riot Control System Market Revenue Million Forecast, by Country 2019 & 2032
- Table 33: United States Riot Control System Market Revenue (Million) Forecast, by Application 2019 & 2032
- Table 34: Canada Riot Control System Market Revenue (Million) Forecast, by Application 2019 & 2032
- Table 35: Global Riot Control System Market Revenue Million Forecast, by Product Type 2019 & 2032
- Table 36: Global Riot Control System Market Revenue Million Forecast, by End-User 2019 & 2032
- Table 37: Global Riot Control System Market Revenue Million Forecast, by Country 2019 & 2032
- Table 38: United Kingdom Riot Control System Market Revenue (Million) Forecast, by Application 2019 & 2032
- Table 39: France Riot Control System Market Revenue (Million) Forecast, by Application 2019 & 2032
- Table 40: Germany Riot Control System Market Revenue (Million) Forecast, by Application 2019 & 2032
- Table 41: Russia Riot Control System Market Revenue (Million) Forecast, by Application 2019 & 2032
- Table 42: Rest of Europe Riot Control System Market Revenue (Million) Forecast, by Application 2019 & 2032
- Table 43: Global Riot Control System Market Revenue Million Forecast, by Product Type 2019 & 2032
- Table 44: Global Riot Control System Market Revenue Million Forecast, by End-User 2019 & 2032
- Table 45: Global Riot Control System Market Revenue Million Forecast, by Country 2019 & 2032
- Table 46: China Riot Control System Market Revenue (Million) Forecast, by Application 2019 & 2032
- Table 47: India Riot Control System Market Revenue (Million) Forecast, by Application 2019 & 2032
- Table 48: Japan Riot Control System Market Revenue (Million) Forecast, by Application 2019 & 2032
- Table 49: South Korea Riot Control System Market Revenue (Million) Forecast, by Application 2019 & 2032
- Table 50: Rest of Asia Pacific Riot Control System Market Revenue (Million) Forecast, by Application 2019 & 2032
- Table 51: Global Riot Control System Market Revenue Million Forecast, by Product Type 2019 & 2032
- Table 52: Global Riot Control System Market Revenue Million Forecast, by End-User 2019 & 2032
- Table 53: Global Riot Control System Market Revenue Million Forecast, by Country 2019 & 2032
- Table 54: Brazil Riot Control System Market Revenue (Million) Forecast, by Application 2019 & 2032
- Table 55: Rest of Latin America Riot Control System Market Revenue (Million) Forecast, by Application 2019 & 2032
- Table 56: Global Riot Control System Market Revenue Million Forecast, by Product Type 2019 & 2032
- Table 57: Global Riot Control System Market Revenue Million Forecast, by End-User 2019 & 2032
- Table 58: Global Riot Control System Market Revenue Million Forecast, by Country 2019 & 2032
- Table 59: Saudi Arabia Riot Control System Market Revenue (Million) Forecast, by Application 2019 & 2032
- Table 60: United Arab Emirates Riot Control System Market Revenue (Million) Forecast, by Application 2019 & 2032
- Table 61: Israel Riot Control System Market Revenue (Million) Forecast, by Application 2019 & 2032
- Table 62: Rest of Middle East and Africa Riot Control System Market Revenue (Million) Forecast, by Application 2019 & 2032
Frequently Asked Questions
1. What is the projected Compound Annual Growth Rate (CAGR) of the Riot Control System Market?
The projected CAGR is approximately 4.24%.
2. Which companies are prominent players in the Riot Control System Market?
Key companies in the market include Lamperd Less Lethal, PACEM Defense LLC, Desert Wolf, Byrna Technologies Inc, Blackhawk, NonLethal Technologies Inc, Axon Enterprise Inc, Genasys Inc, Etienne Lacroix Group, Condor Non-lethal Technologies, Combined Systems Inc, Safariland LLC.
3. What are the main segments of the Riot Control System Market?
The market segments include Product Type, End-User.
4. Can you provide details about the market size?
The market size is estimated to be USD 7.52 Million as of 2022.
5. What are some drivers contributing to market growth?
N/A
6. What are the notable trends driving market growth?
The Offensive Equipment Segment is Expected to Experience the Highest Growth During the Forecast Period.
7. Are there any restraints impacting market growth?
N/A
8. Can you provide examples of recent developments in the market?
September 2022: BSF launched a tear gas shell-dropping drone system that will be useful for security forces to control protesters and rioters. It can be used for launching shells from an unmanned aerial vehicle (UAV).
9. What pricing options are available for accessing the report?
Pricing options include single-user, multi-user, and enterprise licenses priced at USD 4750, USD 5250, and USD 8750 respectively.
10. Is the market size provided in terms of value or volume?
The market size is provided in terms of value, measured in Million.
11. Are there any specific market keywords associated with the report?
Yes, the market keyword associated with the report is "Riot Control System Market," which aids in identifying and referencing the specific market segment covered.
12. How do I determine which pricing option suits my needs best?
The pricing options vary based on user requirements and access needs. Individual users may opt for single-user licenses, while businesses requiring broader access may choose multi-user or enterprise licenses for cost-effective access to the report.
13. Are there any additional resources or data provided in the Riot Control System Market report?
While the report offers comprehensive insights, it's advisable to review the specific contents or supplementary materials provided to ascertain if additional resources or data are available.
14. How can I stay updated on further developments or reports in the Riot Control System Market?
To stay informed about further developments, trends, and reports in the Riot Control System Market, consider subscribing to industry newsletters, following relevant companies and organizations, or regularly checking reputable industry news sources and publications.
Methodology
Step 1 - Identification of Relevant Samples Size from Population Database


Step 2 - Approaches for Defining Global Market Size (Value, Volume* & Price*)

Note*: In applicable scenarios
Step 3 - Data Sources
Primary Research
- Web Analytics
- Survey Reports
- Research Institute
- Latest Research Reports
- Opinion Leaders
Secondary Research
- Annual Reports
- White Paper
- Latest Press Release
- Industry Association
- Paid Database
- Investor Presentations

Step 4 - Data Triangulation
Involves using different sources of information in order to increase the validity of a study
These sources are likely to be stakeholders in a program - participants, other researchers, program staff, other community members, and so on.
Then we put all data in single framework & apply various statistical tools to find out the dynamic on the market.
During the analysis stage, feedback from the stakeholder groups would be compared to determine areas of agreement as well as areas of divergence
