

Key Insights
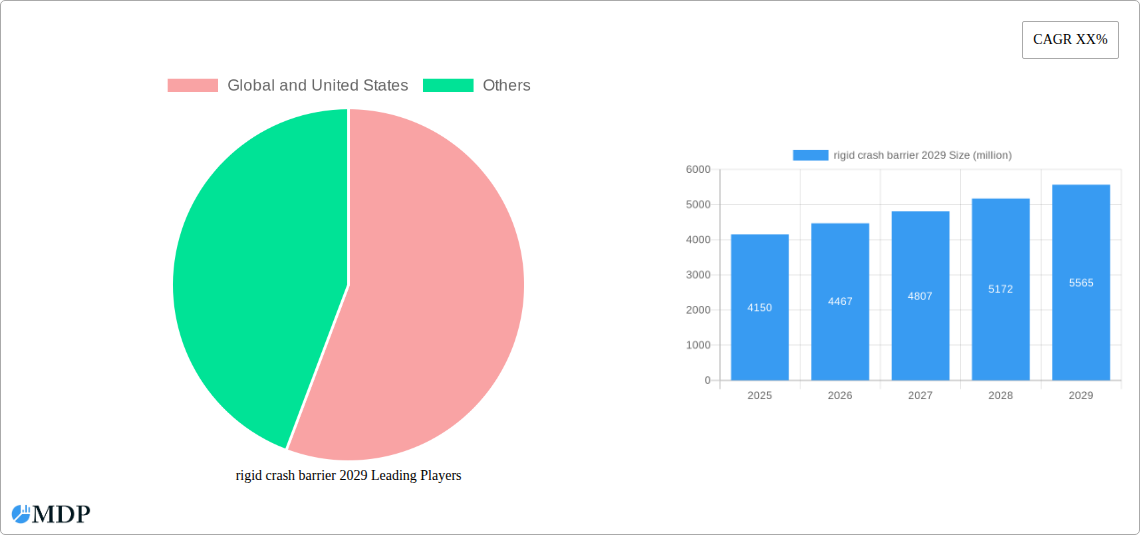
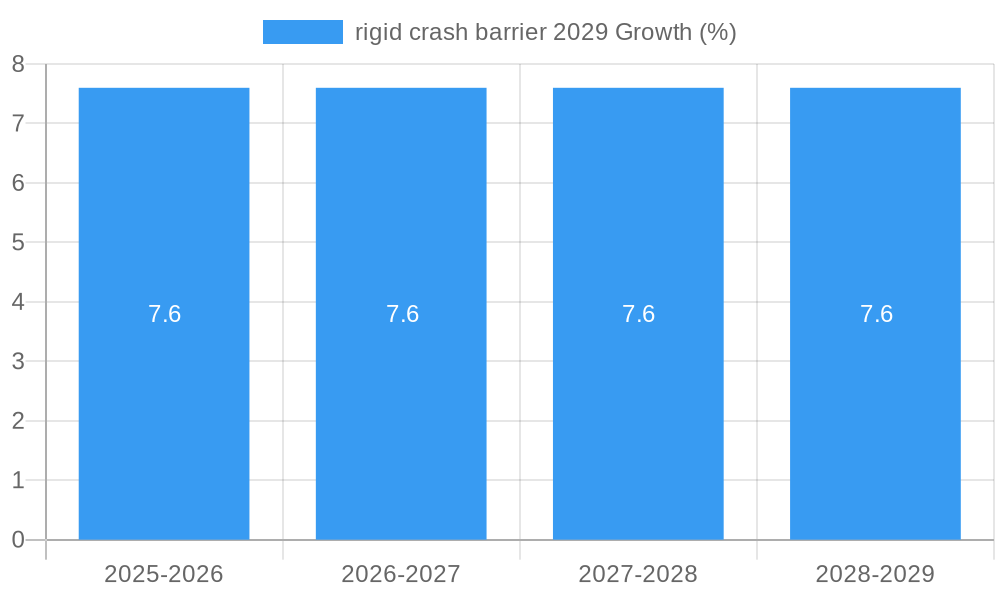
The global rigid crash barrier market is poised for robust growth, projected to reach an estimated $5,500 million by 2029. This expansion is driven by an increasing emphasis on road safety regulations and the continuous development of infrastructure worldwide. The market's Compound Annual Growth Rate (CAGR) is estimated to be approximately 7.5% during the forecast period of 2025-2033. This sustained growth is fueled by a rising demand for durable and effective safety solutions in both urban and rural road networks, aiming to mitigate the severity of traffic accidents and reduce fatalities. Key market drivers include government initiatives promoting safer roads, technological advancements in barrier materials and designs leading to enhanced impact absorption, and a growing awareness among stakeholders about the economic benefits of preventing accidents, which far outweigh the investment in advanced safety systems. The integration of smart features and the development of more sustainable materials are also contributing to market dynamism.
The market segmentation reveals distinct opportunities across various applications and types of rigid crash barriers. In terms of applications, highway safety and urban infrastructure development represent the largest segments, owing to the sheer volume of traffic and the constant need for upgrade and expansion of these networks. Specialized applications in construction sites and industrial zones also contribute significantly to market demand. By type, concrete barriers, particularly Jersey barriers and F-shape barriers, are expected to maintain a dominant market share due to their proven effectiveness, low maintenance, and cost-efficiency. Steel barriers and composite barriers are also gaining traction, offering advantages in specific scenarios like speedways or areas requiring lighter weight or higher flexibility. However, the market is not without its restraints, including the high initial installation costs for certain advanced systems and the logistical challenges associated with deploying large-scale barrier systems, especially in remote or geographically complex regions. Nonetheless, the overarching commitment to improving road safety and reducing accident-related losses is expected to propel the rigid crash barrier market to new heights.
This definitive report, "Rigid Crash Barrier Market 2029," provides an in-depth analysis of the global rigid crash barrier landscape. Spanning a study period from 2019 to 2033, with a base year of 2025 and a forecast period from 2025 to 2033, this research offers invaluable insights for industry stakeholders. It meticulously examines market dynamics, key trends, leading segments, product developments, growth drivers, challenges, and emerging opportunities. The report covers global and United States markets, analyzing various applications and types of rigid crash barriers. With a focus on actionable intelligence, this report is an essential resource for understanding the present and future trajectory of the rigid crash barrier industry.
rigid crash barrier 2029 Market Dynamics & Concentration
The global rigid crash barrier market in 2029 is characterized by moderate concentration, with a few key players holding significant market share. Innovation remains a critical driver, fueled by advancements in materials science and impact absorption technologies, aiming to enhance safety standards and reduce roadside fatalities. Regulatory frameworks, particularly stringent road safety mandates from governments worldwide, continue to shape market entry and product development. The threat of product substitutes, such as flexible or semi-rigid barriers, is present but often dependent on specific application requirements and cost considerations. End-user trends indicate a growing demand for durable, low-maintenance, and aesthetically integrated crash barrier systems in urban and high-traffic areas. Mergers and acquisitions (M&A) activities are anticipated to increase as established companies seek to consolidate market positions, acquire innovative technologies, or expand their geographic reach. Recent M&A deals in the historical period (2019-2024) suggest a trend towards vertical integration and market consolidation, with an estimated xx number of significant transactions. Projected market share for leading companies will be detailed in the report, offering a clear picture of competitive positioning.
rigid crash barrier 2029 Industry Trends & Analysis
The rigid crash barrier industry is poised for robust growth, driven by an escalating global focus on road safety infrastructure. A significant market growth driver is the continuous increase in vehicular traffic worldwide, necessitating more effective and resilient roadside protection systems. Technological disruptions, such as the integration of smart sensors for real-time monitoring and data collection, are beginning to redefine product capabilities. Furthermore, advancements in concrete reinforcement techniques and the development of specialized polymer composites are leading to the creation of lighter, stronger, and more sustainable crash barrier solutions. Consumer preferences are shifting towards barriers that offer not only superior impact resistance but also contribute to environmental sustainability and reduced visual intrusion. The competitive dynamics within the market are intense, with companies investing heavily in research and development to gain a competitive edge. The Compound Annual Growth Rate (CAGR) for the rigid crash barrier market is projected to be around xx% from 2025 to 2033, reflecting sustained demand. Market penetration is expected to deepen, particularly in developing economies undergoing rapid infrastructure development. The emphasis on improved vehicle safety standards and the implementation of stricter traffic regulations are further bolstering market expansion. The ongoing urbanization and expansion of road networks globally are also critical contributors to this positive market trajectory. The development of modular and easily installable barrier systems is also a notable trend, addressing the need for faster infrastructure upgrades and repairs.
Leading Markets & Segments in rigid crash barrier 2029
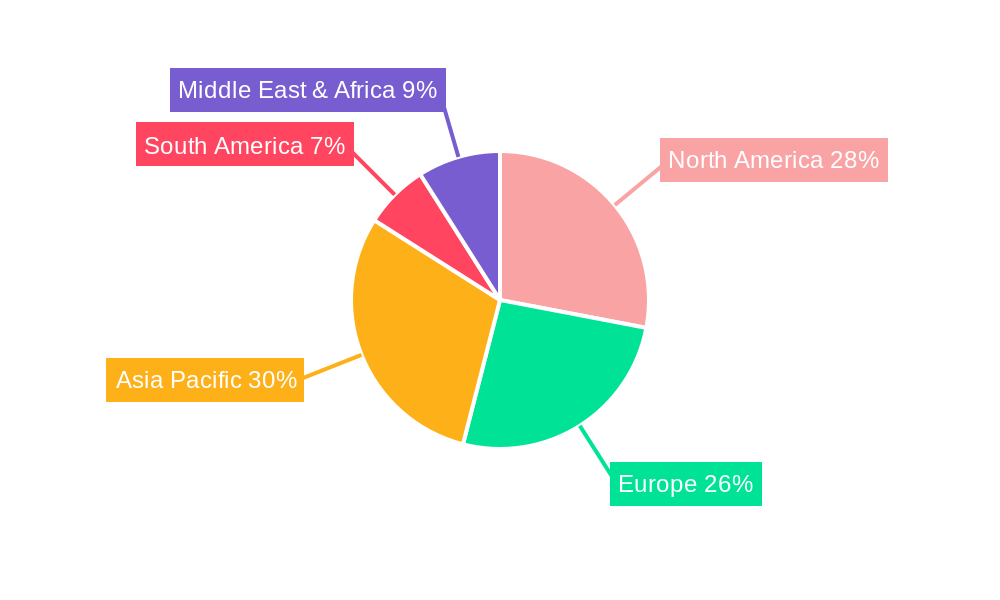
The dominant region for rigid crash barriers in 2029 is expected to be Asia Pacific, driven by rapid infrastructure development, particularly in countries like China and India, and increasing investments in road safety initiatives. The United States also represents a significant and mature market with a strong emphasis on advanced safety standards.
Key Drivers for Dominance:
- Economic Policies and Infrastructure Spending: Government initiatives focused on expanding and upgrading road networks, including highways and urban expressways, are primary catalysts for demand. For example, significant infrastructure spending in emerging economies directly translates to increased adoption of rigid crash barriers.
- Stringent Road Safety Regulations: Mandates from governing bodies for enhanced roadside safety and reduced accident severity necessitate the installation of robust crash barrier systems. These regulations often specify performance standards that favor rigid barrier solutions.
- Technological Adoption: The increasing adoption of advanced materials and construction techniques in infrastructure projects contributes to the demand for high-performance rigid barriers.
- Urbanization and Traffic Congestion: Growing urban populations and increasing traffic congestion lead to higher demands for safer road infrastructure, including effective traffic management and separation systems.
Dominance Analysis by Application:
- Highway Interchanges and Expressways: These are paramount applications for rigid crash barriers due to high-speed traffic and the critical need to prevent run-off-road incidents and head-on collisions. The sheer volume of traffic and the potential severity of accidents in these zones make rigid barriers the preferred choice.
- Urban Roadways and Bridges: As cities expand, rigid crash barriers are increasingly deployed on urban roads, bridges, and elevated sections to manage traffic flow and protect pedestrians and motorists from potential hazards.
- Construction Zones: Temporary yet highly effective rigid barrier solutions are crucial for delineating safe work areas from active traffic, ensuring the safety of both workers and the public.
Dominance Analysis by Types:
- Cast-in-Place Concrete Barriers: These remain a dominant type due to their inherent strength, durability, and cost-effectiveness in large-scale projects. Their monolithic structure provides exceptional impact resistance.
- Precast Concrete Barriers: Offering faster installation and greater flexibility, precast concrete barriers are gaining traction, especially in projects with tight timelines or where modularity is essential. Their ability to be repositioned or reused also adds to their appeal.
- Specialized Composite Barriers: While currently a smaller segment, barriers made from advanced composite materials are emerging, offering unique advantages in terms of weight, corrosion resistance, and design flexibility, catering to niche applications.
rigid crash barrier 2029 Product Developments
Product development in the rigid crash barrier market is increasingly focused on enhancing safety performance and sustainability. Innovations include the integration of advanced composite materials for lighter yet stronger barriers, as well as the development of smart barriers embedded with sensors to monitor structural integrity and traffic conditions. Enhanced impact absorption capabilities through specialized internal designs and surface treatments are also key areas of research, aiming to minimize vehicle damage and occupant injury. Furthermore, manufacturers are exploring eco-friendly concrete formulations and modular designs for easier installation and maintenance, aligning with growing environmental consciousness in infrastructure projects. These developments are crucial for meeting evolving safety standards and addressing the demand for more efficient and sustainable roadside infrastructure solutions.
Key Drivers of rigid crash barrier 2029 Growth
The rigid crash barrier market is propelled by several key growth drivers. Foremost among these is the increasing global emphasis on road safety and the subsequent tightening of regulations governing vehicular accident prevention. This is complemented by substantial government investments in infrastructure development, particularly in emerging economies, to improve transportation networks and accommodate growing traffic volumes. Technological advancements in material science and manufacturing processes enable the creation of more robust, durable, and cost-effective barrier systems. Furthermore, the rising global vehicle population and the corresponding increase in road traffic density necessitate enhanced roadside protection to mitigate the severity of accidents. The demand for low-maintenance and long-lasting safety solutions also contributes significantly to market expansion.
Challenges in the rigid crash barrier 2029 Market
Despite robust growth, the rigid crash barrier market faces several challenges. Stringent regulatory compliance and the need for extensive testing and certification can increase development costs and lead times. Fluctuations in raw material prices, particularly for concrete and steel, can impact manufacturing costs and profitability. Supply chain disruptions, as witnessed in recent years, can affect the availability and timely delivery of essential materials. Intense competition among manufacturers, often leading to price pressures, also poses a challenge. Additionally, the upfront installation costs of rigid barriers can be a barrier for some smaller-scale projects or in regions with budget constraints, encouraging consideration of alternative, though often less effective, solutions.
Emerging Opportunities in rigid crash barrier 2029
Emerging opportunities in the rigid crash barrier market are driven by technological innovation and evolving market needs. The development of smart crash barriers, incorporating IoT sensors for real-time data collection on impact events and structural health, presents a significant avenue for growth. These intelligent systems can provide valuable insights for traffic management and predictive maintenance. Furthermore, the increasing focus on sustainable construction practices is creating demand for eco-friendly barrier materials and designs, such as those utilizing recycled aggregates or low-carbon concrete. Strategic partnerships between barrier manufacturers and smart infrastructure providers can unlock new market segments. Expansion into developing economies with rapidly growing transportation infrastructure also offers substantial long-term growth potential.
Leading Players in the rigid crash barrier 2029 Sector
- Holcim
- CRH plc
- Cemex S.A.B. de C.V.
- Boral Limited
- Saint-Gobain S.A.
- Tata Steel
- ArcelorMittal
- Nucor Corporation
- POSCO
- JFE Steel Corporation
Key Milestones in rigid crash barrier 2029 Industry
- 2019: Launch of next-generation high-strength concrete formulations for enhanced barrier durability.
- 2020: Introduction of modular precast barrier systems offering faster installation times.
- 2021: Increased adoption of advanced composite materials in niche barrier applications.
- 2022: Development and initial testing of smart barriers with integrated impact sensors.
- 2023: Significant M&A activity as major players sought to consolidate market share and technological capabilities.
- 2024: Refinement of smart barrier technology for commercial deployment and data analytics capabilities.
- 2025: Anticipated widespread adoption of advanced materials and smart features in new infrastructure projects.
Strategic Outlook for rigid crash barrier 2029 Market
The strategic outlook for the rigid crash barrier market in 2029 is highly positive, driven by an unwavering global commitment to road safety and continuous infrastructure development. Key growth accelerators include the integration of smart technologies for enhanced traffic management and predictive maintenance, alongside the increasing use of sustainable and advanced composite materials. Manufacturers will focus on product innovation, cost optimization, and strategic partnerships to expand market reach, particularly in developing regions undergoing rapid urbanization and infrastructure upgrades. The market's trajectory is set for sustained growth, fueled by evolving safety standards and the imperative for resilient and intelligent transportation systems.
rigid crash barrier 2029 Segmentation
- 1. Application
- 2. Types
rigid crash barrier 2029 Segmentation By Geography
-
1. North America
- 1.1. United States
- 1.2. Canada
- 1.3. Mexico
-
2. South America
- 2.1. Brazil
- 2.2. Argentina
- 2.3. Rest of South America
-
3. Europe
- 3.1. United Kingdom
- 3.2. Germany
- 3.3. France
- 3.4. Italy
- 3.5. Spain
- 3.6. Russia
- 3.7. Benelux
- 3.8. Nordics
- 3.9. Rest of Europe
-
4. Middle East & Africa
- 4.1. Turkey
- 4.2. Israel
- 4.3. GCC
- 4.4. North Africa
- 4.5. South Africa
- 4.6. Rest of Middle East & Africa
-
5. Asia Pacific
- 5.1. China
- 5.2. India
- 5.3. Japan
- 5.4. South Korea
- 5.5. ASEAN
- 5.6. Oceania
- 5.7. Rest of Asia Pacific
rigid crash barrier 2029 REPORT HIGHLIGHTS
| Aspects | Details |
|---|---|
| Study Period | 2019-2033 |
| Base Year | 2024 |
| Estimated Year | 2025 |
| Forecast Period | 2025-2033 |
| Historical Period | 2019-2024 |
| Growth Rate | CAGR of XX% from 2019-2033 |
| Segmentation |
|
Table of Contents
- 1. Introduction
- 1.1. Research Scope
- 1.2. Market Segmentation
- 1.3. Research Methodology
- 1.4. Definitions and Assumptions
- 2. Executive Summary
- 2.1. Introduction
- 3. Market Dynamics
- 3.1. Introduction
- 3.2. Market Drivers
- 3.3. Market Restrains
- 3.4. Market Trends
- 4. Market Factor Analysis
- 4.1. Porters Five Forces
- 4.2. Supply/Value Chain
- 4.3. PESTEL analysis
- 4.4. Market Entropy
- 4.5. Patent/Trademark Analysis
- 5. Global rigid crash barrier 2029 Analysis, Insights and Forecast, 2019-2031
- 5.1. Market Analysis, Insights and Forecast - by Application
- 5.2. Market Analysis, Insights and Forecast - by Types
- 5.3. Market Analysis, Insights and Forecast - by Region
- 5.3.1. North America
- 5.3.2. South America
- 5.3.3. Europe
- 5.3.4. Middle East & Africa
- 5.3.5. Asia Pacific
- 5.1. Market Analysis, Insights and Forecast - by Application
- 6. North America rigid crash barrier 2029 Analysis, Insights and Forecast, 2019-2031
- 6.1. Market Analysis, Insights and Forecast - by Application
- 6.2. Market Analysis, Insights and Forecast - by Types
- 6.1. Market Analysis, Insights and Forecast - by Application
- 7. South America rigid crash barrier 2029 Analysis, Insights and Forecast, 2019-2031
- 7.1. Market Analysis, Insights and Forecast - by Application
- 7.2. Market Analysis, Insights and Forecast - by Types
- 7.1. Market Analysis, Insights and Forecast - by Application
- 8. Europe rigid crash barrier 2029 Analysis, Insights and Forecast, 2019-2031
- 8.1. Market Analysis, Insights and Forecast - by Application
- 8.2. Market Analysis, Insights and Forecast - by Types
- 8.1. Market Analysis, Insights and Forecast - by Application
- 9. Middle East & Africa rigid crash barrier 2029 Analysis, Insights and Forecast, 2019-2031
- 9.1. Market Analysis, Insights and Forecast - by Application
- 9.2. Market Analysis, Insights and Forecast - by Types
- 9.1. Market Analysis, Insights and Forecast - by Application
- 10. Asia Pacific rigid crash barrier 2029 Analysis, Insights and Forecast, 2019-2031
- 10.1. Market Analysis, Insights and Forecast - by Application
- 10.2. Market Analysis, Insights and Forecast - by Types
- 10.1. Market Analysis, Insights and Forecast - by Application
- 11. Competitive Analysis
- 11.1. Global Market Share Analysis 2024
- 11.2. Company Profiles
- 11.2.1. Global and United States
List of Figures
- Figure 1: Global rigid crash barrier 2029 Revenue Breakdown (million, %) by Region 2024 & 2032
- Figure 2: Global rigid crash barrier 2029 Volume Breakdown (K, %) by Region 2024 & 2032
- Figure 3: North America rigid crash barrier 2029 Revenue (million), by Application 2024 & 2032
- Figure 4: North America rigid crash barrier 2029 Volume (K), by Application 2024 & 2032
- Figure 5: North America rigid crash barrier 2029 Revenue Share (%), by Application 2024 & 2032
- Figure 6: North America rigid crash barrier 2029 Volume Share (%), by Application 2024 & 2032
- Figure 7: North America rigid crash barrier 2029 Revenue (million), by Types 2024 & 2032
- Figure 8: North America rigid crash barrier 2029 Volume (K), by Types 2024 & 2032
- Figure 9: North America rigid crash barrier 2029 Revenue Share (%), by Types 2024 & 2032
- Figure 10: North America rigid crash barrier 2029 Volume Share (%), by Types 2024 & 2032
- Figure 11: North America rigid crash barrier 2029 Revenue (million), by Country 2024 & 2032
- Figure 12: North America rigid crash barrier 2029 Volume (K), by Country 2024 & 2032
- Figure 13: North America rigid crash barrier 2029 Revenue Share (%), by Country 2024 & 2032
- Figure 14: North America rigid crash barrier 2029 Volume Share (%), by Country 2024 & 2032
- Figure 15: South America rigid crash barrier 2029 Revenue (million), by Application 2024 & 2032
- Figure 16: South America rigid crash barrier 2029 Volume (K), by Application 2024 & 2032
- Figure 17: South America rigid crash barrier 2029 Revenue Share (%), by Application 2024 & 2032
- Figure 18: South America rigid crash barrier 2029 Volume Share (%), by Application 2024 & 2032
- Figure 19: South America rigid crash barrier 2029 Revenue (million), by Types 2024 & 2032
- Figure 20: South America rigid crash barrier 2029 Volume (K), by Types 2024 & 2032
- Figure 21: South America rigid crash barrier 2029 Revenue Share (%), by Types 2024 & 2032
- Figure 22: South America rigid crash barrier 2029 Volume Share (%), by Types 2024 & 2032
- Figure 23: South America rigid crash barrier 2029 Revenue (million), by Country 2024 & 2032
- Figure 24: South America rigid crash barrier 2029 Volume (K), by Country 2024 & 2032
- Figure 25: South America rigid crash barrier 2029 Revenue Share (%), by Country 2024 & 2032
- Figure 26: South America rigid crash barrier 2029 Volume Share (%), by Country 2024 & 2032
- Figure 27: Europe rigid crash barrier 2029 Revenue (million), by Application 2024 & 2032
- Figure 28: Europe rigid crash barrier 2029 Volume (K), by Application 2024 & 2032
- Figure 29: Europe rigid crash barrier 2029 Revenue Share (%), by Application 2024 & 2032
- Figure 30: Europe rigid crash barrier 2029 Volume Share (%), by Application 2024 & 2032
- Figure 31: Europe rigid crash barrier 2029 Revenue (million), by Types 2024 & 2032
- Figure 32: Europe rigid crash barrier 2029 Volume (K), by Types 2024 & 2032
- Figure 33: Europe rigid crash barrier 2029 Revenue Share (%), by Types 2024 & 2032
- Figure 34: Europe rigid crash barrier 2029 Volume Share (%), by Types 2024 & 2032
- Figure 35: Europe rigid crash barrier 2029 Revenue (million), by Country 2024 & 2032
- Figure 36: Europe rigid crash barrier 2029 Volume (K), by Country 2024 & 2032
- Figure 37: Europe rigid crash barrier 2029 Revenue Share (%), by Country 2024 & 2032
- Figure 38: Europe rigid crash barrier 2029 Volume Share (%), by Country 2024 & 2032
- Figure 39: Middle East & Africa rigid crash barrier 2029 Revenue (million), by Application 2024 & 2032
- Figure 40: Middle East & Africa rigid crash barrier 2029 Volume (K), by Application 2024 & 2032
- Figure 41: Middle East & Africa rigid crash barrier 2029 Revenue Share (%), by Application 2024 & 2032
- Figure 42: Middle East & Africa rigid crash barrier 2029 Volume Share (%), by Application 2024 & 2032
- Figure 43: Middle East & Africa rigid crash barrier 2029 Revenue (million), by Types 2024 & 2032
- Figure 44: Middle East & Africa rigid crash barrier 2029 Volume (K), by Types 2024 & 2032
- Figure 45: Middle East & Africa rigid crash barrier 2029 Revenue Share (%), by Types 2024 & 2032
- Figure 46: Middle East & Africa rigid crash barrier 2029 Volume Share (%), by Types 2024 & 2032
- Figure 47: Middle East & Africa rigid crash barrier 2029 Revenue (million), by Country 2024 & 2032
- Figure 48: Middle East & Africa rigid crash barrier 2029 Volume (K), by Country 2024 & 2032
- Figure 49: Middle East & Africa rigid crash barrier 2029 Revenue Share (%), by Country 2024 & 2032
- Figure 50: Middle East & Africa rigid crash barrier 2029 Volume Share (%), by Country 2024 & 2032
- Figure 51: Asia Pacific rigid crash barrier 2029 Revenue (million), by Application 2024 & 2032
- Figure 52: Asia Pacific rigid crash barrier 2029 Volume (K), by Application 2024 & 2032
- Figure 53: Asia Pacific rigid crash barrier 2029 Revenue Share (%), by Application 2024 & 2032
- Figure 54: Asia Pacific rigid crash barrier 2029 Volume Share (%), by Application 2024 & 2032
- Figure 55: Asia Pacific rigid crash barrier 2029 Revenue (million), by Types 2024 & 2032
- Figure 56: Asia Pacific rigid crash barrier 2029 Volume (K), by Types 2024 & 2032
- Figure 57: Asia Pacific rigid crash barrier 2029 Revenue Share (%), by Types 2024 & 2032
- Figure 58: Asia Pacific rigid crash barrier 2029 Volume Share (%), by Types 2024 & 2032
- Figure 59: Asia Pacific rigid crash barrier 2029 Revenue (million), by Country 2024 & 2032
- Figure 60: Asia Pacific rigid crash barrier 2029 Volume (K), by Country 2024 & 2032
- Figure 61: Asia Pacific rigid crash barrier 2029 Revenue Share (%), by Country 2024 & 2032
- Figure 62: Asia Pacific rigid crash barrier 2029 Volume Share (%), by Country 2024 & 2032
List of Tables
- Table 1: Global rigid crash barrier 2029 Revenue million Forecast, by Region 2019 & 2032
- Table 2: Global rigid crash barrier 2029 Volume K Forecast, by Region 2019 & 2032
- Table 3: Global rigid crash barrier 2029 Revenue million Forecast, by Application 2019 & 2032
- Table 4: Global rigid crash barrier 2029 Volume K Forecast, by Application 2019 & 2032
- Table 5: Global rigid crash barrier 2029 Revenue million Forecast, by Types 2019 & 2032
- Table 6: Global rigid crash barrier 2029 Volume K Forecast, by Types 2019 & 2032
- Table 7: Global rigid crash barrier 2029 Revenue million Forecast, by Region 2019 & 2032
- Table 8: Global rigid crash barrier 2029 Volume K Forecast, by Region 2019 & 2032
- Table 9: Global rigid crash barrier 2029 Revenue million Forecast, by Application 2019 & 2032
- Table 10: Global rigid crash barrier 2029 Volume K Forecast, by Application 2019 & 2032
- Table 11: Global rigid crash barrier 2029 Revenue million Forecast, by Types 2019 & 2032
- Table 12: Global rigid crash barrier 2029 Volume K Forecast, by Types 2019 & 2032
- Table 13: Global rigid crash barrier 2029 Revenue million Forecast, by Country 2019 & 2032
- Table 14: Global rigid crash barrier 2029 Volume K Forecast, by Country 2019 & 2032
- Table 15: United States rigid crash barrier 2029 Revenue (million) Forecast, by Application 2019 & 2032
- Table 16: United States rigid crash barrier 2029 Volume (K) Forecast, by Application 2019 & 2032
- Table 17: Canada rigid crash barrier 2029 Revenue (million) Forecast, by Application 2019 & 2032
- Table 18: Canada rigid crash barrier 2029 Volume (K) Forecast, by Application 2019 & 2032
- Table 19: Mexico rigid crash barrier 2029 Revenue (million) Forecast, by Application 2019 & 2032
- Table 20: Mexico rigid crash barrier 2029 Volume (K) Forecast, by Application 2019 & 2032
- Table 21: Global rigid crash barrier 2029 Revenue million Forecast, by Application 2019 & 2032
- Table 22: Global rigid crash barrier 2029 Volume K Forecast, by Application 2019 & 2032
- Table 23: Global rigid crash barrier 2029 Revenue million Forecast, by Types 2019 & 2032
- Table 24: Global rigid crash barrier 2029 Volume K Forecast, by Types 2019 & 2032
- Table 25: Global rigid crash barrier 2029 Revenue million Forecast, by Country 2019 & 2032
- Table 26: Global rigid crash barrier 2029 Volume K Forecast, by Country 2019 & 2032
- Table 27: Brazil rigid crash barrier 2029 Revenue (million) Forecast, by Application 2019 & 2032
- Table 28: Brazil rigid crash barrier 2029 Volume (K) Forecast, by Application 2019 & 2032
- Table 29: Argentina rigid crash barrier 2029 Revenue (million) Forecast, by Application 2019 & 2032
- Table 30: Argentina rigid crash barrier 2029 Volume (K) Forecast, by Application 2019 & 2032
- Table 31: Rest of South America rigid crash barrier 2029 Revenue (million) Forecast, by Application 2019 & 2032
- Table 32: Rest of South America rigid crash barrier 2029 Volume (K) Forecast, by Application 2019 & 2032
- Table 33: Global rigid crash barrier 2029 Revenue million Forecast, by Application 2019 & 2032
- Table 34: Global rigid crash barrier 2029 Volume K Forecast, by Application 2019 & 2032
- Table 35: Global rigid crash barrier 2029 Revenue million Forecast, by Types 2019 & 2032
- Table 36: Global rigid crash barrier 2029 Volume K Forecast, by Types 2019 & 2032
- Table 37: Global rigid crash barrier 2029 Revenue million Forecast, by Country 2019 & 2032
- Table 38: Global rigid crash barrier 2029 Volume K Forecast, by Country 2019 & 2032
- Table 39: United Kingdom rigid crash barrier 2029 Revenue (million) Forecast, by Application 2019 & 2032
- Table 40: United Kingdom rigid crash barrier 2029 Volume (K) Forecast, by Application 2019 & 2032
- Table 41: Germany rigid crash barrier 2029 Revenue (million) Forecast, by Application 2019 & 2032
- Table 42: Germany rigid crash barrier 2029 Volume (K) Forecast, by Application 2019 & 2032
- Table 43: France rigid crash barrier 2029 Revenue (million) Forecast, by Application 2019 & 2032
- Table 44: France rigid crash barrier 2029 Volume (K) Forecast, by Application 2019 & 2032
- Table 45: Italy rigid crash barrier 2029 Revenue (million) Forecast, by Application 2019 & 2032
- Table 46: Italy rigid crash barrier 2029 Volume (K) Forecast, by Application 2019 & 2032
- Table 47: Spain rigid crash barrier 2029 Revenue (million) Forecast, by Application 2019 & 2032
- Table 48: Spain rigid crash barrier 2029 Volume (K) Forecast, by Application 2019 & 2032
- Table 49: Russia rigid crash barrier 2029 Revenue (million) Forecast, by Application 2019 & 2032
- Table 50: Russia rigid crash barrier 2029 Volume (K) Forecast, by Application 2019 & 2032
- Table 51: Benelux rigid crash barrier 2029 Revenue (million) Forecast, by Application 2019 & 2032
- Table 52: Benelux rigid crash barrier 2029 Volume (K) Forecast, by Application 2019 & 2032
- Table 53: Nordics rigid crash barrier 2029 Revenue (million) Forecast, by Application 2019 & 2032
- Table 54: Nordics rigid crash barrier 2029 Volume (K) Forecast, by Application 2019 & 2032
- Table 55: Rest of Europe rigid crash barrier 2029 Revenue (million) Forecast, by Application 2019 & 2032
- Table 56: Rest of Europe rigid crash barrier 2029 Volume (K) Forecast, by Application 2019 & 2032
- Table 57: Global rigid crash barrier 2029 Revenue million Forecast, by Application 2019 & 2032
- Table 58: Global rigid crash barrier 2029 Volume K Forecast, by Application 2019 & 2032
- Table 59: Global rigid crash barrier 2029 Revenue million Forecast, by Types 2019 & 2032
- Table 60: Global rigid crash barrier 2029 Volume K Forecast, by Types 2019 & 2032
- Table 61: Global rigid crash barrier 2029 Revenue million Forecast, by Country 2019 & 2032
- Table 62: Global rigid crash barrier 2029 Volume K Forecast, by Country 2019 & 2032
- Table 63: Turkey rigid crash barrier 2029 Revenue (million) Forecast, by Application 2019 & 2032
- Table 64: Turkey rigid crash barrier 2029 Volume (K) Forecast, by Application 2019 & 2032
- Table 65: Israel rigid crash barrier 2029 Revenue (million) Forecast, by Application 2019 & 2032
- Table 66: Israel rigid crash barrier 2029 Volume (K) Forecast, by Application 2019 & 2032
- Table 67: GCC rigid crash barrier 2029 Revenue (million) Forecast, by Application 2019 & 2032
- Table 68: GCC rigid crash barrier 2029 Volume (K) Forecast, by Application 2019 & 2032
- Table 69: North Africa rigid crash barrier 2029 Revenue (million) Forecast, by Application 2019 & 2032
- Table 70: North Africa rigid crash barrier 2029 Volume (K) Forecast, by Application 2019 & 2032
- Table 71: South Africa rigid crash barrier 2029 Revenue (million) Forecast, by Application 2019 & 2032
- Table 72: South Africa rigid crash barrier 2029 Volume (K) Forecast, by Application 2019 & 2032
- Table 73: Rest of Middle East & Africa rigid crash barrier 2029 Revenue (million) Forecast, by Application 2019 & 2032
- Table 74: Rest of Middle East & Africa rigid crash barrier 2029 Volume (K) Forecast, by Application 2019 & 2032
- Table 75: Global rigid crash barrier 2029 Revenue million Forecast, by Application 2019 & 2032
- Table 76: Global rigid crash barrier 2029 Volume K Forecast, by Application 2019 & 2032
- Table 77: Global rigid crash barrier 2029 Revenue million Forecast, by Types 2019 & 2032
- Table 78: Global rigid crash barrier 2029 Volume K Forecast, by Types 2019 & 2032
- Table 79: Global rigid crash barrier 2029 Revenue million Forecast, by Country 2019 & 2032
- Table 80: Global rigid crash barrier 2029 Volume K Forecast, by Country 2019 & 2032
- Table 81: China rigid crash barrier 2029 Revenue (million) Forecast, by Application 2019 & 2032
- Table 82: China rigid crash barrier 2029 Volume (K) Forecast, by Application 2019 & 2032
- Table 83: India rigid crash barrier 2029 Revenue (million) Forecast, by Application 2019 & 2032
- Table 84: India rigid crash barrier 2029 Volume (K) Forecast, by Application 2019 & 2032
- Table 85: Japan rigid crash barrier 2029 Revenue (million) Forecast, by Application 2019 & 2032
- Table 86: Japan rigid crash barrier 2029 Volume (K) Forecast, by Application 2019 & 2032
- Table 87: South Korea rigid crash barrier 2029 Revenue (million) Forecast, by Application 2019 & 2032
- Table 88: South Korea rigid crash barrier 2029 Volume (K) Forecast, by Application 2019 & 2032
- Table 89: ASEAN rigid crash barrier 2029 Revenue (million) Forecast, by Application 2019 & 2032
- Table 90: ASEAN rigid crash barrier 2029 Volume (K) Forecast, by Application 2019 & 2032
- Table 91: Oceania rigid crash barrier 2029 Revenue (million) Forecast, by Application 2019 & 2032
- Table 92: Oceania rigid crash barrier 2029 Volume (K) Forecast, by Application 2019 & 2032
- Table 93: Rest of Asia Pacific rigid crash barrier 2029 Revenue (million) Forecast, by Application 2019 & 2032
- Table 94: Rest of Asia Pacific rigid crash barrier 2029 Volume (K) Forecast, by Application 2019 & 2032
Frequently Asked Questions
1. What is the projected Compound Annual Growth Rate (CAGR) of the rigid crash barrier 2029?
The projected CAGR is approximately XX%.
2. Which companies are prominent players in the rigid crash barrier 2029?
Key companies in the market include Global and United States.
3. What are the main segments of the rigid crash barrier 2029?
The market segments include Application, Types.
4. Can you provide details about the market size?
The market size is estimated to be USD XXX million as of 2022.
5. What are some drivers contributing to market growth?
N/A
6. What are the notable trends driving market growth?
N/A
7. Are there any restraints impacting market growth?
N/A
8. Can you provide examples of recent developments in the market?
N/A
9. What pricing options are available for accessing the report?
Pricing options include single-user, multi-user, and enterprise licenses priced at USD 4350.00, USD 6525.00, and USD 8700.00 respectively.
10. Is the market size provided in terms of value or volume?
The market size is provided in terms of value, measured in million and volume, measured in K.
11. Are there any specific market keywords associated with the report?
Yes, the market keyword associated with the report is "rigid crash barrier 2029," which aids in identifying and referencing the specific market segment covered.
12. How do I determine which pricing option suits my needs best?
The pricing options vary based on user requirements and access needs. Individual users may opt for single-user licenses, while businesses requiring broader access may choose multi-user or enterprise licenses for cost-effective access to the report.
13. Are there any additional resources or data provided in the rigid crash barrier 2029 report?
While the report offers comprehensive insights, it's advisable to review the specific contents or supplementary materials provided to ascertain if additional resources or data are available.
14. How can I stay updated on further developments or reports in the rigid crash barrier 2029?
To stay informed about further developments, trends, and reports in the rigid crash barrier 2029, consider subscribing to industry newsletters, following relevant companies and organizations, or regularly checking reputable industry news sources and publications.
Methodology
Step 1 - Identification of Relevant Samples Size from Population Database


Step 2 - Approaches for Defining Global Market Size (Value, Volume* & Price*)

Note*: In applicable scenarios
Step 3 - Data Sources
Primary Research
- Web Analytics
- Survey Reports
- Research Institute
- Latest Research Reports
- Opinion Leaders
Secondary Research
- Annual Reports
- White Paper
- Latest Press Release
- Industry Association
- Paid Database
- Investor Presentations

Step 4 - Data Triangulation
Involves using different sources of information in order to increase the validity of a study
These sources are likely to be stakeholders in a program - participants, other researchers, program staff, other community members, and so on.
Then we put all data in single framework & apply various statistical tools to find out the dynamic on the market.
During the analysis stage, feedback from the stakeholder groups would be compared to determine areas of agreement as well as areas of divergence
