

Key Insights
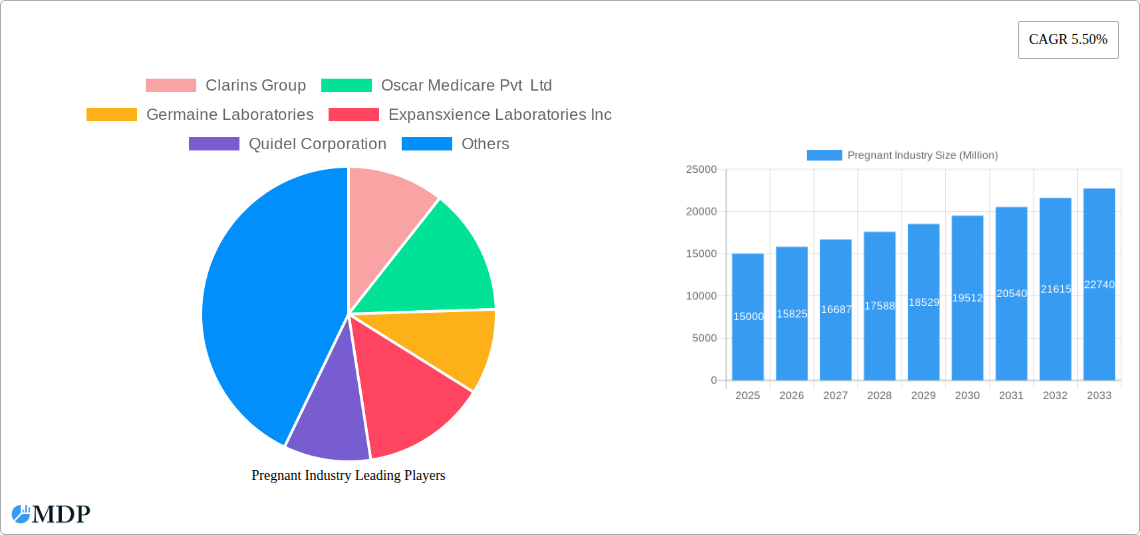
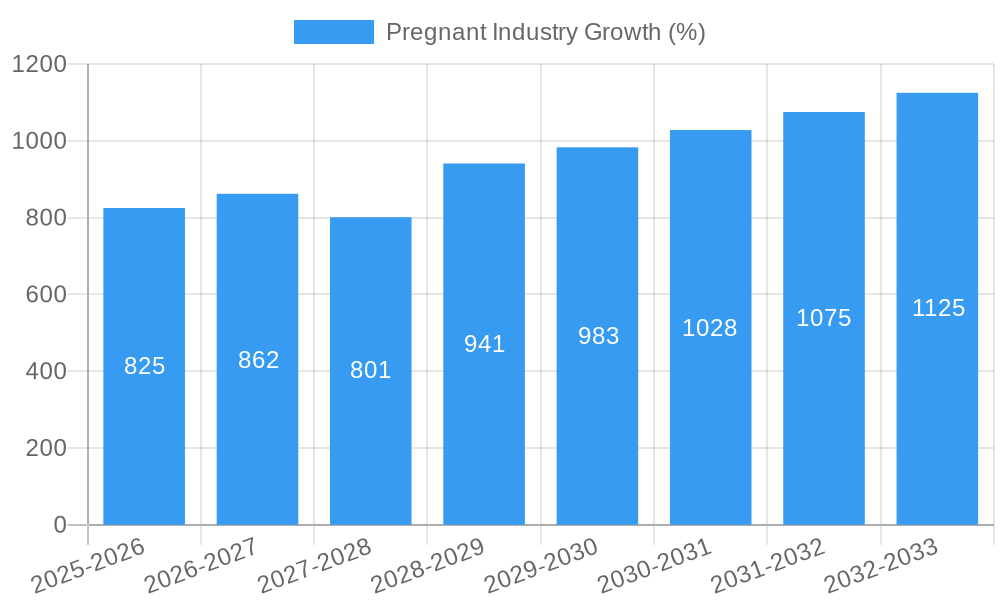
The maternal health and wellness market, encompassing products like stretch mark minimizers, pregnancy test kits, and body firming gels, is experiencing robust growth, projected to maintain a 5.50% CAGR from 2025 to 2033. This expansion is driven by several key factors. Increasing awareness of maternal health and the growing desire for proactive skincare solutions during and after pregnancy fuel demand for specialized products. The rise of e-commerce platforms provides convenient access to these products for expectant and new mothers, further boosting market penetration. The expanding middle class in developing economies, particularly in Asia-Pacific, is also contributing significantly to the market's growth trajectory. However, factors such as price sensitivity in certain regions and the availability of affordable generic alternatives pose challenges to consistent growth. The market is segmented by product type (with stretch mark minimizers and pregnancy test kits likely commanding significant shares) and distribution channels, with online sales and independent pharmacies showcasing notable growth potentials. Competition is fierce among established players like Procter & Gamble and Clarins, alongside smaller niche players focusing on organic and natural formulations. The market's future hinges on product innovation (e.g., organic and hypoallergenic formulations, advanced technologies for stretch mark reduction), effective marketing strategies targeting specific maternal health concerns, and expansion into untapped regions.
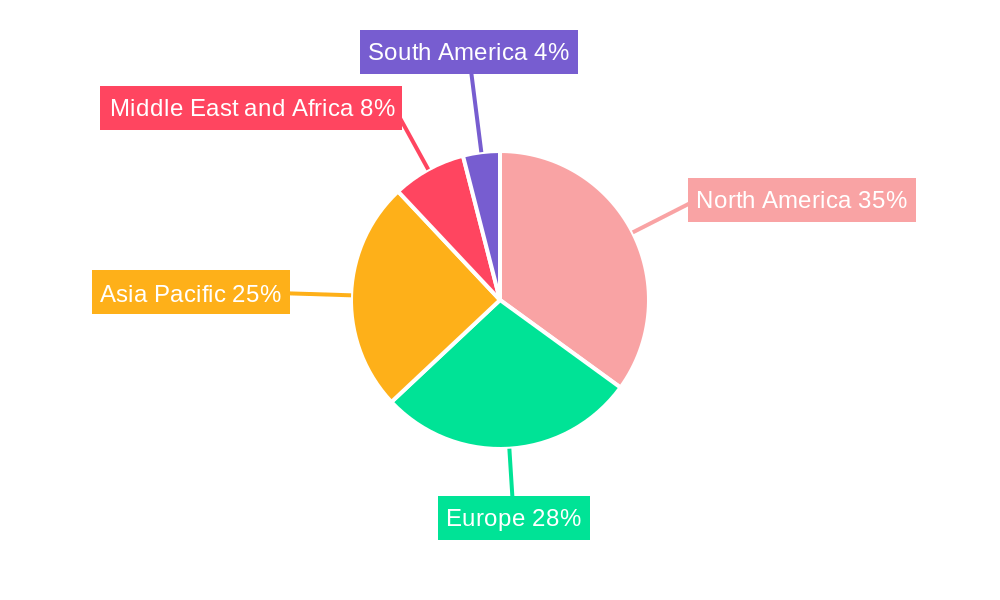
The market's regional distribution reflects varying levels of economic development and healthcare infrastructure. North America and Europe currently hold substantial market shares, driven by higher disposable incomes and greater awareness of maternal wellness products. However, the Asia-Pacific region demonstrates significant growth potential due to its large and expanding population of expectant mothers. To capitalize on this, companies need to develop products tailored to regional preferences and price points. Strategic partnerships with healthcare providers and effective digital marketing campaigns will be crucial in penetrating these markets. The forecast period of 2025-2033 promises continuous expansion, driven by ongoing demographic shifts, technological advancements in product formulation and distribution, and a growing emphasis on maternal well-being across the globe.
Pregnant Industry Market Report: 2019-2033
This comprehensive report provides a detailed analysis of the Pregnant Industry market, offering invaluable insights for stakeholders seeking to navigate this dynamic sector. With a focus on key market segments, leading players, and future growth prospects, this report is essential for strategic decision-making. The report covers the period 2019-2033, with 2025 as the base and estimated year. The market is valued at xx Million in 2025 and is projected to reach xx Million by 2033, exhibiting a CAGR of xx%.
Pregnant Industry Market Dynamics & Concentration
The Pregnant Industry, encompassing products and services catering to the needs of pregnant women, is a rapidly evolving market characterized by moderate concentration. While a few large multinational companies hold significant market share, a substantial number of smaller players, particularly in niche segments like specialized skincare, contribute to market vibrancy. Market share distribution is dynamic, influenced by product innovation, regulatory changes, and successful marketing campaigns. The historical period (2019-2024) witnessed an average of xx M&A deals per year, indicating significant consolidation activity. This trend is expected to continue, driven by the desire for economies of scale and expanded product portfolios.
- Market Concentration: The Herfindahl-Hirschman Index (HHI) for the Pregnant Industry in 2024 was estimated at xx, indicating a moderately concentrated market.
- Innovation Drivers: Continuous R&D efforts focused on enhancing product efficacy, safety, and user experience are key drivers. The introduction of technologically advanced diagnostic tools and personalized solutions fuels innovation.
- Regulatory Frameworks: Stringent regulatory compliance concerning product safety and efficacy, particularly for diagnostic kits and pharmaceuticals, shapes market dynamics. Variations in regulations across different geographies impact market access and competitive landscape.
- Product Substitutes: The availability of generic alternatives and the rising popularity of home remedies and natural products pose a competitive challenge to branded products.
- End-User Trends: Increasing health awareness among pregnant women and the growing preference for natural and organic products drive demand. Direct-to-consumer (DTC) marketing strategies are gaining traction.
- M&A Activities: Consolidation within the Pregnant Industry is anticipated to accelerate in the forecast period (2025-2033), with an estimated xx M&A deals annually. Larger players are expected to acquire smaller, specialized companies to broaden their product offerings and expand their market reach.
Pregnant Industry Industry Trends & Analysis
The Pregnant Industry is experiencing robust growth, fueled by several key factors. Rising global birth rates, increased disposable incomes in developing economies, and growing awareness of prenatal care contribute significantly to market expansion. Technological advancements, particularly in diagnostic testing and personalized healthcare solutions, are revolutionizing the industry. Consumer preferences are shifting towards natural and organic products, driving demand for eco-friendly and ethically sourced options. The competitive landscape is characterized by both established multinational players and innovative startups, leading to continuous product innovation and intense competition. The market demonstrates a strong preference for online channels, further fueling growth and market penetration. The market is experiencing a CAGR of xx% during the forecast period (2025-2033), with a projected market penetration rate of xx% by 2033.
Leading Markets & Segments in Pregnant Industry
The North American market holds a dominant position in the global Pregnant Industry, driven by high per capita healthcare expenditure and a strong regulatory framework. Within product segments, Pregnancy Test Kits represent the largest market share, followed by Stretch Mark Minimizers. Online distribution channels are witnessing the fastest growth, exceeding the growth rate of traditional channels like hospital and independent pharmacies.
Key Drivers for North American Dominance:
- High disposable incomes
- Advanced healthcare infrastructure
- Strong regulatory support for innovation
- High awareness of prenatal health
Dominant Product Segments:
- Pregnancy Test Kits: High demand due to increasing awareness of early pregnancy detection and the convenience of home testing.
- Stretch Mark Minimizers: Growing demand owing to increasing awareness of preventative measures and cosmetic concerns.
- Toning and Body Firming Gel & Restructuring Gel: Driven by the increasing desire to maintain body shape and appearance post-pregnancy.
Fastest-Growing Distribution Channel:
- Online: The ease of access, wider product variety, and discreet nature of online purchases contribute to its rapid expansion.
Pregnant Industry Product Developments
Recent years have witnessed significant advancements in Pregnant Industry products. The introduction of more accurate and sensitive pregnancy test kits, the development of non-invasive prenatal diagnostic tools, and the emergence of personalized skincare solutions tailored to specific skin types and pregnancy-related concerns represent key innovations. These advancements leverage technological breakthroughs in areas like molecular diagnostics and bioinformatics. The market is seeing a transition from traditional, generic products towards targeted, personalized offerings that enhance efficacy and meet specific consumer needs.
Key Drivers of Pregnant Industry Growth
Several factors are driving the growth of the Pregnant Industry. Technological advancements leading to the development of safer, more effective, and user-friendly products are a primary driver. Rising awareness about prenatal and postnatal care, coupled with increasing disposable incomes in emerging economies, significantly contributes to market expansion. Supportive government regulations and initiatives aimed at promoting maternal health further stimulate market growth. For example, the increased investment in healthcare infrastructure in developing countries is creating opportunities for growth in the Pregnant Industry.
Challenges in the Pregnant Industry Market
The Pregnant Industry faces various challenges. Stringent regulatory requirements regarding product safety and efficacy increase the cost and time associated with product development and launch. Supply chain disruptions, particularly concerning raw materials and manufacturing, can impact product availability and pricing. Intense competition from both established players and emerging startups puts pressure on profit margins. For example, the impact of COVID-19 on global supply chains led to increased production costs and delays in product delivery, affecting market growth by an estimated xx Million in 2022.
Emerging Opportunities in Pregnant Industry
Significant opportunities exist for growth in the Pregnant Industry. Technological advancements such as artificial intelligence (AI)-driven diagnostic tools and personalized medicine solutions offer potential for enhanced accuracy and improved patient outcomes. Strategic partnerships between healthcare providers, technology companies, and product manufacturers can create synergistic value. Expanding into underserved markets and focusing on emerging economies with growing birth rates presents considerable market expansion potential. Furthermore, the growing focus on sustainability and eco-friendly products presents a significant opportunity for companies to differentiate themselves and capture market share.
Leading Players in the Pregnant Industry Sector
- Clarins Group
- Oscar Medicare Pvt Ltd
- Germaine Laboratories
- Expanscience Laboratories Inc
- Quidel Corporation
- Church & Dwight Co Inc
- Piramal Enterprises
- Procter & Gamble
- E T Browne Drug Co Inc
- Mankind Pharma
- Abbott
- Novena Maternal Skin Care
- Noodle and Boo LLC
- Nine Naturals LLC
- Mama Mio US Inc
Key Milestones in Pregnant Industry Industry
- September 2022: Frida Mom launched a new skincare line exclusively for pregnant women in the United States, expanding the market for specialized skincare products.
- May 2022: Mirvie raised USD 90 Million in Series B funding, boosting innovation in early pregnancy risk prediction through its proprietary RNA platform. This demonstrates a significant investment in the technological advancement of the industry.
Strategic Outlook for Pregnant Industry Market
The Pregnant Industry is poised for sustained growth, driven by technological innovation, increasing healthcare awareness, and expanding market access in developing economies. Strategic opportunities exist for companies focusing on personalized products, digital health solutions, and sustainable practices. Focusing on early risk detection, enhancing product efficacy, and optimizing distribution channels will be crucial for achieving long-term success in this competitive landscape. The continued expansion into emerging markets offers significant potential for market growth and revenue generation.
Pregnant Industry Segmentation
-
1. Product
- 1.1. Stretch Mark Minimizers
- 1.2. Pregnancy Test Kits
- 1.3. Toning and Body Firming Gel
- 1.4. Restructuring Gel
- 1.5. Other Products
-
2. Distribution Channel
- 2.1. Hospital Pharmacies
- 2.2. Independent Pharmacies and Drug Stores
- 2.3. Online
Pregnant Industry Segmentation By Geography
-
1. North America
- 1.1. United States
- 1.2. Canada
- 1.3. Mexico
-
2. Europe
- 2.1. Germany
- 2.2. United Kingdom
- 2.3. France
- 2.4. Italy
- 2.5. Spain
- 2.6. Rest of Europe
-
3. Asia Pacific
- 3.1. China
- 3.2. Japan
- 3.3. India
- 3.4. Australia
- 3.5. South Korea
- 3.6. Rest of Asia Pacific
-
4. Middle East and Africa
- 4.1. GCC
- 4.2. South Africa
- 4.3. Rest of Middle East and Africa
-
5. South America
- 5.1. Brazil
- 5.2. Argentina
- 5.3. Rest of South America
Pregnant Industry REPORT HIGHLIGHTS
| Aspects | Details |
|---|---|
| Study Period | 2019-2033 |
| Base Year | 2024 |
| Estimated Year | 2025 |
| Forecast Period | 2025-2033 |
| Historical Period | 2019-2024 |
| Growth Rate | CAGR of 5.50% from 2019-2033 |
| Segmentation |
|
Table of Contents
- 1. Introduction
- 1.1. Research Scope
- 1.2. Market Segmentation
- 1.3. Research Methodology
- 1.4. Definitions and Assumptions
- 2. Executive Summary
- 2.1. Introduction
- 3. Market Dynamics
- 3.1. Introduction
- 3.2. Market Drivers
- 3.2.1. Introduction of Organic Pregnancy Care Products; Increasing Awareness Regarding Pregnancy Care Products
- 3.3. Market Restrains
- 3.3.1. Side Effects Associated with Pregnancy Products; Lack of Awareness and Unavailability of Pregnancy Products in Low-income Countries
- 3.4. Market Trends
- 3.4.1. The Stretch Mark Minimizer Segment is Expected to Register Robust Growth Over the Forecast Period
- 4. Market Factor Analysis
- 4.1. Porters Five Forces
- 4.2. Supply/Value Chain
- 4.3. PESTEL analysis
- 4.4. Market Entropy
- 4.5. Patent/Trademark Analysis
- 5. Global Pregnant Industry Analysis, Insights and Forecast, 2019-2031
- 5.1. Market Analysis, Insights and Forecast - by Product
- 5.1.1. Stretch Mark Minimizers
- 5.1.2. Pregnancy Test Kits
- 5.1.3. Toning and Body Firming Gel
- 5.1.4. Restructuring Gel
- 5.1.5. Other Products
- 5.2. Market Analysis, Insights and Forecast - by Distribution Channel
- 5.2.1. Hospital Pharmacies
- 5.2.2. Independent Pharmacies and Drug Stores
- 5.2.3. Online
- 5.3. Market Analysis, Insights and Forecast - by Region
- 5.3.1. North America
- 5.3.2. Europe
- 5.3.3. Asia Pacific
- 5.3.4. Middle East and Africa
- 5.3.5. South America
- 5.1. Market Analysis, Insights and Forecast - by Product
- 6. North America Pregnant Industry Analysis, Insights and Forecast, 2019-2031
- 6.1. Market Analysis, Insights and Forecast - by Product
- 6.1.1. Stretch Mark Minimizers
- 6.1.2. Pregnancy Test Kits
- 6.1.3. Toning and Body Firming Gel
- 6.1.4. Restructuring Gel
- 6.1.5. Other Products
- 6.2. Market Analysis, Insights and Forecast - by Distribution Channel
- 6.2.1. Hospital Pharmacies
- 6.2.2. Independent Pharmacies and Drug Stores
- 6.2.3. Online
- 6.1. Market Analysis, Insights and Forecast - by Product
- 7. Europe Pregnant Industry Analysis, Insights and Forecast, 2019-2031
- 7.1. Market Analysis, Insights and Forecast - by Product
- 7.1.1. Stretch Mark Minimizers
- 7.1.2. Pregnancy Test Kits
- 7.1.3. Toning and Body Firming Gel
- 7.1.4. Restructuring Gel
- 7.1.5. Other Products
- 7.2. Market Analysis, Insights and Forecast - by Distribution Channel
- 7.2.1. Hospital Pharmacies
- 7.2.2. Independent Pharmacies and Drug Stores
- 7.2.3. Online
- 7.1. Market Analysis, Insights and Forecast - by Product
- 8. Asia Pacific Pregnant Industry Analysis, Insights and Forecast, 2019-2031
- 8.1. Market Analysis, Insights and Forecast - by Product
- 8.1.1. Stretch Mark Minimizers
- 8.1.2. Pregnancy Test Kits
- 8.1.3. Toning and Body Firming Gel
- 8.1.4. Restructuring Gel
- 8.1.5. Other Products
- 8.2. Market Analysis, Insights and Forecast - by Distribution Channel
- 8.2.1. Hospital Pharmacies
- 8.2.2. Independent Pharmacies and Drug Stores
- 8.2.3. Online
- 8.1. Market Analysis, Insights and Forecast - by Product
- 9. Middle East and Africa Pregnant Industry Analysis, Insights and Forecast, 2019-2031
- 9.1. Market Analysis, Insights and Forecast - by Product
- 9.1.1. Stretch Mark Minimizers
- 9.1.2. Pregnancy Test Kits
- 9.1.3. Toning and Body Firming Gel
- 9.1.4. Restructuring Gel
- 9.1.5. Other Products
- 9.2. Market Analysis, Insights and Forecast - by Distribution Channel
- 9.2.1. Hospital Pharmacies
- 9.2.2. Independent Pharmacies and Drug Stores
- 9.2.3. Online
- 9.1. Market Analysis, Insights and Forecast - by Product
- 10. South America Pregnant Industry Analysis, Insights and Forecast, 2019-2031
- 10.1. Market Analysis, Insights and Forecast - by Product
- 10.1.1. Stretch Mark Minimizers
- 10.1.2. Pregnancy Test Kits
- 10.1.3. Toning and Body Firming Gel
- 10.1.4. Restructuring Gel
- 10.1.5. Other Products
- 10.2. Market Analysis, Insights and Forecast - by Distribution Channel
- 10.2.1. Hospital Pharmacies
- 10.2.2. Independent Pharmacies and Drug Stores
- 10.2.3. Online
- 10.1. Market Analysis, Insights and Forecast - by Product
- 11. North America Pregnant Industry Analysis, Insights and Forecast, 2019-2031
- 11.1. Market Analysis, Insights and Forecast - By Country/Sub-region
- 11.1.1 United States
- 11.1.2 Canada
- 11.1.3 Mexico
- 12. Europe Pregnant Industry Analysis, Insights and Forecast, 2019-2031
- 12.1. Market Analysis, Insights and Forecast - By Country/Sub-region
- 12.1.1 Germany
- 12.1.2 United Kingdom
- 12.1.3 France
- 12.1.4 Italy
- 12.1.5 Spain
- 12.1.6 Rest of Europe
- 13. Asia Pacific Pregnant Industry Analysis, Insights and Forecast, 2019-2031
- 13.1. Market Analysis, Insights and Forecast - By Country/Sub-region
- 13.1.1 China
- 13.1.2 Japan
- 13.1.3 India
- 13.1.4 Australia
- 13.1.5 South Korea
- 13.1.6 Rest of Asia Pacific
- 14. Middle East and Africa Pregnant Industry Analysis, Insights and Forecast, 2019-2031
- 14.1. Market Analysis, Insights and Forecast - By Country/Sub-region
- 14.1.1 GCC
- 14.1.2 South Africa
- 14.1.3 Rest of Middle East and Africa
- 15. South America Pregnant Industry Analysis, Insights and Forecast, 2019-2031
- 15.1. Market Analysis, Insights and Forecast - By Country/Sub-region
- 15.1.1 Brazil
- 15.1.2 Argentina
- 15.1.3 Rest of South America
- 16. Competitive Analysis
- 16.1. Global Market Share Analysis 2024
- 16.2. Company Profiles
- 16.2.1 Clarins Group
- 16.2.1.1. Overview
- 16.2.1.2. Products
- 16.2.1.3. SWOT Analysis
- 16.2.1.4. Recent Developments
- 16.2.1.5. Financials (Based on Availability)
- 16.2.2 Oscar Medicare Pvt Ltd
- 16.2.2.1. Overview
- 16.2.2.2. Products
- 16.2.2.3. SWOT Analysis
- 16.2.2.4. Recent Developments
- 16.2.2.5. Financials (Based on Availability)
- 16.2.3 Germaine Laboratories
- 16.2.3.1. Overview
- 16.2.3.2. Products
- 16.2.3.3. SWOT Analysis
- 16.2.3.4. Recent Developments
- 16.2.3.5. Financials (Based on Availability)
- 16.2.4 Expansxience Laboratories Inc
- 16.2.4.1. Overview
- 16.2.4.2. Products
- 16.2.4.3. SWOT Analysis
- 16.2.4.4. Recent Developments
- 16.2.4.5. Financials (Based on Availability)
- 16.2.5 Quidel Corporation
- 16.2.5.1. Overview
- 16.2.5.2. Products
- 16.2.5.3. SWOT Analysis
- 16.2.5.4. Recent Developments
- 16.2.5.5. Financials (Based on Availability)
- 16.2.6 Church & Dwight Co Inc
- 16.2.6.1. Overview
- 16.2.6.2. Products
- 16.2.6.3. SWOT Analysis
- 16.2.6.4. Recent Developments
- 16.2.6.5. Financials (Based on Availability)
- 16.2.7 Piramal Enterprises
- 16.2.7.1. Overview
- 16.2.7.2. Products
- 16.2.7.3. SWOT Analysis
- 16.2.7.4. Recent Developments
- 16.2.7.5. Financials (Based on Availability)
- 16.2.8 Procter & Gamble
- 16.2.8.1. Overview
- 16.2.8.2. Products
- 16.2.8.3. SWOT Analysis
- 16.2.8.4. Recent Developments
- 16.2.8.5. Financials (Based on Availability)
- 16.2.9 E T Browne Drug Co Inc
- 16.2.9.1. Overview
- 16.2.9.2. Products
- 16.2.9.3. SWOT Analysis
- 16.2.9.4. Recent Developments
- 16.2.9.5. Financials (Based on Availability)
- 16.2.10 Mankind Pharma
- 16.2.10.1. Overview
- 16.2.10.2. Products
- 16.2.10.3. SWOT Analysis
- 16.2.10.4. Recent Developments
- 16.2.10.5. Financials (Based on Availability)
- 16.2.11 Abbott
- 16.2.11.1. Overview
- 16.2.11.2. Products
- 16.2.11.3. SWOT Analysis
- 16.2.11.4. Recent Developments
- 16.2.11.5. Financials (Based on Availability)
- 16.2.12 Novena Maternal Skin Care
- 16.2.12.1. Overview
- 16.2.12.2. Products
- 16.2.12.3. SWOT Analysis
- 16.2.12.4. Recent Developments
- 16.2.12.5. Financials (Based on Availability)
- 16.2.13 Noodle and Boo LLC
- 16.2.13.1. Overview
- 16.2.13.2. Products
- 16.2.13.3. SWOT Analysis
- 16.2.13.4. Recent Developments
- 16.2.13.5. Financials (Based on Availability)
- 16.2.14 Nine Naturals LLC
- 16.2.14.1. Overview
- 16.2.14.2. Products
- 16.2.14.3. SWOT Analysis
- 16.2.14.4. Recent Developments
- 16.2.14.5. Financials (Based on Availability)
- 16.2.15 Mama Mio US Inc
- 16.2.15.1. Overview
- 16.2.15.2. Products
- 16.2.15.3. SWOT Analysis
- 16.2.15.4. Recent Developments
- 16.2.15.5. Financials (Based on Availability)
- 16.2.1 Clarins Group
List of Figures
- Figure 1: Global Pregnant Industry Revenue Breakdown (Million, %) by Region 2024 & 2032
- Figure 2: Global Pregnant Industry Volume Breakdown (K Unit, %) by Region 2024 & 2032
- Figure 3: North America Pregnant Industry Revenue (Million), by Country 2024 & 2032
- Figure 4: North America Pregnant Industry Volume (K Unit), by Country 2024 & 2032
- Figure 5: North America Pregnant Industry Revenue Share (%), by Country 2024 & 2032
- Figure 6: North America Pregnant Industry Volume Share (%), by Country 2024 & 2032
- Figure 7: Europe Pregnant Industry Revenue (Million), by Country 2024 & 2032
- Figure 8: Europe Pregnant Industry Volume (K Unit), by Country 2024 & 2032
- Figure 9: Europe Pregnant Industry Revenue Share (%), by Country 2024 & 2032
- Figure 10: Europe Pregnant Industry Volume Share (%), by Country 2024 & 2032
- Figure 11: Asia Pacific Pregnant Industry Revenue (Million), by Country 2024 & 2032
- Figure 12: Asia Pacific Pregnant Industry Volume (K Unit), by Country 2024 & 2032
- Figure 13: Asia Pacific Pregnant Industry Revenue Share (%), by Country 2024 & 2032
- Figure 14: Asia Pacific Pregnant Industry Volume Share (%), by Country 2024 & 2032
- Figure 15: Middle East and Africa Pregnant Industry Revenue (Million), by Country 2024 & 2032
- Figure 16: Middle East and Africa Pregnant Industry Volume (K Unit), by Country 2024 & 2032
- Figure 17: Middle East and Africa Pregnant Industry Revenue Share (%), by Country 2024 & 2032
- Figure 18: Middle East and Africa Pregnant Industry Volume Share (%), by Country 2024 & 2032
- Figure 19: South America Pregnant Industry Revenue (Million), by Country 2024 & 2032
- Figure 20: South America Pregnant Industry Volume (K Unit), by Country 2024 & 2032
- Figure 21: South America Pregnant Industry Revenue Share (%), by Country 2024 & 2032
- Figure 22: South America Pregnant Industry Volume Share (%), by Country 2024 & 2032
- Figure 23: North America Pregnant Industry Revenue (Million), by Product 2024 & 2032
- Figure 24: North America Pregnant Industry Volume (K Unit), by Product 2024 & 2032
- Figure 25: North America Pregnant Industry Revenue Share (%), by Product 2024 & 2032
- Figure 26: North America Pregnant Industry Volume Share (%), by Product 2024 & 2032
- Figure 27: North America Pregnant Industry Revenue (Million), by Distribution Channel 2024 & 2032
- Figure 28: North America Pregnant Industry Volume (K Unit), by Distribution Channel 2024 & 2032
- Figure 29: North America Pregnant Industry Revenue Share (%), by Distribution Channel 2024 & 2032
- Figure 30: North America Pregnant Industry Volume Share (%), by Distribution Channel 2024 & 2032
- Figure 31: North America Pregnant Industry Revenue (Million), by Country 2024 & 2032
- Figure 32: North America Pregnant Industry Volume (K Unit), by Country 2024 & 2032
- Figure 33: North America Pregnant Industry Revenue Share (%), by Country 2024 & 2032
- Figure 34: North America Pregnant Industry Volume Share (%), by Country 2024 & 2032
- Figure 35: Europe Pregnant Industry Revenue (Million), by Product 2024 & 2032
- Figure 36: Europe Pregnant Industry Volume (K Unit), by Product 2024 & 2032
- Figure 37: Europe Pregnant Industry Revenue Share (%), by Product 2024 & 2032
- Figure 38: Europe Pregnant Industry Volume Share (%), by Product 2024 & 2032
- Figure 39: Europe Pregnant Industry Revenue (Million), by Distribution Channel 2024 & 2032
- Figure 40: Europe Pregnant Industry Volume (K Unit), by Distribution Channel 2024 & 2032
- Figure 41: Europe Pregnant Industry Revenue Share (%), by Distribution Channel 2024 & 2032
- Figure 42: Europe Pregnant Industry Volume Share (%), by Distribution Channel 2024 & 2032
- Figure 43: Europe Pregnant Industry Revenue (Million), by Country 2024 & 2032
- Figure 44: Europe Pregnant Industry Volume (K Unit), by Country 2024 & 2032
- Figure 45: Europe Pregnant Industry Revenue Share (%), by Country 2024 & 2032
- Figure 46: Europe Pregnant Industry Volume Share (%), by Country 2024 & 2032
- Figure 47: Asia Pacific Pregnant Industry Revenue (Million), by Product 2024 & 2032
- Figure 48: Asia Pacific Pregnant Industry Volume (K Unit), by Product 2024 & 2032
- Figure 49: Asia Pacific Pregnant Industry Revenue Share (%), by Product 2024 & 2032
- Figure 50: Asia Pacific Pregnant Industry Volume Share (%), by Product 2024 & 2032
- Figure 51: Asia Pacific Pregnant Industry Revenue (Million), by Distribution Channel 2024 & 2032
- Figure 52: Asia Pacific Pregnant Industry Volume (K Unit), by Distribution Channel 2024 & 2032
- Figure 53: Asia Pacific Pregnant Industry Revenue Share (%), by Distribution Channel 2024 & 2032
- Figure 54: Asia Pacific Pregnant Industry Volume Share (%), by Distribution Channel 2024 & 2032
- Figure 55: Asia Pacific Pregnant Industry Revenue (Million), by Country 2024 & 2032
- Figure 56: Asia Pacific Pregnant Industry Volume (K Unit), by Country 2024 & 2032
- Figure 57: Asia Pacific Pregnant Industry Revenue Share (%), by Country 2024 & 2032
- Figure 58: Asia Pacific Pregnant Industry Volume Share (%), by Country 2024 & 2032
- Figure 59: Middle East and Africa Pregnant Industry Revenue (Million), by Product 2024 & 2032
- Figure 60: Middle East and Africa Pregnant Industry Volume (K Unit), by Product 2024 & 2032
- Figure 61: Middle East and Africa Pregnant Industry Revenue Share (%), by Product 2024 & 2032
- Figure 62: Middle East and Africa Pregnant Industry Volume Share (%), by Product 2024 & 2032
- Figure 63: Middle East and Africa Pregnant Industry Revenue (Million), by Distribution Channel 2024 & 2032
- Figure 64: Middle East and Africa Pregnant Industry Volume (K Unit), by Distribution Channel 2024 & 2032
- Figure 65: Middle East and Africa Pregnant Industry Revenue Share (%), by Distribution Channel 2024 & 2032
- Figure 66: Middle East and Africa Pregnant Industry Volume Share (%), by Distribution Channel 2024 & 2032
- Figure 67: Middle East and Africa Pregnant Industry Revenue (Million), by Country 2024 & 2032
- Figure 68: Middle East and Africa Pregnant Industry Volume (K Unit), by Country 2024 & 2032
- Figure 69: Middle East and Africa Pregnant Industry Revenue Share (%), by Country 2024 & 2032
- Figure 70: Middle East and Africa Pregnant Industry Volume Share (%), by Country 2024 & 2032
- Figure 71: South America Pregnant Industry Revenue (Million), by Product 2024 & 2032
- Figure 72: South America Pregnant Industry Volume (K Unit), by Product 2024 & 2032
- Figure 73: South America Pregnant Industry Revenue Share (%), by Product 2024 & 2032
- Figure 74: South America Pregnant Industry Volume Share (%), by Product 2024 & 2032
- Figure 75: South America Pregnant Industry Revenue (Million), by Distribution Channel 2024 & 2032
- Figure 76: South America Pregnant Industry Volume (K Unit), by Distribution Channel 2024 & 2032
- Figure 77: South America Pregnant Industry Revenue Share (%), by Distribution Channel 2024 & 2032
- Figure 78: South America Pregnant Industry Volume Share (%), by Distribution Channel 2024 & 2032
- Figure 79: South America Pregnant Industry Revenue (Million), by Country 2024 & 2032
- Figure 80: South America Pregnant Industry Volume (K Unit), by Country 2024 & 2032
- Figure 81: South America Pregnant Industry Revenue Share (%), by Country 2024 & 2032
- Figure 82: South America Pregnant Industry Volume Share (%), by Country 2024 & 2032
List of Tables
- Table 1: Global Pregnant Industry Revenue Million Forecast, by Region 2019 & 2032
- Table 2: Global Pregnant Industry Volume K Unit Forecast, by Region 2019 & 2032
- Table 3: Global Pregnant Industry Revenue Million Forecast, by Product 2019 & 2032
- Table 4: Global Pregnant Industry Volume K Unit Forecast, by Product 2019 & 2032
- Table 5: Global Pregnant Industry Revenue Million Forecast, by Distribution Channel 2019 & 2032
- Table 6: Global Pregnant Industry Volume K Unit Forecast, by Distribution Channel 2019 & 2032
- Table 7: Global Pregnant Industry Revenue Million Forecast, by Region 2019 & 2032
- Table 8: Global Pregnant Industry Volume K Unit Forecast, by Region 2019 & 2032
- Table 9: Global Pregnant Industry Revenue Million Forecast, by Country 2019 & 2032
- Table 10: Global Pregnant Industry Volume K Unit Forecast, by Country 2019 & 2032
- Table 11: United States Pregnant Industry Revenue (Million) Forecast, by Application 2019 & 2032
- Table 12: United States Pregnant Industry Volume (K Unit) Forecast, by Application 2019 & 2032
- Table 13: Canada Pregnant Industry Revenue (Million) Forecast, by Application 2019 & 2032
- Table 14: Canada Pregnant Industry Volume (K Unit) Forecast, by Application 2019 & 2032
- Table 15: Mexico Pregnant Industry Revenue (Million) Forecast, by Application 2019 & 2032
- Table 16: Mexico Pregnant Industry Volume (K Unit) Forecast, by Application 2019 & 2032
- Table 17: Global Pregnant Industry Revenue Million Forecast, by Country 2019 & 2032
- Table 18: Global Pregnant Industry Volume K Unit Forecast, by Country 2019 & 2032
- Table 19: Germany Pregnant Industry Revenue (Million) Forecast, by Application 2019 & 2032
- Table 20: Germany Pregnant Industry Volume (K Unit) Forecast, by Application 2019 & 2032
- Table 21: United Kingdom Pregnant Industry Revenue (Million) Forecast, by Application 2019 & 2032
- Table 22: United Kingdom Pregnant Industry Volume (K Unit) Forecast, by Application 2019 & 2032
- Table 23: France Pregnant Industry Revenue (Million) Forecast, by Application 2019 & 2032
- Table 24: France Pregnant Industry Volume (K Unit) Forecast, by Application 2019 & 2032
- Table 25: Italy Pregnant Industry Revenue (Million) Forecast, by Application 2019 & 2032
- Table 26: Italy Pregnant Industry Volume (K Unit) Forecast, by Application 2019 & 2032
- Table 27: Spain Pregnant Industry Revenue (Million) Forecast, by Application 2019 & 2032
- Table 28: Spain Pregnant Industry Volume (K Unit) Forecast, by Application 2019 & 2032
- Table 29: Rest of Europe Pregnant Industry Revenue (Million) Forecast, by Application 2019 & 2032
- Table 30: Rest of Europe Pregnant Industry Volume (K Unit) Forecast, by Application 2019 & 2032
- Table 31: Global Pregnant Industry Revenue Million Forecast, by Country 2019 & 2032
- Table 32: Global Pregnant Industry Volume K Unit Forecast, by Country 2019 & 2032
- Table 33: China Pregnant Industry Revenue (Million) Forecast, by Application 2019 & 2032
- Table 34: China Pregnant Industry Volume (K Unit) Forecast, by Application 2019 & 2032
- Table 35: Japan Pregnant Industry Revenue (Million) Forecast, by Application 2019 & 2032
- Table 36: Japan Pregnant Industry Volume (K Unit) Forecast, by Application 2019 & 2032
- Table 37: India Pregnant Industry Revenue (Million) Forecast, by Application 2019 & 2032
- Table 38: India Pregnant Industry Volume (K Unit) Forecast, by Application 2019 & 2032
- Table 39: Australia Pregnant Industry Revenue (Million) Forecast, by Application 2019 & 2032
- Table 40: Australia Pregnant Industry Volume (K Unit) Forecast, by Application 2019 & 2032
- Table 41: South Korea Pregnant Industry Revenue (Million) Forecast, by Application 2019 & 2032
- Table 42: South Korea Pregnant Industry Volume (K Unit) Forecast, by Application 2019 & 2032
- Table 43: Rest of Asia Pacific Pregnant Industry Revenue (Million) Forecast, by Application 2019 & 2032
- Table 44: Rest of Asia Pacific Pregnant Industry Volume (K Unit) Forecast, by Application 2019 & 2032
- Table 45: Global Pregnant Industry Revenue Million Forecast, by Country 2019 & 2032
- Table 46: Global Pregnant Industry Volume K Unit Forecast, by Country 2019 & 2032
- Table 47: GCC Pregnant Industry Revenue (Million) Forecast, by Application 2019 & 2032
- Table 48: GCC Pregnant Industry Volume (K Unit) Forecast, by Application 2019 & 2032
- Table 49: South Africa Pregnant Industry Revenue (Million) Forecast, by Application 2019 & 2032
- Table 50: South Africa Pregnant Industry Volume (K Unit) Forecast, by Application 2019 & 2032
- Table 51: Rest of Middle East and Africa Pregnant Industry Revenue (Million) Forecast, by Application 2019 & 2032
- Table 52: Rest of Middle East and Africa Pregnant Industry Volume (K Unit) Forecast, by Application 2019 & 2032
- Table 53: Global Pregnant Industry Revenue Million Forecast, by Country 2019 & 2032
- Table 54: Global Pregnant Industry Volume K Unit Forecast, by Country 2019 & 2032
- Table 55: Brazil Pregnant Industry Revenue (Million) Forecast, by Application 2019 & 2032
- Table 56: Brazil Pregnant Industry Volume (K Unit) Forecast, by Application 2019 & 2032
- Table 57: Argentina Pregnant Industry Revenue (Million) Forecast, by Application 2019 & 2032
- Table 58: Argentina Pregnant Industry Volume (K Unit) Forecast, by Application 2019 & 2032
- Table 59: Rest of South America Pregnant Industry Revenue (Million) Forecast, by Application 2019 & 2032
- Table 60: Rest of South America Pregnant Industry Volume (K Unit) Forecast, by Application 2019 & 2032
- Table 61: Global Pregnant Industry Revenue Million Forecast, by Product 2019 & 2032
- Table 62: Global Pregnant Industry Volume K Unit Forecast, by Product 2019 & 2032
- Table 63: Global Pregnant Industry Revenue Million Forecast, by Distribution Channel 2019 & 2032
- Table 64: Global Pregnant Industry Volume K Unit Forecast, by Distribution Channel 2019 & 2032
- Table 65: Global Pregnant Industry Revenue Million Forecast, by Country 2019 & 2032
- Table 66: Global Pregnant Industry Volume K Unit Forecast, by Country 2019 & 2032
- Table 67: United States Pregnant Industry Revenue (Million) Forecast, by Application 2019 & 2032
- Table 68: United States Pregnant Industry Volume (K Unit) Forecast, by Application 2019 & 2032
- Table 69: Canada Pregnant Industry Revenue (Million) Forecast, by Application 2019 & 2032
- Table 70: Canada Pregnant Industry Volume (K Unit) Forecast, by Application 2019 & 2032
- Table 71: Mexico Pregnant Industry Revenue (Million) Forecast, by Application 2019 & 2032
- Table 72: Mexico Pregnant Industry Volume (K Unit) Forecast, by Application 2019 & 2032
- Table 73: Global Pregnant Industry Revenue Million Forecast, by Product 2019 & 2032
- Table 74: Global Pregnant Industry Volume K Unit Forecast, by Product 2019 & 2032
- Table 75: Global Pregnant Industry Revenue Million Forecast, by Distribution Channel 2019 & 2032
- Table 76: Global Pregnant Industry Volume K Unit Forecast, by Distribution Channel 2019 & 2032
- Table 77: Global Pregnant Industry Revenue Million Forecast, by Country 2019 & 2032
- Table 78: Global Pregnant Industry Volume K Unit Forecast, by Country 2019 & 2032
- Table 79: Germany Pregnant Industry Revenue (Million) Forecast, by Application 2019 & 2032
- Table 80: Germany Pregnant Industry Volume (K Unit) Forecast, by Application 2019 & 2032
- Table 81: United Kingdom Pregnant Industry Revenue (Million) Forecast, by Application 2019 & 2032
- Table 82: United Kingdom Pregnant Industry Volume (K Unit) Forecast, by Application 2019 & 2032
- Table 83: France Pregnant Industry Revenue (Million) Forecast, by Application 2019 & 2032
- Table 84: France Pregnant Industry Volume (K Unit) Forecast, by Application 2019 & 2032
- Table 85: Italy Pregnant Industry Revenue (Million) Forecast, by Application 2019 & 2032
- Table 86: Italy Pregnant Industry Volume (K Unit) Forecast, by Application 2019 & 2032
- Table 87: Spain Pregnant Industry Revenue (Million) Forecast, by Application 2019 & 2032
- Table 88: Spain Pregnant Industry Volume (K Unit) Forecast, by Application 2019 & 2032
- Table 89: Rest of Europe Pregnant Industry Revenue (Million) Forecast, by Application 2019 & 2032
- Table 90: Rest of Europe Pregnant Industry Volume (K Unit) Forecast, by Application 2019 & 2032
- Table 91: Global Pregnant Industry Revenue Million Forecast, by Product 2019 & 2032
- Table 92: Global Pregnant Industry Volume K Unit Forecast, by Product 2019 & 2032
- Table 93: Global Pregnant Industry Revenue Million Forecast, by Distribution Channel 2019 & 2032
- Table 94: Global Pregnant Industry Volume K Unit Forecast, by Distribution Channel 2019 & 2032
- Table 95: Global Pregnant Industry Revenue Million Forecast, by Country 2019 & 2032
- Table 96: Global Pregnant Industry Volume K Unit Forecast, by Country 2019 & 2032
- Table 97: China Pregnant Industry Revenue (Million) Forecast, by Application 2019 & 2032
- Table 98: China Pregnant Industry Volume (K Unit) Forecast, by Application 2019 & 2032
- Table 99: Japan Pregnant Industry Revenue (Million) Forecast, by Application 2019 & 2032
- Table 100: Japan Pregnant Industry Volume (K Unit) Forecast, by Application 2019 & 2032
- Table 101: India Pregnant Industry Revenue (Million) Forecast, by Application 2019 & 2032
- Table 102: India Pregnant Industry Volume (K Unit) Forecast, by Application 2019 & 2032
- Table 103: Australia Pregnant Industry Revenue (Million) Forecast, by Application 2019 & 2032
- Table 104: Australia Pregnant Industry Volume (K Unit) Forecast, by Application 2019 & 2032
- Table 105: South Korea Pregnant Industry Revenue (Million) Forecast, by Application 2019 & 2032
- Table 106: South Korea Pregnant Industry Volume (K Unit) Forecast, by Application 2019 & 2032
- Table 107: Rest of Asia Pacific Pregnant Industry Revenue (Million) Forecast, by Application 2019 & 2032
- Table 108: Rest of Asia Pacific Pregnant Industry Volume (K Unit) Forecast, by Application 2019 & 2032
- Table 109: Global Pregnant Industry Revenue Million Forecast, by Product 2019 & 2032
- Table 110: Global Pregnant Industry Volume K Unit Forecast, by Product 2019 & 2032
- Table 111: Global Pregnant Industry Revenue Million Forecast, by Distribution Channel 2019 & 2032
- Table 112: Global Pregnant Industry Volume K Unit Forecast, by Distribution Channel 2019 & 2032
- Table 113: Global Pregnant Industry Revenue Million Forecast, by Country 2019 & 2032
- Table 114: Global Pregnant Industry Volume K Unit Forecast, by Country 2019 & 2032
- Table 115: GCC Pregnant Industry Revenue (Million) Forecast, by Application 2019 & 2032
- Table 116: GCC Pregnant Industry Volume (K Unit) Forecast, by Application 2019 & 2032
- Table 117: South Africa Pregnant Industry Revenue (Million) Forecast, by Application 2019 & 2032
- Table 118: South Africa Pregnant Industry Volume (K Unit) Forecast, by Application 2019 & 2032
- Table 119: Rest of Middle East and Africa Pregnant Industry Revenue (Million) Forecast, by Application 2019 & 2032
- Table 120: Rest of Middle East and Africa Pregnant Industry Volume (K Unit) Forecast, by Application 2019 & 2032
- Table 121: Global Pregnant Industry Revenue Million Forecast, by Product 2019 & 2032
- Table 122: Global Pregnant Industry Volume K Unit Forecast, by Product 2019 & 2032
- Table 123: Global Pregnant Industry Revenue Million Forecast, by Distribution Channel 2019 & 2032
- Table 124: Global Pregnant Industry Volume K Unit Forecast, by Distribution Channel 2019 & 2032
- Table 125: Global Pregnant Industry Revenue Million Forecast, by Country 2019 & 2032
- Table 126: Global Pregnant Industry Volume K Unit Forecast, by Country 2019 & 2032
- Table 127: Brazil Pregnant Industry Revenue (Million) Forecast, by Application 2019 & 2032
- Table 128: Brazil Pregnant Industry Volume (K Unit) Forecast, by Application 2019 & 2032
- Table 129: Argentina Pregnant Industry Revenue (Million) Forecast, by Application 2019 & 2032
- Table 130: Argentina Pregnant Industry Volume (K Unit) Forecast, by Application 2019 & 2032
- Table 131: Rest of South America Pregnant Industry Revenue (Million) Forecast, by Application 2019 & 2032
- Table 132: Rest of South America Pregnant Industry Volume (K Unit) Forecast, by Application 2019 & 2032
Frequently Asked Questions
1. What is the projected Compound Annual Growth Rate (CAGR) of the Pregnant Industry?
The projected CAGR is approximately 5.50%.
2. Which companies are prominent players in the Pregnant Industry?
Key companies in the market include Clarins Group, Oscar Medicare Pvt Ltd, Germaine Laboratories, Expansxience Laboratories Inc, Quidel Corporation, Church & Dwight Co Inc, Piramal Enterprises, Procter & Gamble, E T Browne Drug Co Inc, Mankind Pharma, Abbott, Novena Maternal Skin Care, Noodle and Boo LLC, Nine Naturals LLC, Mama Mio US Inc.
3. What are the main segments of the Pregnant Industry?
The market segments include Product, Distribution Channel.
4. Can you provide details about the market size?
The market size is estimated to be USD XX Million as of 2022.
5. What are some drivers contributing to market growth?
Introduction of Organic Pregnancy Care Products; Increasing Awareness Regarding Pregnancy Care Products.
6. What are the notable trends driving market growth?
The Stretch Mark Minimizer Segment is Expected to Register Robust Growth Over the Forecast Period.
7. Are there any restraints impacting market growth?
Side Effects Associated with Pregnancy Products; Lack of Awareness and Unavailability of Pregnancy Products in Low-income Countries.
8. Can you provide examples of recent developments in the market?
In September 2022, Frida Mom launched a new skincare line exclusively for pregnant women in the United States.
9. What pricing options are available for accessing the report?
Pricing options include single-user, multi-user, and enterprise licenses priced at USD 4750, USD 5250, and USD 8750 respectively.
10. Is the market size provided in terms of value or volume?
The market size is provided in terms of value, measured in Million and volume, measured in K Unit.
11. Are there any specific market keywords associated with the report?
Yes, the market keyword associated with the report is "Pregnant Industry," which aids in identifying and referencing the specific market segment covered.
12. How do I determine which pricing option suits my needs best?
The pricing options vary based on user requirements and access needs. Individual users may opt for single-user licenses, while businesses requiring broader access may choose multi-user or enterprise licenses for cost-effective access to the report.
13. Are there any additional resources or data provided in the Pregnant Industry report?
While the report offers comprehensive insights, it's advisable to review the specific contents or supplementary materials provided to ascertain if additional resources or data are available.
14. How can I stay updated on further developments or reports in the Pregnant Industry?
To stay informed about further developments, trends, and reports in the Pregnant Industry, consider subscribing to industry newsletters, following relevant companies and organizations, or regularly checking reputable industry news sources and publications.
Methodology
Step 1 - Identification of Relevant Samples Size from Population Database


Step 2 - Approaches for Defining Global Market Size (Value, Volume* & Price*)

Note*: In applicable scenarios
Step 3 - Data Sources
Primary Research
- Web Analytics
- Survey Reports
- Research Institute
- Latest Research Reports
- Opinion Leaders
Secondary Research
- Annual Reports
- White Paper
- Latest Press Release
- Industry Association
- Paid Database
- Investor Presentations

Step 4 - Data Triangulation
Involves using different sources of information in order to increase the validity of a study
These sources are likely to be stakeholders in a program - participants, other researchers, program staff, other community members, and so on.
Then we put all data in single framework & apply various statistical tools to find out the dynamic on the market.
During the analysis stage, feedback from the stakeholder groups would be compared to determine areas of agreement as well as areas of divergence
