

Key Insights
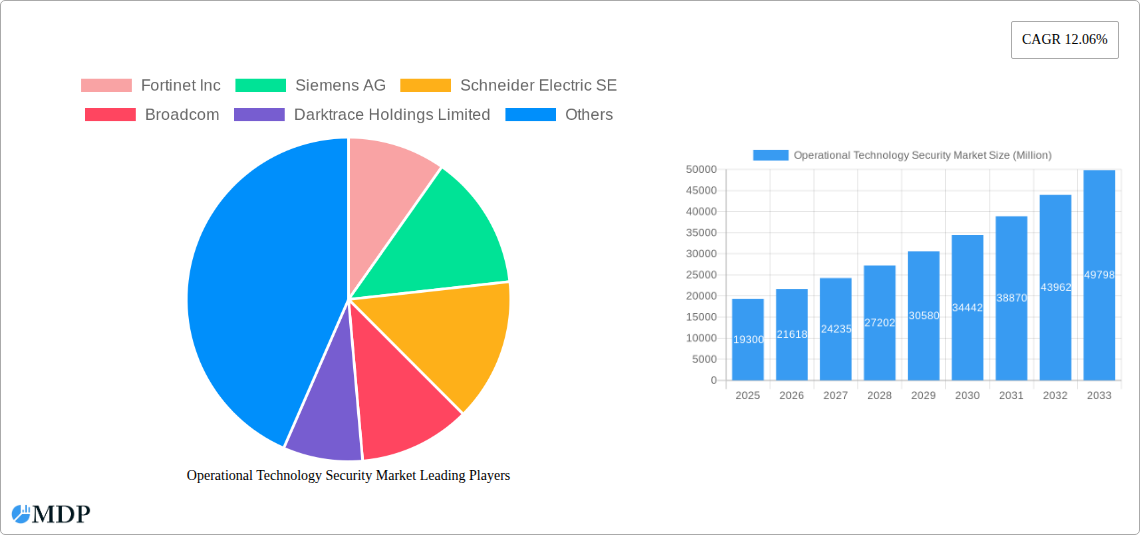
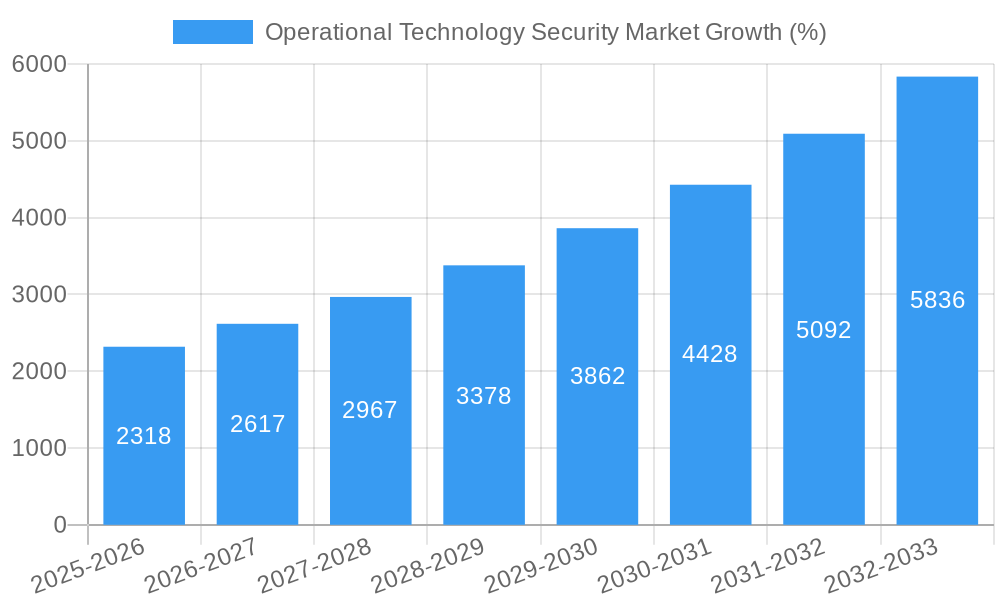
The Operational Technology (OT) Security market is experiencing robust growth, projected to reach $19.30 billion in 2025 and maintain a Compound Annual Growth Rate (CAGR) of 12.06% from 2025 to 2033. This expansion is fueled by the increasing reliance on interconnected industrial control systems (ICS) across various sectors, including manufacturing, energy, and healthcare. The rising frequency and severity of cyberattacks targeting OT infrastructure, coupled with stringent regulatory compliance mandates, are key drivers. Furthermore, the convergence of IT and OT networks is creating new vulnerabilities, necessitating advanced security solutions. Market trends indicate a shift towards proactive threat detection and response, leveraging artificial intelligence (AI) and machine learning (ML) to identify and mitigate risks in real-time. The adoption of cloud-based OT security solutions and the growing demand for managed security services are further shaping market dynamics. While the market faces restraints such as legacy systems integration challenges and a shortage of skilled cybersecurity professionals, the overall outlook remains positive, driven by escalating digital transformation initiatives across industries. Leading players such as Fortinet, Siemens, Schneider Electric, and others are strategically investing in R&D and partnerships to cater to this growing demand.
The significant growth in the OT security market is attributed to several factors, including increased awareness of cybersecurity risks within OT environments and the development of sophisticated and tailored security solutions. The growing adoption of Industrial Internet of Things (IIoT) devices, coupled with the increasing interconnectedness of industrial systems, presents both opportunities and challenges. The market segmentation likely includes offerings such as network security, endpoint security, data security, and managed security services. Regional variations will be influenced by factors like the maturity of digitalization initiatives in specific geographies and the regulatory landscape. The historical period (2019-2024) provides a strong foundation for projecting future market size, considering the established CAGR. The forecast period (2025-2033) presents opportunities for innovative solutions and strategic partnerships to ensure robust cybersecurity for critical infrastructure.
Operational Technology Security Market Report: A Comprehensive Analysis (2019-2033)
This comprehensive report provides an in-depth analysis of the Operational Technology (OT) Security Market, offering invaluable insights for stakeholders across the industry. With a study period spanning 2019-2033, a base year of 2025, and a forecast period of 2025-2033, this report delivers a detailed understanding of market dynamics, trends, and future opportunities. The market is projected to reach xx Million by 2033, exhibiting a CAGR of xx% during the forecast period.
Operational Technology Security Market Market Dynamics & Concentration
The Operational Technology (OT) security market is experiencing robust growth fueled by the increasing adoption of Industrial Internet of Things (IIoT) and digital transformation initiatives across various industries. Market concentration is moderate, with several key players holding significant market share, but a fragmented landscape also exists, particularly among niche players offering specialized solutions. The market exhibits strong innovation drivers, particularly in areas such as AI-powered threat detection, advanced analytics, and cloud-based security solutions. Stringent regulatory frameworks, like those mandated by governments worldwide to protect critical infrastructure, are pushing adoption. The market also observes substitution from legacy security systems to more advanced solutions and a shift in end-user trends favoring managed security services. The rise of M&A activities further shapes the market landscape, with xx M&A deals recorded in 2024. Key players like Fortinet, Siemens, and Rockwell Automation hold substantial market shares. Smaller players focus on specific industry verticals to differentiate themselves.
- Market Concentration: Moderate, with top 5 players holding approximately xx% market share in 2024.
- Innovation Drivers: AI-powered threat detection, advanced analytics, cloud-based security.
- Regulatory Frameworks: Increasingly stringent regulations impacting critical infrastructure protection.
- M&A Activity: xx deals recorded in 2024, indicating consolidation within the market.
- End-User Trends: Growing preference for managed security services and integrated solutions.
Operational Technology Security Market Industry Trends & Analysis
The OT security market is experiencing significant growth, driven by factors such as the increasing adoption of IoT devices in industrial settings, rising concerns about cybersecurity threats, and the increasing complexity of industrial control systems. The market is characterized by rapid technological advancements, including the emergence of AI-powered threat detection systems, enhanced security protocols for industrial networks, and advanced analytics for improved threat response. Consumer preferences are shifting towards more comprehensive and integrated security solutions, which address the various facets of OT security. The competitive dynamics are intense, with established players focusing on strategic partnerships and acquisitions to expand their market reach and product portfolio. These factors collectively contribute to a dynamic market landscape with significant growth opportunities. The market's CAGR is projected at xx%, with market penetration increasing to xx% by 2033.
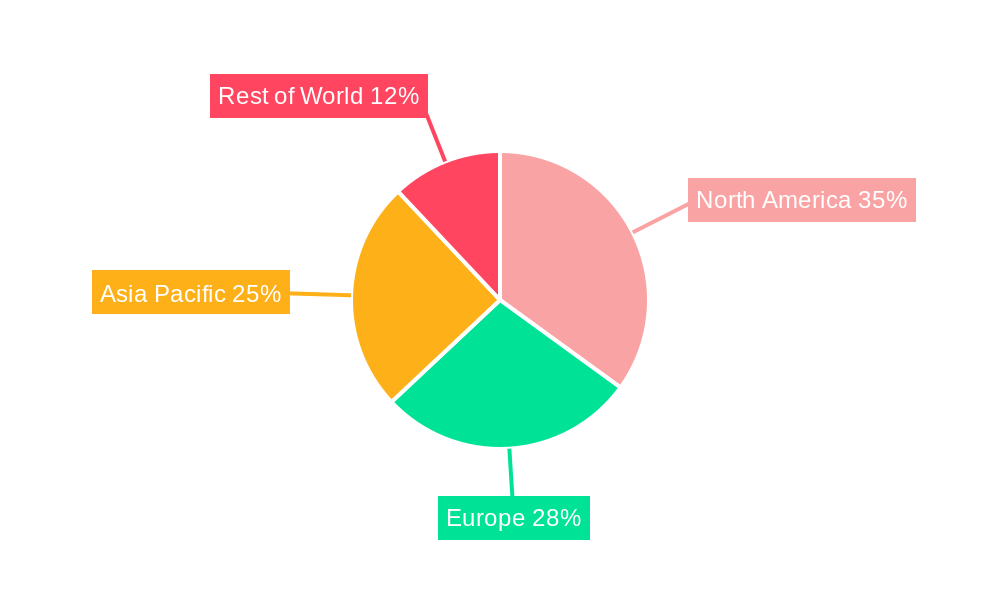
Leading Markets & Segments in Operational Technology Security Market
The North American region currently dominates the Operational Technology Security Market, driven by robust adoption across various sectors like energy, manufacturing, and transportation. This dominance is fueled by:
- Robust Economic Policies: Incentives for digital transformation and cybersecurity investments.
- Advanced Infrastructure: Well-established IT infrastructure supports OT security deployments.
- High Cybersecurity Awareness: Increased awareness of cyber threats and regulatory pressure.
The manufacturing segment demonstrates the highest growth trajectory, reflecting the burgeoning need for robust OT security across global production lines. Other significant segments include energy, transportation, and healthcare. The European and Asia-Pacific regions are also expected to experience considerable growth in the coming years, fueled by increased industrial automation and IoT adoption.
Operational Technology Security Market Product Developments
Recent product innovations emphasize AI-powered threat detection, improved network visibility, and enhanced security for industrial control systems. Companies are incorporating advanced analytics to detect and respond to threats more effectively. This reflects a market trend toward more comprehensive, integrated solutions that address the unique security challenges of OT environments. The focus is on improving the ease of deployment and management of security systems to cater to a broader range of users.
Key Drivers of Operational Technology Security Market Growth
The OT security market's growth is primarily driven by:
- Increased adoption of IoT devices in industrial settings: The proliferation of connected devices increases the attack surface, demanding robust security measures.
- Rising concerns about cybersecurity threats: High-profile cyberattacks targeting critical infrastructure highlight the importance of robust security.
- Stringent government regulations: Regulations aimed at protecting critical infrastructure are driving security investments.
Challenges in the Operational Technology Security Market Market
Significant challenges include:
- Legacy systems incompatibility: Upgrading legacy systems can be costly and complex, hindering full adoption of new solutions.
- Skills shortage: A lack of skilled cybersecurity professionals impedes the effective implementation and management of OT security solutions.
- High initial investment costs: The upfront investment for implementing OT security solutions can be prohibitive for some organizations. These factors could potentially constrain market growth by xx% by 2030.
Emerging Opportunities in Operational Technology Security Market
Significant opportunities lie in:
- Expansion into emerging markets: Developing countries with growing industrialization present untapped potential.
- Strategic partnerships and collaborations: Partnerships between OT security vendors and industrial automation companies are essential for delivering integrated solutions.
- Development of AI-powered threat intelligence platforms: Sophisticated solutions offer advanced threat detection and response capabilities.
Leading Players in the Operational Technology Security Market Sector
- Fortinet Inc
- Siemens AG
- Schneider Electric SE
- Broadcom
- Darktrace Holdings Limited
- Nozomi Networks
- Rockwell Automation Inc
- Honeywell International Inc
- GE Vernova (General Electric)
- Claroty
- Palo Alto Network
Key Milestones in Operational Technology Security Market Industry
- February 2024: Mitsubishi Electric Corporation partnered with Dispel LLC to enhance its OT security offerings through improved marketing and technical development, reflecting the growing demand for remote maintenance solutions in a globalized manufacturing landscape.
- February 2024: The US Department of Energy (DOE) collaborated with Rockwell Automation on a cybersecurity vulnerability assessment program, highlighting the increasing focus on securing critical infrastructure.
Strategic Outlook for Operational Technology Security Market Market
The OT security market presents significant long-term growth potential, driven by increasing digitalization across industries and rising cybersecurity awareness. Strategic opportunities include focusing on niche industry verticals, developing advanced AI-driven security solutions, and establishing strong partnerships with industrial automation providers. The market is poised for continued expansion, with significant growth expected across various regions and segments.
Operational Technology Security Market Segmentation
-
1. Component
- 1.1. Solutions
- 1.2. Services
-
2. Deployment Mode
- 2.1. On-Premises
- 2.2. Cloud
-
3. End-User Industry
- 3.1. Manufacturing
- 3.2. Oil and Gas
- 3.3. Power Utilities
- 3.4. Transportation and Logistics
- 3.5. Others
Operational Technology Security Market Segmentation By Geography
- 1. North America
- 2. Europe
- 3. Asia
- 4. Australia and New Zealand
- 5. Latin America
- 6. Middle East and Africa
Operational Technology Security Market REPORT HIGHLIGHTS
| Aspects | Details |
|---|---|
| Study Period | 2019-2033 |
| Base Year | 2024 |
| Estimated Year | 2025 |
| Forecast Period | 2025-2033 |
| Historical Period | 2019-2024 |
| Growth Rate | CAGR of 12.06% from 2019-2033 |
| Segmentation |
|
Table of Contents
- 1. Introduction
- 1.1. Research Scope
- 1.2. Market Segmentation
- 1.3. Research Methodology
- 1.4. Definitions and Assumptions
- 2. Executive Summary
- 2.1. Introduction
- 3. Market Dynamics
- 3.1. Introduction
- 3.2. Market Drivers
- 3.2.1. Surge in Cyber-Attacks Targeting Critical Infrastructure; Increased Integration of Government Initiatives into Security Standards
- 3.3. Market Restrains
- 3.3.1. Surge in Cyber-Attacks Targeting Critical Infrastructure; Increased Integration of Government Initiatives into Security Standards
- 3.4. Market Trends
- 3.4.1. Oil and Gas End User Segment is Expected to Witness Significant Growth
- 4. Market Factor Analysis
- 4.1. Porters Five Forces
- 4.2. Supply/Value Chain
- 4.3. PESTEL analysis
- 4.4. Market Entropy
- 4.5. Patent/Trademark Analysis
- 5. Global Operational Technology Security Market Analysis, Insights and Forecast, 2019-2031
- 5.1. Market Analysis, Insights and Forecast - by Component
- 5.1.1. Solutions
- 5.1.2. Services
- 5.2. Market Analysis, Insights and Forecast - by Deployment Mode
- 5.2.1. On-Premises
- 5.2.2. Cloud
- 5.3. Market Analysis, Insights and Forecast - by End-User Industry
- 5.3.1. Manufacturing
- 5.3.2. Oil and Gas
- 5.3.3. Power Utilities
- 5.3.4. Transportation and Logistics
- 5.3.5. Others
- 5.4. Market Analysis, Insights and Forecast - by Region
- 5.4.1. North America
- 5.4.2. Europe
- 5.4.3. Asia
- 5.4.4. Australia and New Zealand
- 5.4.5. Latin America
- 5.4.6. Middle East and Africa
- 5.1. Market Analysis, Insights and Forecast - by Component
- 6. North America Operational Technology Security Market Analysis, Insights and Forecast, 2019-2031
- 6.1. Market Analysis, Insights and Forecast - by Component
- 6.1.1. Solutions
- 6.1.2. Services
- 6.2. Market Analysis, Insights and Forecast - by Deployment Mode
- 6.2.1. On-Premises
- 6.2.2. Cloud
- 6.3. Market Analysis, Insights and Forecast - by End-User Industry
- 6.3.1. Manufacturing
- 6.3.2. Oil and Gas
- 6.3.3. Power Utilities
- 6.3.4. Transportation and Logistics
- 6.3.5. Others
- 6.1. Market Analysis, Insights and Forecast - by Component
- 7. Europe Operational Technology Security Market Analysis, Insights and Forecast, 2019-2031
- 7.1. Market Analysis, Insights and Forecast - by Component
- 7.1.1. Solutions
- 7.1.2. Services
- 7.2. Market Analysis, Insights and Forecast - by Deployment Mode
- 7.2.1. On-Premises
- 7.2.2. Cloud
- 7.3. Market Analysis, Insights and Forecast - by End-User Industry
- 7.3.1. Manufacturing
- 7.3.2. Oil and Gas
- 7.3.3. Power Utilities
- 7.3.4. Transportation and Logistics
- 7.3.5. Others
- 7.1. Market Analysis, Insights and Forecast - by Component
- 8. Asia Operational Technology Security Market Analysis, Insights and Forecast, 2019-2031
- 8.1. Market Analysis, Insights and Forecast - by Component
- 8.1.1. Solutions
- 8.1.2. Services
- 8.2. Market Analysis, Insights and Forecast - by Deployment Mode
- 8.2.1. On-Premises
- 8.2.2. Cloud
- 8.3. Market Analysis, Insights and Forecast - by End-User Industry
- 8.3.1. Manufacturing
- 8.3.2. Oil and Gas
- 8.3.3. Power Utilities
- 8.3.4. Transportation and Logistics
- 8.3.5. Others
- 8.1. Market Analysis, Insights and Forecast - by Component
- 9. Australia and New Zealand Operational Technology Security Market Analysis, Insights and Forecast, 2019-2031
- 9.1. Market Analysis, Insights and Forecast - by Component
- 9.1.1. Solutions
- 9.1.2. Services
- 9.2. Market Analysis, Insights and Forecast - by Deployment Mode
- 9.2.1. On-Premises
- 9.2.2. Cloud
- 9.3. Market Analysis, Insights and Forecast - by End-User Industry
- 9.3.1. Manufacturing
- 9.3.2. Oil and Gas
- 9.3.3. Power Utilities
- 9.3.4. Transportation and Logistics
- 9.3.5. Others
- 9.1. Market Analysis, Insights and Forecast - by Component
- 10. Latin America Operational Technology Security Market Analysis, Insights and Forecast, 2019-2031
- 10.1. Market Analysis, Insights and Forecast - by Component
- 10.1.1. Solutions
- 10.1.2. Services
- 10.2. Market Analysis, Insights and Forecast - by Deployment Mode
- 10.2.1. On-Premises
- 10.2.2. Cloud
- 10.3. Market Analysis, Insights and Forecast - by End-User Industry
- 10.3.1. Manufacturing
- 10.3.2. Oil and Gas
- 10.3.3. Power Utilities
- 10.3.4. Transportation and Logistics
- 10.3.5. Others
- 10.1. Market Analysis, Insights and Forecast - by Component
- 11. Middle East and Africa Operational Technology Security Market Analysis, Insights and Forecast, 2019-2031
- 11.1. Market Analysis, Insights and Forecast - by Component
- 11.1.1. Solutions
- 11.1.2. Services
- 11.2. Market Analysis, Insights and Forecast - by Deployment Mode
- 11.2.1. On-Premises
- 11.2.2. Cloud
- 11.3. Market Analysis, Insights and Forecast - by End-User Industry
- 11.3.1. Manufacturing
- 11.3.2. Oil and Gas
- 11.3.3. Power Utilities
- 11.3.4. Transportation and Logistics
- 11.3.5. Others
- 11.1. Market Analysis, Insights and Forecast - by Component
- 12. Competitive Analysis
- 12.1. Global Market Share Analysis 2024
- 12.2. Company Profiles
- 12.2.1 Fortinet Inc
- 12.2.1.1. Overview
- 12.2.1.2. Products
- 12.2.1.3. SWOT Analysis
- 12.2.1.4. Recent Developments
- 12.2.1.5. Financials (Based on Availability)
- 12.2.2 Siemens AG
- 12.2.2.1. Overview
- 12.2.2.2. Products
- 12.2.2.3. SWOT Analysis
- 12.2.2.4. Recent Developments
- 12.2.2.5. Financials (Based on Availability)
- 12.2.3 Schneider Electric SE
- 12.2.3.1. Overview
- 12.2.3.2. Products
- 12.2.3.3. SWOT Analysis
- 12.2.3.4. Recent Developments
- 12.2.3.5. Financials (Based on Availability)
- 12.2.4 Broadcom
- 12.2.4.1. Overview
- 12.2.4.2. Products
- 12.2.4.3. SWOT Analysis
- 12.2.4.4. Recent Developments
- 12.2.4.5. Financials (Based on Availability)
- 12.2.5 Darktrace Holdings Limited
- 12.2.5.1. Overview
- 12.2.5.2. Products
- 12.2.5.3. SWOT Analysis
- 12.2.5.4. Recent Developments
- 12.2.5.5. Financials (Based on Availability)
- 12.2.6 Nozomi Networks
- 12.2.6.1. Overview
- 12.2.6.2. Products
- 12.2.6.3. SWOT Analysis
- 12.2.6.4. Recent Developments
- 12.2.6.5. Financials (Based on Availability)
- 12.2.7 Rockwell Automation Inc
- 12.2.7.1. Overview
- 12.2.7.2. Products
- 12.2.7.3. SWOT Analysis
- 12.2.7.4. Recent Developments
- 12.2.7.5. Financials (Based on Availability)
- 12.2.8 Honeywell International Inc
- 12.2.8.1. Overview
- 12.2.8.2. Products
- 12.2.8.3. SWOT Analysis
- 12.2.8.4. Recent Developments
- 12.2.8.5. Financials (Based on Availability)
- 12.2.9 GE Vernova (General Electric)
- 12.2.9.1. Overview
- 12.2.9.2. Products
- 12.2.9.3. SWOT Analysis
- 12.2.9.4. Recent Developments
- 12.2.9.5. Financials (Based on Availability)
- 12.2.10 Claroty
- 12.2.10.1. Overview
- 12.2.10.2. Products
- 12.2.10.3. SWOT Analysis
- 12.2.10.4. Recent Developments
- 12.2.10.5. Financials (Based on Availability)
- 12.2.11 Palo Alto Network
- 12.2.11.1. Overview
- 12.2.11.2. Products
- 12.2.11.3. SWOT Analysis
- 12.2.11.4. Recent Developments
- 12.2.11.5. Financials (Based on Availability)
- 12.2.1 Fortinet Inc
List of Figures
- Figure 1: Global Operational Technology Security Market Revenue Breakdown (Million, %) by Region 2024 & 2032
- Figure 2: Global Operational Technology Security Market Volume Breakdown (Billion, %) by Region 2024 & 2032
- Figure 3: North America Operational Technology Security Market Revenue (Million), by Component 2024 & 2032
- Figure 4: North America Operational Technology Security Market Volume (Billion), by Component 2024 & 2032
- Figure 5: North America Operational Technology Security Market Revenue Share (%), by Component 2024 & 2032
- Figure 6: North America Operational Technology Security Market Volume Share (%), by Component 2024 & 2032
- Figure 7: North America Operational Technology Security Market Revenue (Million), by Deployment Mode 2024 & 2032
- Figure 8: North America Operational Technology Security Market Volume (Billion), by Deployment Mode 2024 & 2032
- Figure 9: North America Operational Technology Security Market Revenue Share (%), by Deployment Mode 2024 & 2032
- Figure 10: North America Operational Technology Security Market Volume Share (%), by Deployment Mode 2024 & 2032
- Figure 11: North America Operational Technology Security Market Revenue (Million), by End-User Industry 2024 & 2032
- Figure 12: North America Operational Technology Security Market Volume (Billion), by End-User Industry 2024 & 2032
- Figure 13: North America Operational Technology Security Market Revenue Share (%), by End-User Industry 2024 & 2032
- Figure 14: North America Operational Technology Security Market Volume Share (%), by End-User Industry 2024 & 2032
- Figure 15: North America Operational Technology Security Market Revenue (Million), by Country 2024 & 2032
- Figure 16: North America Operational Technology Security Market Volume (Billion), by Country 2024 & 2032
- Figure 17: North America Operational Technology Security Market Revenue Share (%), by Country 2024 & 2032
- Figure 18: North America Operational Technology Security Market Volume Share (%), by Country 2024 & 2032
- Figure 19: Europe Operational Technology Security Market Revenue (Million), by Component 2024 & 2032
- Figure 20: Europe Operational Technology Security Market Volume (Billion), by Component 2024 & 2032
- Figure 21: Europe Operational Technology Security Market Revenue Share (%), by Component 2024 & 2032
- Figure 22: Europe Operational Technology Security Market Volume Share (%), by Component 2024 & 2032
- Figure 23: Europe Operational Technology Security Market Revenue (Million), by Deployment Mode 2024 & 2032
- Figure 24: Europe Operational Technology Security Market Volume (Billion), by Deployment Mode 2024 & 2032
- Figure 25: Europe Operational Technology Security Market Revenue Share (%), by Deployment Mode 2024 & 2032
- Figure 26: Europe Operational Technology Security Market Volume Share (%), by Deployment Mode 2024 & 2032
- Figure 27: Europe Operational Technology Security Market Revenue (Million), by End-User Industry 2024 & 2032
- Figure 28: Europe Operational Technology Security Market Volume (Billion), by End-User Industry 2024 & 2032
- Figure 29: Europe Operational Technology Security Market Revenue Share (%), by End-User Industry 2024 & 2032
- Figure 30: Europe Operational Technology Security Market Volume Share (%), by End-User Industry 2024 & 2032
- Figure 31: Europe Operational Technology Security Market Revenue (Million), by Country 2024 & 2032
- Figure 32: Europe Operational Technology Security Market Volume (Billion), by Country 2024 & 2032
- Figure 33: Europe Operational Technology Security Market Revenue Share (%), by Country 2024 & 2032
- Figure 34: Europe Operational Technology Security Market Volume Share (%), by Country 2024 & 2032
- Figure 35: Asia Operational Technology Security Market Revenue (Million), by Component 2024 & 2032
- Figure 36: Asia Operational Technology Security Market Volume (Billion), by Component 2024 & 2032
- Figure 37: Asia Operational Technology Security Market Revenue Share (%), by Component 2024 & 2032
- Figure 38: Asia Operational Technology Security Market Volume Share (%), by Component 2024 & 2032
- Figure 39: Asia Operational Technology Security Market Revenue (Million), by Deployment Mode 2024 & 2032
- Figure 40: Asia Operational Technology Security Market Volume (Billion), by Deployment Mode 2024 & 2032
- Figure 41: Asia Operational Technology Security Market Revenue Share (%), by Deployment Mode 2024 & 2032
- Figure 42: Asia Operational Technology Security Market Volume Share (%), by Deployment Mode 2024 & 2032
- Figure 43: Asia Operational Technology Security Market Revenue (Million), by End-User Industry 2024 & 2032
- Figure 44: Asia Operational Technology Security Market Volume (Billion), by End-User Industry 2024 & 2032
- Figure 45: Asia Operational Technology Security Market Revenue Share (%), by End-User Industry 2024 & 2032
- Figure 46: Asia Operational Technology Security Market Volume Share (%), by End-User Industry 2024 & 2032
- Figure 47: Asia Operational Technology Security Market Revenue (Million), by Country 2024 & 2032
- Figure 48: Asia Operational Technology Security Market Volume (Billion), by Country 2024 & 2032
- Figure 49: Asia Operational Technology Security Market Revenue Share (%), by Country 2024 & 2032
- Figure 50: Asia Operational Technology Security Market Volume Share (%), by Country 2024 & 2032
- Figure 51: Australia and New Zealand Operational Technology Security Market Revenue (Million), by Component 2024 & 2032
- Figure 52: Australia and New Zealand Operational Technology Security Market Volume (Billion), by Component 2024 & 2032
- Figure 53: Australia and New Zealand Operational Technology Security Market Revenue Share (%), by Component 2024 & 2032
- Figure 54: Australia and New Zealand Operational Technology Security Market Volume Share (%), by Component 2024 & 2032
- Figure 55: Australia and New Zealand Operational Technology Security Market Revenue (Million), by Deployment Mode 2024 & 2032
- Figure 56: Australia and New Zealand Operational Technology Security Market Volume (Billion), by Deployment Mode 2024 & 2032
- Figure 57: Australia and New Zealand Operational Technology Security Market Revenue Share (%), by Deployment Mode 2024 & 2032
- Figure 58: Australia and New Zealand Operational Technology Security Market Volume Share (%), by Deployment Mode 2024 & 2032
- Figure 59: Australia and New Zealand Operational Technology Security Market Revenue (Million), by End-User Industry 2024 & 2032
- Figure 60: Australia and New Zealand Operational Technology Security Market Volume (Billion), by End-User Industry 2024 & 2032
- Figure 61: Australia and New Zealand Operational Technology Security Market Revenue Share (%), by End-User Industry 2024 & 2032
- Figure 62: Australia and New Zealand Operational Technology Security Market Volume Share (%), by End-User Industry 2024 & 2032
- Figure 63: Australia and New Zealand Operational Technology Security Market Revenue (Million), by Country 2024 & 2032
- Figure 64: Australia and New Zealand Operational Technology Security Market Volume (Billion), by Country 2024 & 2032
- Figure 65: Australia and New Zealand Operational Technology Security Market Revenue Share (%), by Country 2024 & 2032
- Figure 66: Australia and New Zealand Operational Technology Security Market Volume Share (%), by Country 2024 & 2032
- Figure 67: Latin America Operational Technology Security Market Revenue (Million), by Component 2024 & 2032
- Figure 68: Latin America Operational Technology Security Market Volume (Billion), by Component 2024 & 2032
- Figure 69: Latin America Operational Technology Security Market Revenue Share (%), by Component 2024 & 2032
- Figure 70: Latin America Operational Technology Security Market Volume Share (%), by Component 2024 & 2032
- Figure 71: Latin America Operational Technology Security Market Revenue (Million), by Deployment Mode 2024 & 2032
- Figure 72: Latin America Operational Technology Security Market Volume (Billion), by Deployment Mode 2024 & 2032
- Figure 73: Latin America Operational Technology Security Market Revenue Share (%), by Deployment Mode 2024 & 2032
- Figure 74: Latin America Operational Technology Security Market Volume Share (%), by Deployment Mode 2024 & 2032
- Figure 75: Latin America Operational Technology Security Market Revenue (Million), by End-User Industry 2024 & 2032
- Figure 76: Latin America Operational Technology Security Market Volume (Billion), by End-User Industry 2024 & 2032
- Figure 77: Latin America Operational Technology Security Market Revenue Share (%), by End-User Industry 2024 & 2032
- Figure 78: Latin America Operational Technology Security Market Volume Share (%), by End-User Industry 2024 & 2032
- Figure 79: Latin America Operational Technology Security Market Revenue (Million), by Country 2024 & 2032
- Figure 80: Latin America Operational Technology Security Market Volume (Billion), by Country 2024 & 2032
- Figure 81: Latin America Operational Technology Security Market Revenue Share (%), by Country 2024 & 2032
- Figure 82: Latin America Operational Technology Security Market Volume Share (%), by Country 2024 & 2032
- Figure 83: Middle East and Africa Operational Technology Security Market Revenue (Million), by Component 2024 & 2032
- Figure 84: Middle East and Africa Operational Technology Security Market Volume (Billion), by Component 2024 & 2032
- Figure 85: Middle East and Africa Operational Technology Security Market Revenue Share (%), by Component 2024 & 2032
- Figure 86: Middle East and Africa Operational Technology Security Market Volume Share (%), by Component 2024 & 2032
- Figure 87: Middle East and Africa Operational Technology Security Market Revenue (Million), by Deployment Mode 2024 & 2032
- Figure 88: Middle East and Africa Operational Technology Security Market Volume (Billion), by Deployment Mode 2024 & 2032
- Figure 89: Middle East and Africa Operational Technology Security Market Revenue Share (%), by Deployment Mode 2024 & 2032
- Figure 90: Middle East and Africa Operational Technology Security Market Volume Share (%), by Deployment Mode 2024 & 2032
- Figure 91: Middle East and Africa Operational Technology Security Market Revenue (Million), by End-User Industry 2024 & 2032
- Figure 92: Middle East and Africa Operational Technology Security Market Volume (Billion), by End-User Industry 2024 & 2032
- Figure 93: Middle East and Africa Operational Technology Security Market Revenue Share (%), by End-User Industry 2024 & 2032
- Figure 94: Middle East and Africa Operational Technology Security Market Volume Share (%), by End-User Industry 2024 & 2032
- Figure 95: Middle East and Africa Operational Technology Security Market Revenue (Million), by Country 2024 & 2032
- Figure 96: Middle East and Africa Operational Technology Security Market Volume (Billion), by Country 2024 & 2032
- Figure 97: Middle East and Africa Operational Technology Security Market Revenue Share (%), by Country 2024 & 2032
- Figure 98: Middle East and Africa Operational Technology Security Market Volume Share (%), by Country 2024 & 2032
List of Tables
- Table 1: Global Operational Technology Security Market Revenue Million Forecast, by Region 2019 & 2032
- Table 2: Global Operational Technology Security Market Volume Billion Forecast, by Region 2019 & 2032
- Table 3: Global Operational Technology Security Market Revenue Million Forecast, by Component 2019 & 2032
- Table 4: Global Operational Technology Security Market Volume Billion Forecast, by Component 2019 & 2032
- Table 5: Global Operational Technology Security Market Revenue Million Forecast, by Deployment Mode 2019 & 2032
- Table 6: Global Operational Technology Security Market Volume Billion Forecast, by Deployment Mode 2019 & 2032
- Table 7: Global Operational Technology Security Market Revenue Million Forecast, by End-User Industry 2019 & 2032
- Table 8: Global Operational Technology Security Market Volume Billion Forecast, by End-User Industry 2019 & 2032
- Table 9: Global Operational Technology Security Market Revenue Million Forecast, by Region 2019 & 2032
- Table 10: Global Operational Technology Security Market Volume Billion Forecast, by Region 2019 & 2032
- Table 11: Global Operational Technology Security Market Revenue Million Forecast, by Component 2019 & 2032
- Table 12: Global Operational Technology Security Market Volume Billion Forecast, by Component 2019 & 2032
- Table 13: Global Operational Technology Security Market Revenue Million Forecast, by Deployment Mode 2019 & 2032
- Table 14: Global Operational Technology Security Market Volume Billion Forecast, by Deployment Mode 2019 & 2032
- Table 15: Global Operational Technology Security Market Revenue Million Forecast, by End-User Industry 2019 & 2032
- Table 16: Global Operational Technology Security Market Volume Billion Forecast, by End-User Industry 2019 & 2032
- Table 17: Global Operational Technology Security Market Revenue Million Forecast, by Country 2019 & 2032
- Table 18: Global Operational Technology Security Market Volume Billion Forecast, by Country 2019 & 2032
- Table 19: Global Operational Technology Security Market Revenue Million Forecast, by Component 2019 & 2032
- Table 20: Global Operational Technology Security Market Volume Billion Forecast, by Component 2019 & 2032
- Table 21: Global Operational Technology Security Market Revenue Million Forecast, by Deployment Mode 2019 & 2032
- Table 22: Global Operational Technology Security Market Volume Billion Forecast, by Deployment Mode 2019 & 2032
- Table 23: Global Operational Technology Security Market Revenue Million Forecast, by End-User Industry 2019 & 2032
- Table 24: Global Operational Technology Security Market Volume Billion Forecast, by End-User Industry 2019 & 2032
- Table 25: Global Operational Technology Security Market Revenue Million Forecast, by Country 2019 & 2032
- Table 26: Global Operational Technology Security Market Volume Billion Forecast, by Country 2019 & 2032
- Table 27: Global Operational Technology Security Market Revenue Million Forecast, by Component 2019 & 2032
- Table 28: Global Operational Technology Security Market Volume Billion Forecast, by Component 2019 & 2032
- Table 29: Global Operational Technology Security Market Revenue Million Forecast, by Deployment Mode 2019 & 2032
- Table 30: Global Operational Technology Security Market Volume Billion Forecast, by Deployment Mode 2019 & 2032
- Table 31: Global Operational Technology Security Market Revenue Million Forecast, by End-User Industry 2019 & 2032
- Table 32: Global Operational Technology Security Market Volume Billion Forecast, by End-User Industry 2019 & 2032
- Table 33: Global Operational Technology Security Market Revenue Million Forecast, by Country 2019 & 2032
- Table 34: Global Operational Technology Security Market Volume Billion Forecast, by Country 2019 & 2032
- Table 35: Global Operational Technology Security Market Revenue Million Forecast, by Component 2019 & 2032
- Table 36: Global Operational Technology Security Market Volume Billion Forecast, by Component 2019 & 2032
- Table 37: Global Operational Technology Security Market Revenue Million Forecast, by Deployment Mode 2019 & 2032
- Table 38: Global Operational Technology Security Market Volume Billion Forecast, by Deployment Mode 2019 & 2032
- Table 39: Global Operational Technology Security Market Revenue Million Forecast, by End-User Industry 2019 & 2032
- Table 40: Global Operational Technology Security Market Volume Billion Forecast, by End-User Industry 2019 & 2032
- Table 41: Global Operational Technology Security Market Revenue Million Forecast, by Country 2019 & 2032
- Table 42: Global Operational Technology Security Market Volume Billion Forecast, by Country 2019 & 2032
- Table 43: Global Operational Technology Security Market Revenue Million Forecast, by Component 2019 & 2032
- Table 44: Global Operational Technology Security Market Volume Billion Forecast, by Component 2019 & 2032
- Table 45: Global Operational Technology Security Market Revenue Million Forecast, by Deployment Mode 2019 & 2032
- Table 46: Global Operational Technology Security Market Volume Billion Forecast, by Deployment Mode 2019 & 2032
- Table 47: Global Operational Technology Security Market Revenue Million Forecast, by End-User Industry 2019 & 2032
- Table 48: Global Operational Technology Security Market Volume Billion Forecast, by End-User Industry 2019 & 2032
- Table 49: Global Operational Technology Security Market Revenue Million Forecast, by Country 2019 & 2032
- Table 50: Global Operational Technology Security Market Volume Billion Forecast, by Country 2019 & 2032
- Table 51: Global Operational Technology Security Market Revenue Million Forecast, by Component 2019 & 2032
- Table 52: Global Operational Technology Security Market Volume Billion Forecast, by Component 2019 & 2032
- Table 53: Global Operational Technology Security Market Revenue Million Forecast, by Deployment Mode 2019 & 2032
- Table 54: Global Operational Technology Security Market Volume Billion Forecast, by Deployment Mode 2019 & 2032
- Table 55: Global Operational Technology Security Market Revenue Million Forecast, by End-User Industry 2019 & 2032
- Table 56: Global Operational Technology Security Market Volume Billion Forecast, by End-User Industry 2019 & 2032
- Table 57: Global Operational Technology Security Market Revenue Million Forecast, by Country 2019 & 2032
- Table 58: Global Operational Technology Security Market Volume Billion Forecast, by Country 2019 & 2032
Frequently Asked Questions
1. What is the projected Compound Annual Growth Rate (CAGR) of the Operational Technology Security Market?
The projected CAGR is approximately 12.06%.
2. Which companies are prominent players in the Operational Technology Security Market?
Key companies in the market include Fortinet Inc, Siemens AG, Schneider Electric SE, Broadcom, Darktrace Holdings Limited, Nozomi Networks, Rockwell Automation Inc, Honeywell International Inc, GE Vernova (General Electric), Claroty, Palo Alto Network.
3. What are the main segments of the Operational Technology Security Market?
The market segments include Component, Deployment Mode, End-User Industry.
4. Can you provide details about the market size?
The market size is estimated to be USD 19.30 Million as of 2022.
5. What are some drivers contributing to market growth?
Surge in Cyber-Attacks Targeting Critical Infrastructure; Increased Integration of Government Initiatives into Security Standards.
6. What are the notable trends driving market growth?
Oil and Gas End User Segment is Expected to Witness Significant Growth.
7. Are there any restraints impacting market growth?
Surge in Cyber-Attacks Targeting Critical Infrastructure; Increased Integration of Government Initiatives into Security Standards.
8. Can you provide examples of recent developments in the market?
February 2024: Mitsubishi Electric Corporation inked a deal with Dispel LLC to bolster its operational technology (OT) security business via enhanced marketing and technical development. As manufacturing undergoes globalization and embraces IoT and digital transformation, there is a surging interest in remote maintenance. This technology allows for internet monitoring and troubleshooting production lines from distant locations.
9. What pricing options are available for accessing the report?
Pricing options include single-user, multi-user, and enterprise licenses priced at USD 4750, USD 5250, and USD 8750 respectively.
10. Is the market size provided in terms of value or volume?
The market size is provided in terms of value, measured in Million and volume, measured in Billion.
11. Are there any specific market keywords associated with the report?
Yes, the market keyword associated with the report is "Operational Technology Security Market," which aids in identifying and referencing the specific market segment covered.
12. How do I determine which pricing option suits my needs best?
The pricing options vary based on user requirements and access needs. Individual users may opt for single-user licenses, while businesses requiring broader access may choose multi-user or enterprise licenses for cost-effective access to the report.
13. Are there any additional resources or data provided in the Operational Technology Security Market report?
While the report offers comprehensive insights, it's advisable to review the specific contents or supplementary materials provided to ascertain if additional resources or data are available.
14. How can I stay updated on further developments or reports in the Operational Technology Security Market?
To stay informed about further developments, trends, and reports in the Operational Technology Security Market, consider subscribing to industry newsletters, following relevant companies and organizations, or regularly checking reputable industry news sources and publications.
Methodology
Step 1 - Identification of Relevant Samples Size from Population Database


Step 2 - Approaches for Defining Global Market Size (Value, Volume* & Price*)

Note*: In applicable scenarios
Step 3 - Data Sources
Primary Research
- Web Analytics
- Survey Reports
- Research Institute
- Latest Research Reports
- Opinion Leaders
Secondary Research
- Annual Reports
- White Paper
- Latest Press Release
- Industry Association
- Paid Database
- Investor Presentations

Step 4 - Data Triangulation
Involves using different sources of information in order to increase the validity of a study
These sources are likely to be stakeholders in a program - participants, other researchers, program staff, other community members, and so on.
Then we put all data in single framework & apply various statistical tools to find out the dynamic on the market.
During the analysis stage, feedback from the stakeholder groups would be compared to determine areas of agreement as well as areas of divergence
