

Key Insights
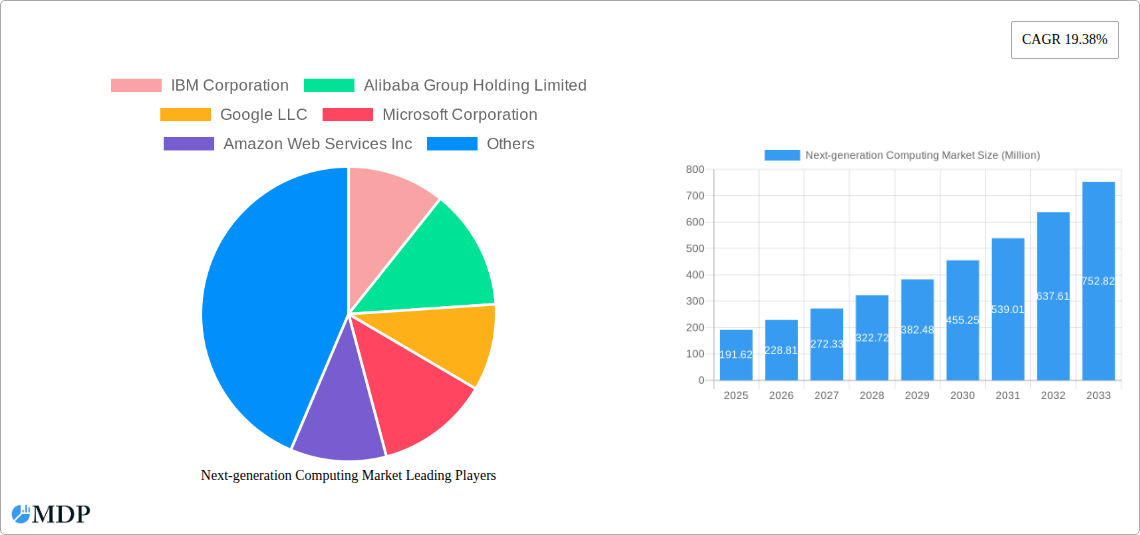
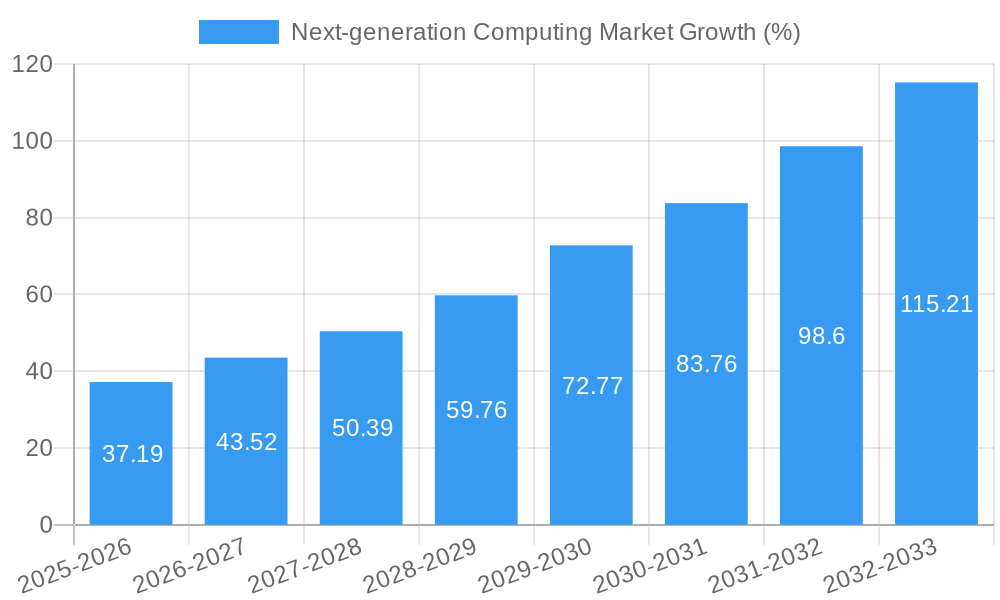
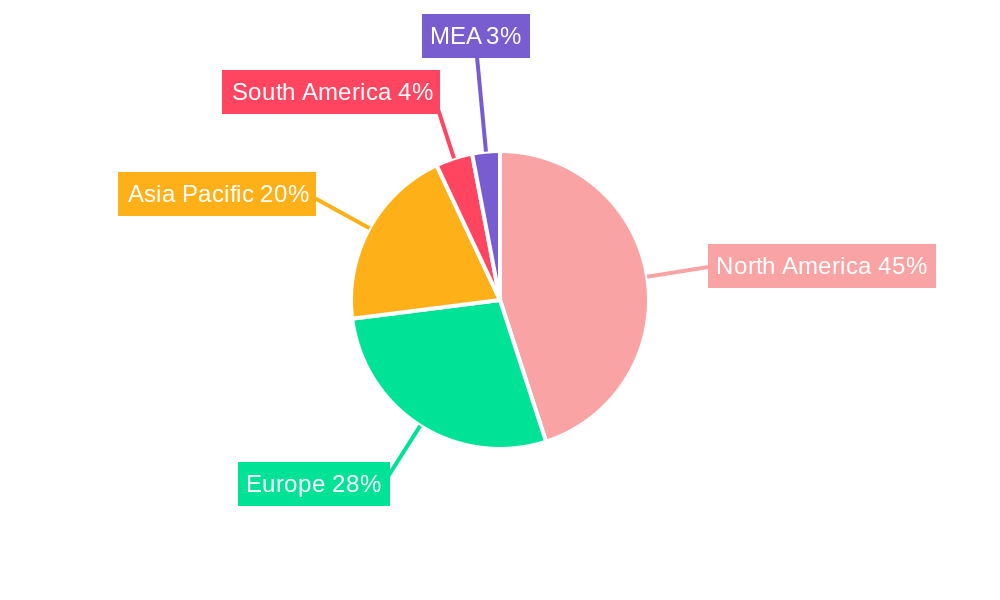
The next-generation computing market is experiencing explosive growth, projected to reach \$191.62 million in 2025 and exhibiting a robust Compound Annual Growth Rate (CAGR) of 19.38%. This surge is driven by several key factors. The increasing demand for high-performance computing (HPC) in sectors like automotive, healthcare, and finance fuels market expansion. Advancements in quantum computing, promising exponential processing power, and the rise of edge computing, bringing processing closer to data sources for reduced latency, are significant drivers. Furthermore, the transition to cloud-based deployments offers scalability and cost-effectiveness, accelerating adoption. While challenges remain, such as the high initial investment costs associated with quantum and optical computing technologies and the need for skilled professionals, the overall market trajectory is undeniably positive. The market is segmented by component (hardware, software, services), computing type (HPC, quantum, optical, edge), deployment (cloud, on-premise), and end-user sectors, offering diverse investment and growth opportunities. North America currently holds a significant market share, but the Asia-Pacific region, particularly China and India, is poised for rapid expansion due to burgeoning technological advancements and increasing government investments in R&D.
The competitive landscape is dominated by established technology giants like IBM, Google, Microsoft, and Amazon, alongside emerging players specializing in specific next-generation computing technologies. Strategic partnerships, acquisitions, and continuous innovation are shaping the market dynamics. The forecast period (2025-2033) anticipates sustained growth, fueled by ongoing technological breakthroughs and increasing industry adoption across various sectors. The market's maturation will depend on addressing current restraints, such as standardization challenges and the need for robust cybersecurity measures to ensure data privacy and security within these advanced computing environments. This requires collaborative efforts from industry players, researchers, and policymakers to fully unlock the transformational potential of next-generation computing.
Next-Generation Computing Market: A Comprehensive Report (2019-2033)
This in-depth report provides a comprehensive analysis of the next-generation computing market, encompassing market dynamics, industry trends, leading segments, and key players. With a study period spanning 2019-2033, a base year of 2025, and a forecast period of 2025-2033, this report offers invaluable insights for industry stakeholders seeking to navigate this rapidly evolving landscape. The market is projected to reach xx Million by 2033, exhibiting a robust CAGR of xx% during the forecast period.
Next-generation Computing Market Market Dynamics & Concentration
The next-generation computing market is characterized by high dynamism and increasing concentration. While numerous players compete, a few dominant companies hold significant market share, driving consolidation through mergers and acquisitions (M&A). Innovation is a key driver, with continuous advancements in hardware, software, and services pushing the boundaries of computational power. Regulatory frameworks, varying across regions, influence market access and data privacy. Product substitutes, such as traditional computing systems, exert competitive pressure, although the unique capabilities of next-generation computing are creating new markets. End-user trends, particularly the growing demand for high-performance computing in sectors like AI and machine learning, are shaping market growth.
- Market Concentration: The top 5 companies hold approximately xx% of the market share in 2025.
- M&A Activity: Over the historical period (2019-2024), there were approximately xx M&A deals in the next-generation computing market.
- Innovation Drivers: Artificial intelligence, machine learning, big data analytics, and the Internet of Things (IoT) are key drivers of innovation.
- Regulatory Frameworks: Data privacy regulations (GDPR, CCPA) and cybersecurity standards influence market development.
- Product Substitutes: Traditional computing systems and legacy infrastructure present competition.
Next-generation Computing Market Industry Trends & Analysis
The next-generation computing market is experiencing exponential growth, driven by several key factors. Technological advancements, particularly in areas like quantum computing and edge computing, are creating new opportunities and disrupting traditional computing paradigms. Consumer preferences are shifting towards cloud-based solutions, demanding greater scalability, flexibility, and cost-effectiveness. The competitive landscape is marked by intense rivalry among established tech giants and emerging players, leading to rapid innovation and price competition. The market exhibits a high growth rate, with a projected CAGR of xx% during the forecast period (2025-2033). Market penetration of next-generation computing technologies is increasing across various sectors, particularly in high-growth areas like AI, data analytics, and the Internet of Things.
Leading Markets & Segments in Next-generation Computing Market
The North American region currently dominates the next-generation computing market, driven by strong technological innovation, substantial investments in R&D, and the presence of major technology companies. Within the market segments, the Hardware segment holds the largest market share, followed by Services and Software. High-Performance Computing (HPC) dominates among computing types, with significant growth expected in Quantum Computing and Edge Computing. The Cloud deployment model is witnessing substantial growth due to its scalability and cost-effectiveness. The Automotive & Transportation, Healthcare, and BFSI sectors are significant end-users of next-generation computing technologies.
- Key Drivers by Region:
- North America: Strong R&D investments, presence of major tech companies, and early adoption of new technologies.
- Europe: Growing government initiatives supporting digital transformation and increasing focus on data privacy.
- Asia-Pacific: Rapid technological advancements, rising demand for HPC, and expanding digital infrastructure.
- Key Drivers by Segment:
- Hardware: Increasing demand for high-performance processors, specialized hardware for AI/ML, and quantum computing hardware.
- Software: Growing adoption of AI/ML platforms, cloud-based software solutions, and specialized software for HPC.
- Services: Rising need for consulting, integration, and managed services related to next-generation computing.
- High-Performance Computing: Driven by growing needs in AI, scientific research, and big data analytics.
- Quantum Computing: Early adoption by research institutions and organizations exploring its potential.
- Edge Computing: Driven by the growth of IoT, need for real-time data processing, and low latency applications.
- Cloud Deployment: Scalability, cost-effectiveness, and ease of access are driving factors.
- Automotive & Transportation: Autonomous driving, connected car technologies, and advanced driver-assistance systems.
- Healthcare: Genomics research, drug discovery, personalized medicine, and medical imaging.
- BFSI: Risk management, fraud detection, algorithmic trading, and customer service.
Next-generation Computing Market Product Developments
Recent product developments highlight a focus on increased processing power, improved energy efficiency, and enhanced security features. Companies are investing in specialized hardware for AI and machine learning, as well as developing new software and services to support these applications. The integration of quantum computing principles into existing architectures is an emerging trend.
Key Drivers of Next-generation Computing Market Growth
Technological advancements in areas such as AI, machine learning, and quantum computing are primary drivers of market growth. The increasing demand for data processing and analytics across various sectors, fueled by the growth of the internet of things (IoT), further accelerates market expansion. Government initiatives promoting digital transformation and investments in research and development further contribute to market growth.
Challenges in the Next-generation Computing Market
High initial investment costs associated with implementing next-generation computing solutions pose a significant challenge for some organizations. The complexity of these systems and the need for specialized skills can also hinder adoption. Furthermore, supply chain disruptions and geopolitical factors can affect the availability of essential components and resources. Security concerns related to data privacy and system vulnerabilities also represent significant challenges. These factors are estimated to reduce the overall market growth by approximately xx% over the forecast period.
Emerging Opportunities in Next-generation Computing Market
The integration of next-generation computing technologies with other emerging technologies, such as blockchain and the metaverse, presents significant opportunities. Strategic partnerships between technology companies and end-user organizations are driving innovation and market expansion. The development of new applications in areas such as personalized medicine, autonomous vehicles, and climate change mitigation will unlock further market growth.
Leading Players in the Next-generation Computing Market Sector
- IBM Corporation
- Alibaba Group Holding Limited
- Google LLC
- Microsoft Corporation
- Amazon Web Services Inc
- NVIDIA Corp
- NEC Corporation
- Oracle Corporation
- Cisco Systems
- Intel Corporation
Key Milestones in Next-generation Computing Market Industry
- September 2022: General Atomics Aeronautical Systems and 3rdiTech partnered to develop next-gen integrated circuits and semiconductor technologies. This partnership is expected to significantly boost the production of advanced chips for various next-gen computing applications.
- July 2023: Moody's and Microsoft partnered to create next-generation data analytics and risk solutions for financial services, leveraging Microsoft's Azure OpenAI Service. This collaboration is expected to enhance risk assessment capabilities and improve decision-making in the financial industry.
Strategic Outlook for Next-generation Computing Market Market
The next-generation computing market is poised for substantial growth, driven by continuous technological innovation and increasing demand from diverse sectors. Strategic partnerships and collaborations will play a critical role in accelerating market expansion. Companies focused on developing cutting-edge technologies, offering comprehensive solutions, and adapting to evolving market needs will be best positioned for success. The market will continue to see strong growth, particularly in areas like quantum computing, edge computing, and AI-driven applications.
Next-generation Computing Market Segmentation
-
1. Component
- 1.1. Hardware
- 1.2. Software
- 1.3. Services
-
2. Computing Type
- 2.1. High-Performance Computing
- 2.2. Quantum Computing
- 2.3. Optical Computing
- 2.4. Edge Computing
- 2.5. Other Computing Types
-
3. Deployement
- 3.1. Cloud
- 3.2. On-Premise
-
4. End-user
- 4.1. Automotive & Transportation
- 4.2. Energy & Utilities
- 4.3. Healthcare
- 4.4. BFSI
- 4.5. Aerospace & Defense
- 4.6. Media & Entertainment
- 4.7. IT & Telecom
- 4.8. Retail
- 4.9. Manufacturing
- 4.10. Other End Users
Next-generation Computing Market Segmentation By Geography
- 1. North America
- 2. Europe
- 3. Asia
- 4. Australia and New Zealand
- 5. Latin America
- 6. Middle East and Africa
Next-generation Computing Market REPORT HIGHLIGHTS
| Aspects | Details |
|---|---|
| Study Period | 2019-2033 |
| Base Year | 2024 |
| Estimated Year | 2025 |
| Forecast Period | 2025-2033 |
| Historical Period | 2019-2024 |
| Growth Rate | CAGR of 19.38% from 2019-2033 |
| Segmentation |
|
Table of Contents
- 1. Introduction
- 1.1. Research Scope
- 1.2. Market Segmentation
- 1.3. Research Methodology
- 1.4. Definitions and Assumptions
- 2. Executive Summary
- 2.1. Introduction
- 3. Market Dynamics
- 3.1. Introduction
- 3.2. Market Drivers
- 3.2.1. Growth in demand for high performance computing; Adoption of Advanced Analytics in SMEs
- 3.3. Market Restrains
- 3.3.1. Risk of Data Breach in Storing and Processing Large Data in Next-gen Computing; High operational challenges in Implementing the Solution
- 3.4. Market Trends
- 3.4.1. The Cloud Deployment of The Solutions Significantly Contributes to The Market Growth
- 4. Market Factor Analysis
- 4.1. Porters Five Forces
- 4.2. Supply/Value Chain
- 4.3. PESTEL analysis
- 4.4. Market Entropy
- 4.5. Patent/Trademark Analysis
- 5. Global Next-generation Computing Market Analysis, Insights and Forecast, 2019-2031
- 5.1. Market Analysis, Insights and Forecast - by Component
- 5.1.1. Hardware
- 5.1.2. Software
- 5.1.3. Services
- 5.2. Market Analysis, Insights and Forecast - by Computing Type
- 5.2.1. High-Performance Computing
- 5.2.2. Quantum Computing
- 5.2.3. Optical Computing
- 5.2.4. Edge Computing
- 5.2.5. Other Computing Types
- 5.3. Market Analysis, Insights and Forecast - by Deployement
- 5.3.1. Cloud
- 5.3.2. On-Premise
- 5.4. Market Analysis, Insights and Forecast - by End-user
- 5.4.1. Automotive & Transportation
- 5.4.2. Energy & Utilities
- 5.4.3. Healthcare
- 5.4.4. BFSI
- 5.4.5. Aerospace & Defense
- 5.4.6. Media & Entertainment
- 5.4.7. IT & Telecom
- 5.4.8. Retail
- 5.4.9. Manufacturing
- 5.4.10. Other End Users
- 5.5. Market Analysis, Insights and Forecast - by Region
- 5.5.1. North America
- 5.5.2. Europe
- 5.5.3. Asia
- 5.5.4. Australia and New Zealand
- 5.5.5. Latin America
- 5.5.6. Middle East and Africa
- 5.1. Market Analysis, Insights and Forecast - by Component
- 6. North America Next-generation Computing Market Analysis, Insights and Forecast, 2019-2031
- 6.1. Market Analysis, Insights and Forecast - by Component
- 6.1.1. Hardware
- 6.1.2. Software
- 6.1.3. Services
- 6.2. Market Analysis, Insights and Forecast - by Computing Type
- 6.2.1. High-Performance Computing
- 6.2.2. Quantum Computing
- 6.2.3. Optical Computing
- 6.2.4. Edge Computing
- 6.2.5. Other Computing Types
- 6.3. Market Analysis, Insights and Forecast - by Deployement
- 6.3.1. Cloud
- 6.3.2. On-Premise
- 6.4. Market Analysis, Insights and Forecast - by End-user
- 6.4.1. Automotive & Transportation
- 6.4.2. Energy & Utilities
- 6.4.3. Healthcare
- 6.4.4. BFSI
- 6.4.5. Aerospace & Defense
- 6.4.6. Media & Entertainment
- 6.4.7. IT & Telecom
- 6.4.8. Retail
- 6.4.9. Manufacturing
- 6.4.10. Other End Users
- 6.1. Market Analysis, Insights and Forecast - by Component
- 7. Europe Next-generation Computing Market Analysis, Insights and Forecast, 2019-2031
- 7.1. Market Analysis, Insights and Forecast - by Component
- 7.1.1. Hardware
- 7.1.2. Software
- 7.1.3. Services
- 7.2. Market Analysis, Insights and Forecast - by Computing Type
- 7.2.1. High-Performance Computing
- 7.2.2. Quantum Computing
- 7.2.3. Optical Computing
- 7.2.4. Edge Computing
- 7.2.5. Other Computing Types
- 7.3. Market Analysis, Insights and Forecast - by Deployement
- 7.3.1. Cloud
- 7.3.2. On-Premise
- 7.4. Market Analysis, Insights and Forecast - by End-user
- 7.4.1. Automotive & Transportation
- 7.4.2. Energy & Utilities
- 7.4.3. Healthcare
- 7.4.4. BFSI
- 7.4.5. Aerospace & Defense
- 7.4.6. Media & Entertainment
- 7.4.7. IT & Telecom
- 7.4.8. Retail
- 7.4.9. Manufacturing
- 7.4.10. Other End Users
- 7.1. Market Analysis, Insights and Forecast - by Component
- 8. Asia Next-generation Computing Market Analysis, Insights and Forecast, 2019-2031
- 8.1. Market Analysis, Insights and Forecast - by Component
- 8.1.1. Hardware
- 8.1.2. Software
- 8.1.3. Services
- 8.2. Market Analysis, Insights and Forecast - by Computing Type
- 8.2.1. High-Performance Computing
- 8.2.2. Quantum Computing
- 8.2.3. Optical Computing
- 8.2.4. Edge Computing
- 8.2.5. Other Computing Types
- 8.3. Market Analysis, Insights and Forecast - by Deployement
- 8.3.1. Cloud
- 8.3.2. On-Premise
- 8.4. Market Analysis, Insights and Forecast - by End-user
- 8.4.1. Automotive & Transportation
- 8.4.2. Energy & Utilities
- 8.4.3. Healthcare
- 8.4.4. BFSI
- 8.4.5. Aerospace & Defense
- 8.4.6. Media & Entertainment
- 8.4.7. IT & Telecom
- 8.4.8. Retail
- 8.4.9. Manufacturing
- 8.4.10. Other End Users
- 8.1. Market Analysis, Insights and Forecast - by Component
- 9. Australia and New Zealand Next-generation Computing Market Analysis, Insights and Forecast, 2019-2031
- 9.1. Market Analysis, Insights and Forecast - by Component
- 9.1.1. Hardware
- 9.1.2. Software
- 9.1.3. Services
- 9.2. Market Analysis, Insights and Forecast - by Computing Type
- 9.2.1. High-Performance Computing
- 9.2.2. Quantum Computing
- 9.2.3. Optical Computing
- 9.2.4. Edge Computing
- 9.2.5. Other Computing Types
- 9.3. Market Analysis, Insights and Forecast - by Deployement
- 9.3.1. Cloud
- 9.3.2. On-Premise
- 9.4. Market Analysis, Insights and Forecast - by End-user
- 9.4.1. Automotive & Transportation
- 9.4.2. Energy & Utilities
- 9.4.3. Healthcare
- 9.4.4. BFSI
- 9.4.5. Aerospace & Defense
- 9.4.6. Media & Entertainment
- 9.4.7. IT & Telecom
- 9.4.8. Retail
- 9.4.9. Manufacturing
- 9.4.10. Other End Users
- 9.1. Market Analysis, Insights and Forecast - by Component
- 10. Latin America Next-generation Computing Market Analysis, Insights and Forecast, 2019-2031
- 10.1. Market Analysis, Insights and Forecast - by Component
- 10.1.1. Hardware
- 10.1.2. Software
- 10.1.3. Services
- 10.2. Market Analysis, Insights and Forecast - by Computing Type
- 10.2.1. High-Performance Computing
- 10.2.2. Quantum Computing
- 10.2.3. Optical Computing
- 10.2.4. Edge Computing
- 10.2.5. Other Computing Types
- 10.3. Market Analysis, Insights and Forecast - by Deployement
- 10.3.1. Cloud
- 10.3.2. On-Premise
- 10.4. Market Analysis, Insights and Forecast - by End-user
- 10.4.1. Automotive & Transportation
- 10.4.2. Energy & Utilities
- 10.4.3. Healthcare
- 10.4.4. BFSI
- 10.4.5. Aerospace & Defense
- 10.4.6. Media & Entertainment
- 10.4.7. IT & Telecom
- 10.4.8. Retail
- 10.4.9. Manufacturing
- 10.4.10. Other End Users
- 10.1. Market Analysis, Insights and Forecast - by Component
- 11. Middle East and Africa Next-generation Computing Market Analysis, Insights and Forecast, 2019-2031
- 11.1. Market Analysis, Insights and Forecast - by Component
- 11.1.1. Hardware
- 11.1.2. Software
- 11.1.3. Services
- 11.2. Market Analysis, Insights and Forecast - by Computing Type
- 11.2.1. High-Performance Computing
- 11.2.2. Quantum Computing
- 11.2.3. Optical Computing
- 11.2.4. Edge Computing
- 11.2.5. Other Computing Types
- 11.3. Market Analysis, Insights and Forecast - by Deployement
- 11.3.1. Cloud
- 11.3.2. On-Premise
- 11.4. Market Analysis, Insights and Forecast - by End-user
- 11.4.1. Automotive & Transportation
- 11.4.2. Energy & Utilities
- 11.4.3. Healthcare
- 11.4.4. BFSI
- 11.4.5. Aerospace & Defense
- 11.4.6. Media & Entertainment
- 11.4.7. IT & Telecom
- 11.4.8. Retail
- 11.4.9. Manufacturing
- 11.4.10. Other End Users
- 11.1. Market Analysis, Insights and Forecast - by Component
- 12. North America Next-generation Computing Market Analysis, Insights and Forecast, 2019-2031
- 12.1. Market Analysis, Insights and Forecast - By Country/Sub-region
- 12.1.1 United States
- 12.1.2 Canada
- 12.1.3 Mexico
- 13. Europe Next-generation Computing Market Analysis, Insights and Forecast, 2019-2031
- 13.1. Market Analysis, Insights and Forecast - By Country/Sub-region
- 13.1.1 Germany
- 13.1.2 United Kingdom
- 13.1.3 France
- 13.1.4 Spain
- 13.1.5 Italy
- 13.1.6 Spain
- 13.1.7 Belgium
- 13.1.8 Netherland
- 13.1.9 Nordics
- 13.1.10 Rest of Europe
- 14. Asia Pacific Next-generation Computing Market Analysis, Insights and Forecast, 2019-2031
- 14.1. Market Analysis, Insights and Forecast - By Country/Sub-region
- 14.1.1 China
- 14.1.2 Japan
- 14.1.3 India
- 14.1.4 South Korea
- 14.1.5 Southeast Asia
- 14.1.6 Australia
- 14.1.7 Indonesia
- 14.1.8 Phillipes
- 14.1.9 Singapore
- 14.1.10 Thailandc
- 14.1.11 Rest of Asia Pacific
- 15. South America Next-generation Computing Market Analysis, Insights and Forecast, 2019-2031
- 15.1. Market Analysis, Insights and Forecast - By Country/Sub-region
- 15.1.1 Brazil
- 15.1.2 Argentina
- 15.1.3 Peru
- 15.1.4 Chile
- 15.1.5 Colombia
- 15.1.6 Ecuador
- 15.1.7 Venezuela
- 15.1.8 Rest of South America
- 16. North America Next-generation Computing Market Analysis, Insights and Forecast, 2019-2031
- 16.1. Market Analysis, Insights and Forecast - By Country/Sub-region
- 16.1.1 United States
- 16.1.2 Canada
- 16.1.3 Mexico
- 17. MEA Next-generation Computing Market Analysis, Insights and Forecast, 2019-2031
- 17.1. Market Analysis, Insights and Forecast - By Country/Sub-region
- 17.1.1 United Arab Emirates
- 17.1.2 Saudi Arabia
- 17.1.3 South Africa
- 17.1.4 Rest of Middle East and Africa
- 18. Competitive Analysis
- 18.1. Global Market Share Analysis 2024
- 18.2. Company Profiles
- 18.2.1 IBM Corporation
- 18.2.1.1. Overview
- 18.2.1.2. Products
- 18.2.1.3. SWOT Analysis
- 18.2.1.4. Recent Developments
- 18.2.1.5. Financials (Based on Availability)
- 18.2.2 Alibaba Group Holding Limited
- 18.2.2.1. Overview
- 18.2.2.2. Products
- 18.2.2.3. SWOT Analysis
- 18.2.2.4. Recent Developments
- 18.2.2.5. Financials (Based on Availability)
- 18.2.3 Google LLC
- 18.2.3.1. Overview
- 18.2.3.2. Products
- 18.2.3.3. SWOT Analysis
- 18.2.3.4. Recent Developments
- 18.2.3.5. Financials (Based on Availability)
- 18.2.4 Microsoft Corporation
- 18.2.4.1. Overview
- 18.2.4.2. Products
- 18.2.4.3. SWOT Analysis
- 18.2.4.4. Recent Developments
- 18.2.4.5. Financials (Based on Availability)
- 18.2.5 Amazon Web Services Inc
- 18.2.5.1. Overview
- 18.2.5.2. Products
- 18.2.5.3. SWOT Analysis
- 18.2.5.4. Recent Developments
- 18.2.5.5. Financials (Based on Availability)
- 18.2.6 NVIDIA Corp
- 18.2.6.1. Overview
- 18.2.6.2. Products
- 18.2.6.3. SWOT Analysis
- 18.2.6.4. Recent Developments
- 18.2.6.5. Financials (Based on Availability)
- 18.2.7 NEC Corporation
- 18.2.7.1. Overview
- 18.2.7.2. Products
- 18.2.7.3. SWOT Analysis
- 18.2.7.4. Recent Developments
- 18.2.7.5. Financials (Based on Availability)
- 18.2.8 Oracle Corporation
- 18.2.8.1. Overview
- 18.2.8.2. Products
- 18.2.8.3. SWOT Analysis
- 18.2.8.4. Recent Developments
- 18.2.8.5. Financials (Based on Availability)
- 18.2.9 Cisco Systems
- 18.2.9.1. Overview
- 18.2.9.2. Products
- 18.2.9.3. SWOT Analysis
- 18.2.9.4. Recent Developments
- 18.2.9.5. Financials (Based on Availability)
- 18.2.10 Intel Corporation
- 18.2.10.1. Overview
- 18.2.10.2. Products
- 18.2.10.3. SWOT Analysis
- 18.2.10.4. Recent Developments
- 18.2.10.5. Financials (Based on Availability)
- 18.2.1 IBM Corporation
List of Figures
- Figure 1: Global Next-generation Computing Market Revenue Breakdown (Million, %) by Region 2024 & 2032
- Figure 2: Global Next-generation Computing Market Volume Breakdown (K Unit, %) by Region 2024 & 2032
- Figure 3: North America Next-generation Computing Market Revenue (Million), by Country 2024 & 2032
- Figure 4: North America Next-generation Computing Market Volume (K Unit), by Country 2024 & 2032
- Figure 5: North America Next-generation Computing Market Revenue Share (%), by Country 2024 & 2032
- Figure 6: North America Next-generation Computing Market Volume Share (%), by Country 2024 & 2032
- Figure 7: Europe Next-generation Computing Market Revenue (Million), by Country 2024 & 2032
- Figure 8: Europe Next-generation Computing Market Volume (K Unit), by Country 2024 & 2032
- Figure 9: Europe Next-generation Computing Market Revenue Share (%), by Country 2024 & 2032
- Figure 10: Europe Next-generation Computing Market Volume Share (%), by Country 2024 & 2032
- Figure 11: Asia Pacific Next-generation Computing Market Revenue (Million), by Country 2024 & 2032
- Figure 12: Asia Pacific Next-generation Computing Market Volume (K Unit), by Country 2024 & 2032
- Figure 13: Asia Pacific Next-generation Computing Market Revenue Share (%), by Country 2024 & 2032
- Figure 14: Asia Pacific Next-generation Computing Market Volume Share (%), by Country 2024 & 2032
- Figure 15: South America Next-generation Computing Market Revenue (Million), by Country 2024 & 2032
- Figure 16: South America Next-generation Computing Market Volume (K Unit), by Country 2024 & 2032
- Figure 17: South America Next-generation Computing Market Revenue Share (%), by Country 2024 & 2032
- Figure 18: South America Next-generation Computing Market Volume Share (%), by Country 2024 & 2032
- Figure 19: North America Next-generation Computing Market Revenue (Million), by Country 2024 & 2032
- Figure 20: North America Next-generation Computing Market Volume (K Unit), by Country 2024 & 2032
- Figure 21: North America Next-generation Computing Market Revenue Share (%), by Country 2024 & 2032
- Figure 22: North America Next-generation Computing Market Volume Share (%), by Country 2024 & 2032
- Figure 23: MEA Next-generation Computing Market Revenue (Million), by Country 2024 & 2032
- Figure 24: MEA Next-generation Computing Market Volume (K Unit), by Country 2024 & 2032
- Figure 25: MEA Next-generation Computing Market Revenue Share (%), by Country 2024 & 2032
- Figure 26: MEA Next-generation Computing Market Volume Share (%), by Country 2024 & 2032
- Figure 27: North America Next-generation Computing Market Revenue (Million), by Component 2024 & 2032
- Figure 28: North America Next-generation Computing Market Volume (K Unit), by Component 2024 & 2032
- Figure 29: North America Next-generation Computing Market Revenue Share (%), by Component 2024 & 2032
- Figure 30: North America Next-generation Computing Market Volume Share (%), by Component 2024 & 2032
- Figure 31: North America Next-generation Computing Market Revenue (Million), by Computing Type 2024 & 2032
- Figure 32: North America Next-generation Computing Market Volume (K Unit), by Computing Type 2024 & 2032
- Figure 33: North America Next-generation Computing Market Revenue Share (%), by Computing Type 2024 & 2032
- Figure 34: North America Next-generation Computing Market Volume Share (%), by Computing Type 2024 & 2032
- Figure 35: North America Next-generation Computing Market Revenue (Million), by Deployement 2024 & 2032
- Figure 36: North America Next-generation Computing Market Volume (K Unit), by Deployement 2024 & 2032
- Figure 37: North America Next-generation Computing Market Revenue Share (%), by Deployement 2024 & 2032
- Figure 38: North America Next-generation Computing Market Volume Share (%), by Deployement 2024 & 2032
- Figure 39: North America Next-generation Computing Market Revenue (Million), by End-user 2024 & 2032
- Figure 40: North America Next-generation Computing Market Volume (K Unit), by End-user 2024 & 2032
- Figure 41: North America Next-generation Computing Market Revenue Share (%), by End-user 2024 & 2032
- Figure 42: North America Next-generation Computing Market Volume Share (%), by End-user 2024 & 2032
- Figure 43: North America Next-generation Computing Market Revenue (Million), by Country 2024 & 2032
- Figure 44: North America Next-generation Computing Market Volume (K Unit), by Country 2024 & 2032
- Figure 45: North America Next-generation Computing Market Revenue Share (%), by Country 2024 & 2032
- Figure 46: North America Next-generation Computing Market Volume Share (%), by Country 2024 & 2032
- Figure 47: Europe Next-generation Computing Market Revenue (Million), by Component 2024 & 2032
- Figure 48: Europe Next-generation Computing Market Volume (K Unit), by Component 2024 & 2032
- Figure 49: Europe Next-generation Computing Market Revenue Share (%), by Component 2024 & 2032
- Figure 50: Europe Next-generation Computing Market Volume Share (%), by Component 2024 & 2032
- Figure 51: Europe Next-generation Computing Market Revenue (Million), by Computing Type 2024 & 2032
- Figure 52: Europe Next-generation Computing Market Volume (K Unit), by Computing Type 2024 & 2032
- Figure 53: Europe Next-generation Computing Market Revenue Share (%), by Computing Type 2024 & 2032
- Figure 54: Europe Next-generation Computing Market Volume Share (%), by Computing Type 2024 & 2032
- Figure 55: Europe Next-generation Computing Market Revenue (Million), by Deployement 2024 & 2032
- Figure 56: Europe Next-generation Computing Market Volume (K Unit), by Deployement 2024 & 2032
- Figure 57: Europe Next-generation Computing Market Revenue Share (%), by Deployement 2024 & 2032
- Figure 58: Europe Next-generation Computing Market Volume Share (%), by Deployement 2024 & 2032
- Figure 59: Europe Next-generation Computing Market Revenue (Million), by End-user 2024 & 2032
- Figure 60: Europe Next-generation Computing Market Volume (K Unit), by End-user 2024 & 2032
- Figure 61: Europe Next-generation Computing Market Revenue Share (%), by End-user 2024 & 2032
- Figure 62: Europe Next-generation Computing Market Volume Share (%), by End-user 2024 & 2032
- Figure 63: Europe Next-generation Computing Market Revenue (Million), by Country 2024 & 2032
- Figure 64: Europe Next-generation Computing Market Volume (K Unit), by Country 2024 & 2032
- Figure 65: Europe Next-generation Computing Market Revenue Share (%), by Country 2024 & 2032
- Figure 66: Europe Next-generation Computing Market Volume Share (%), by Country 2024 & 2032
- Figure 67: Asia Next-generation Computing Market Revenue (Million), by Component 2024 & 2032
- Figure 68: Asia Next-generation Computing Market Volume (K Unit), by Component 2024 & 2032
- Figure 69: Asia Next-generation Computing Market Revenue Share (%), by Component 2024 & 2032
- Figure 70: Asia Next-generation Computing Market Volume Share (%), by Component 2024 & 2032
- Figure 71: Asia Next-generation Computing Market Revenue (Million), by Computing Type 2024 & 2032
- Figure 72: Asia Next-generation Computing Market Volume (K Unit), by Computing Type 2024 & 2032
- Figure 73: Asia Next-generation Computing Market Revenue Share (%), by Computing Type 2024 & 2032
- Figure 74: Asia Next-generation Computing Market Volume Share (%), by Computing Type 2024 & 2032
- Figure 75: Asia Next-generation Computing Market Revenue (Million), by Deployement 2024 & 2032
- Figure 76: Asia Next-generation Computing Market Volume (K Unit), by Deployement 2024 & 2032
- Figure 77: Asia Next-generation Computing Market Revenue Share (%), by Deployement 2024 & 2032
- Figure 78: Asia Next-generation Computing Market Volume Share (%), by Deployement 2024 & 2032
- Figure 79: Asia Next-generation Computing Market Revenue (Million), by End-user 2024 & 2032
- Figure 80: Asia Next-generation Computing Market Volume (K Unit), by End-user 2024 & 2032
- Figure 81: Asia Next-generation Computing Market Revenue Share (%), by End-user 2024 & 2032
- Figure 82: Asia Next-generation Computing Market Volume Share (%), by End-user 2024 & 2032
- Figure 83: Asia Next-generation Computing Market Revenue (Million), by Country 2024 & 2032
- Figure 84: Asia Next-generation Computing Market Volume (K Unit), by Country 2024 & 2032
- Figure 85: Asia Next-generation Computing Market Revenue Share (%), by Country 2024 & 2032
- Figure 86: Asia Next-generation Computing Market Volume Share (%), by Country 2024 & 2032
- Figure 87: Australia and New Zealand Next-generation Computing Market Revenue (Million), by Component 2024 & 2032
- Figure 88: Australia and New Zealand Next-generation Computing Market Volume (K Unit), by Component 2024 & 2032
- Figure 89: Australia and New Zealand Next-generation Computing Market Revenue Share (%), by Component 2024 & 2032
- Figure 90: Australia and New Zealand Next-generation Computing Market Volume Share (%), by Component 2024 & 2032
- Figure 91: Australia and New Zealand Next-generation Computing Market Revenue (Million), by Computing Type 2024 & 2032
- Figure 92: Australia and New Zealand Next-generation Computing Market Volume (K Unit), by Computing Type 2024 & 2032
- Figure 93: Australia and New Zealand Next-generation Computing Market Revenue Share (%), by Computing Type 2024 & 2032
- Figure 94: Australia and New Zealand Next-generation Computing Market Volume Share (%), by Computing Type 2024 & 2032
- Figure 95: Australia and New Zealand Next-generation Computing Market Revenue (Million), by Deployement 2024 & 2032
- Figure 96: Australia and New Zealand Next-generation Computing Market Volume (K Unit), by Deployement 2024 & 2032
- Figure 97: Australia and New Zealand Next-generation Computing Market Revenue Share (%), by Deployement 2024 & 2032
- Figure 98: Australia and New Zealand Next-generation Computing Market Volume Share (%), by Deployement 2024 & 2032
- Figure 99: Australia and New Zealand Next-generation Computing Market Revenue (Million), by End-user 2024 & 2032
- Figure 100: Australia and New Zealand Next-generation Computing Market Volume (K Unit), by End-user 2024 & 2032
- Figure 101: Australia and New Zealand Next-generation Computing Market Revenue Share (%), by End-user 2024 & 2032
- Figure 102: Australia and New Zealand Next-generation Computing Market Volume Share (%), by End-user 2024 & 2032
- Figure 103: Australia and New Zealand Next-generation Computing Market Revenue (Million), by Country 2024 & 2032
- Figure 104: Australia and New Zealand Next-generation Computing Market Volume (K Unit), by Country 2024 & 2032
- Figure 105: Australia and New Zealand Next-generation Computing Market Revenue Share (%), by Country 2024 & 2032
- Figure 106: Australia and New Zealand Next-generation Computing Market Volume Share (%), by Country 2024 & 2032
- Figure 107: Latin America Next-generation Computing Market Revenue (Million), by Component 2024 & 2032
- Figure 108: Latin America Next-generation Computing Market Volume (K Unit), by Component 2024 & 2032
- Figure 109: Latin America Next-generation Computing Market Revenue Share (%), by Component 2024 & 2032
- Figure 110: Latin America Next-generation Computing Market Volume Share (%), by Component 2024 & 2032
- Figure 111: Latin America Next-generation Computing Market Revenue (Million), by Computing Type 2024 & 2032
- Figure 112: Latin America Next-generation Computing Market Volume (K Unit), by Computing Type 2024 & 2032
- Figure 113: Latin America Next-generation Computing Market Revenue Share (%), by Computing Type 2024 & 2032
- Figure 114: Latin America Next-generation Computing Market Volume Share (%), by Computing Type 2024 & 2032
- Figure 115: Latin America Next-generation Computing Market Revenue (Million), by Deployement 2024 & 2032
- Figure 116: Latin America Next-generation Computing Market Volume (K Unit), by Deployement 2024 & 2032
- Figure 117: Latin America Next-generation Computing Market Revenue Share (%), by Deployement 2024 & 2032
- Figure 118: Latin America Next-generation Computing Market Volume Share (%), by Deployement 2024 & 2032
- Figure 119: Latin America Next-generation Computing Market Revenue (Million), by End-user 2024 & 2032
- Figure 120: Latin America Next-generation Computing Market Volume (K Unit), by End-user 2024 & 2032
- Figure 121: Latin America Next-generation Computing Market Revenue Share (%), by End-user 2024 & 2032
- Figure 122: Latin America Next-generation Computing Market Volume Share (%), by End-user 2024 & 2032
- Figure 123: Latin America Next-generation Computing Market Revenue (Million), by Country 2024 & 2032
- Figure 124: Latin America Next-generation Computing Market Volume (K Unit), by Country 2024 & 2032
- Figure 125: Latin America Next-generation Computing Market Revenue Share (%), by Country 2024 & 2032
- Figure 126: Latin America Next-generation Computing Market Volume Share (%), by Country 2024 & 2032
- Figure 127: Middle East and Africa Next-generation Computing Market Revenue (Million), by Component 2024 & 2032
- Figure 128: Middle East and Africa Next-generation Computing Market Volume (K Unit), by Component 2024 & 2032
- Figure 129: Middle East and Africa Next-generation Computing Market Revenue Share (%), by Component 2024 & 2032
- Figure 130: Middle East and Africa Next-generation Computing Market Volume Share (%), by Component 2024 & 2032
- Figure 131: Middle East and Africa Next-generation Computing Market Revenue (Million), by Computing Type 2024 & 2032
- Figure 132: Middle East and Africa Next-generation Computing Market Volume (K Unit), by Computing Type 2024 & 2032
- Figure 133: Middle East and Africa Next-generation Computing Market Revenue Share (%), by Computing Type 2024 & 2032
- Figure 134: Middle East and Africa Next-generation Computing Market Volume Share (%), by Computing Type 2024 & 2032
- Figure 135: Middle East and Africa Next-generation Computing Market Revenue (Million), by Deployement 2024 & 2032
- Figure 136: Middle East and Africa Next-generation Computing Market Volume (K Unit), by Deployement 2024 & 2032
- Figure 137: Middle East and Africa Next-generation Computing Market Revenue Share (%), by Deployement 2024 & 2032
- Figure 138: Middle East and Africa Next-generation Computing Market Volume Share (%), by Deployement 2024 & 2032
- Figure 139: Middle East and Africa Next-generation Computing Market Revenue (Million), by End-user 2024 & 2032
- Figure 140: Middle East and Africa Next-generation Computing Market Volume (K Unit), by End-user 2024 & 2032
- Figure 141: Middle East and Africa Next-generation Computing Market Revenue Share (%), by End-user 2024 & 2032
- Figure 142: Middle East and Africa Next-generation Computing Market Volume Share (%), by End-user 2024 & 2032
- Figure 143: Middle East and Africa Next-generation Computing Market Revenue (Million), by Country 2024 & 2032
- Figure 144: Middle East and Africa Next-generation Computing Market Volume (K Unit), by Country 2024 & 2032
- Figure 145: Middle East and Africa Next-generation Computing Market Revenue Share (%), by Country 2024 & 2032
- Figure 146: Middle East and Africa Next-generation Computing Market Volume Share (%), by Country 2024 & 2032
List of Tables
- Table 1: Global Next-generation Computing Market Revenue Million Forecast, by Region 2019 & 2032
- Table 2: Global Next-generation Computing Market Volume K Unit Forecast, by Region 2019 & 2032
- Table 3: Global Next-generation Computing Market Revenue Million Forecast, by Component 2019 & 2032
- Table 4: Global Next-generation Computing Market Volume K Unit Forecast, by Component 2019 & 2032
- Table 5: Global Next-generation Computing Market Revenue Million Forecast, by Computing Type 2019 & 2032
- Table 6: Global Next-generation Computing Market Volume K Unit Forecast, by Computing Type 2019 & 2032
- Table 7: Global Next-generation Computing Market Revenue Million Forecast, by Deployement 2019 & 2032
- Table 8: Global Next-generation Computing Market Volume K Unit Forecast, by Deployement 2019 & 2032
- Table 9: Global Next-generation Computing Market Revenue Million Forecast, by End-user 2019 & 2032
- Table 10: Global Next-generation Computing Market Volume K Unit Forecast, by End-user 2019 & 2032
- Table 11: Global Next-generation Computing Market Revenue Million Forecast, by Region 2019 & 2032
- Table 12: Global Next-generation Computing Market Volume K Unit Forecast, by Region 2019 & 2032
- Table 13: Global Next-generation Computing Market Revenue Million Forecast, by Country 2019 & 2032
- Table 14: Global Next-generation Computing Market Volume K Unit Forecast, by Country 2019 & 2032
- Table 15: United States Next-generation Computing Market Revenue (Million) Forecast, by Application 2019 & 2032
- Table 16: United States Next-generation Computing Market Volume (K Unit) Forecast, by Application 2019 & 2032
- Table 17: Canada Next-generation Computing Market Revenue (Million) Forecast, by Application 2019 & 2032
- Table 18: Canada Next-generation Computing Market Volume (K Unit) Forecast, by Application 2019 & 2032
- Table 19: Mexico Next-generation Computing Market Revenue (Million) Forecast, by Application 2019 & 2032
- Table 20: Mexico Next-generation Computing Market Volume (K Unit) Forecast, by Application 2019 & 2032
- Table 21: Global Next-generation Computing Market Revenue Million Forecast, by Country 2019 & 2032
- Table 22: Global Next-generation Computing Market Volume K Unit Forecast, by Country 2019 & 2032
- Table 23: Germany Next-generation Computing Market Revenue (Million) Forecast, by Application 2019 & 2032
- Table 24: Germany Next-generation Computing Market Volume (K Unit) Forecast, by Application 2019 & 2032
- Table 25: United Kingdom Next-generation Computing Market Revenue (Million) Forecast, by Application 2019 & 2032
- Table 26: United Kingdom Next-generation Computing Market Volume (K Unit) Forecast, by Application 2019 & 2032
- Table 27: France Next-generation Computing Market Revenue (Million) Forecast, by Application 2019 & 2032
- Table 28: France Next-generation Computing Market Volume (K Unit) Forecast, by Application 2019 & 2032
- Table 29: Spain Next-generation Computing Market Revenue (Million) Forecast, by Application 2019 & 2032
- Table 30: Spain Next-generation Computing Market Volume (K Unit) Forecast, by Application 2019 & 2032
- Table 31: Italy Next-generation Computing Market Revenue (Million) Forecast, by Application 2019 & 2032
- Table 32: Italy Next-generation Computing Market Volume (K Unit) Forecast, by Application 2019 & 2032
- Table 33: Spain Next-generation Computing Market Revenue (Million) Forecast, by Application 2019 & 2032
- Table 34: Spain Next-generation Computing Market Volume (K Unit) Forecast, by Application 2019 & 2032
- Table 35: Belgium Next-generation Computing Market Revenue (Million) Forecast, by Application 2019 & 2032
- Table 36: Belgium Next-generation Computing Market Volume (K Unit) Forecast, by Application 2019 & 2032
- Table 37: Netherland Next-generation Computing Market Revenue (Million) Forecast, by Application 2019 & 2032
- Table 38: Netherland Next-generation Computing Market Volume (K Unit) Forecast, by Application 2019 & 2032
- Table 39: Nordics Next-generation Computing Market Revenue (Million) Forecast, by Application 2019 & 2032
- Table 40: Nordics Next-generation Computing Market Volume (K Unit) Forecast, by Application 2019 & 2032
- Table 41: Rest of Europe Next-generation Computing Market Revenue (Million) Forecast, by Application 2019 & 2032
- Table 42: Rest of Europe Next-generation Computing Market Volume (K Unit) Forecast, by Application 2019 & 2032
- Table 43: Global Next-generation Computing Market Revenue Million Forecast, by Country 2019 & 2032
- Table 44: Global Next-generation Computing Market Volume K Unit Forecast, by Country 2019 & 2032
- Table 45: China Next-generation Computing Market Revenue (Million) Forecast, by Application 2019 & 2032
- Table 46: China Next-generation Computing Market Volume (K Unit) Forecast, by Application 2019 & 2032
- Table 47: Japan Next-generation Computing Market Revenue (Million) Forecast, by Application 2019 & 2032
- Table 48: Japan Next-generation Computing Market Volume (K Unit) Forecast, by Application 2019 & 2032
- Table 49: India Next-generation Computing Market Revenue (Million) Forecast, by Application 2019 & 2032
- Table 50: India Next-generation Computing Market Volume (K Unit) Forecast, by Application 2019 & 2032
- Table 51: South Korea Next-generation Computing Market Revenue (Million) Forecast, by Application 2019 & 2032
- Table 52: South Korea Next-generation Computing Market Volume (K Unit) Forecast, by Application 2019 & 2032
- Table 53: Southeast Asia Next-generation Computing Market Revenue (Million) Forecast, by Application 2019 & 2032
- Table 54: Southeast Asia Next-generation Computing Market Volume (K Unit) Forecast, by Application 2019 & 2032
- Table 55: Australia Next-generation Computing Market Revenue (Million) Forecast, by Application 2019 & 2032
- Table 56: Australia Next-generation Computing Market Volume (K Unit) Forecast, by Application 2019 & 2032
- Table 57: Indonesia Next-generation Computing Market Revenue (Million) Forecast, by Application 2019 & 2032
- Table 58: Indonesia Next-generation Computing Market Volume (K Unit) Forecast, by Application 2019 & 2032
- Table 59: Phillipes Next-generation Computing Market Revenue (Million) Forecast, by Application 2019 & 2032
- Table 60: Phillipes Next-generation Computing Market Volume (K Unit) Forecast, by Application 2019 & 2032
- Table 61: Singapore Next-generation Computing Market Revenue (Million) Forecast, by Application 2019 & 2032
- Table 62: Singapore Next-generation Computing Market Volume (K Unit) Forecast, by Application 2019 & 2032
- Table 63: Thailandc Next-generation Computing Market Revenue (Million) Forecast, by Application 2019 & 2032
- Table 64: Thailandc Next-generation Computing Market Volume (K Unit) Forecast, by Application 2019 & 2032
- Table 65: Rest of Asia Pacific Next-generation Computing Market Revenue (Million) Forecast, by Application 2019 & 2032
- Table 66: Rest of Asia Pacific Next-generation Computing Market Volume (K Unit) Forecast, by Application 2019 & 2032
- Table 67: Global Next-generation Computing Market Revenue Million Forecast, by Country 2019 & 2032
- Table 68: Global Next-generation Computing Market Volume K Unit Forecast, by Country 2019 & 2032
- Table 69: Brazil Next-generation Computing Market Revenue (Million) Forecast, by Application 2019 & 2032
- Table 70: Brazil Next-generation Computing Market Volume (K Unit) Forecast, by Application 2019 & 2032
- Table 71: Argentina Next-generation Computing Market Revenue (Million) Forecast, by Application 2019 & 2032
- Table 72: Argentina Next-generation Computing Market Volume (K Unit) Forecast, by Application 2019 & 2032
- Table 73: Peru Next-generation Computing Market Revenue (Million) Forecast, by Application 2019 & 2032
- Table 74: Peru Next-generation Computing Market Volume (K Unit) Forecast, by Application 2019 & 2032
- Table 75: Chile Next-generation Computing Market Revenue (Million) Forecast, by Application 2019 & 2032
- Table 76: Chile Next-generation Computing Market Volume (K Unit) Forecast, by Application 2019 & 2032
- Table 77: Colombia Next-generation Computing Market Revenue (Million) Forecast, by Application 2019 & 2032
- Table 78: Colombia Next-generation Computing Market Volume (K Unit) Forecast, by Application 2019 & 2032
- Table 79: Ecuador Next-generation Computing Market Revenue (Million) Forecast, by Application 2019 & 2032
- Table 80: Ecuador Next-generation Computing Market Volume (K Unit) Forecast, by Application 2019 & 2032
- Table 81: Venezuela Next-generation Computing Market Revenue (Million) Forecast, by Application 2019 & 2032
- Table 82: Venezuela Next-generation Computing Market Volume (K Unit) Forecast, by Application 2019 & 2032
- Table 83: Rest of South America Next-generation Computing Market Revenue (Million) Forecast, by Application 2019 & 2032
- Table 84: Rest of South America Next-generation Computing Market Volume (K Unit) Forecast, by Application 2019 & 2032
- Table 85: Global Next-generation Computing Market Revenue Million Forecast, by Country 2019 & 2032
- Table 86: Global Next-generation Computing Market Volume K Unit Forecast, by Country 2019 & 2032
- Table 87: United States Next-generation Computing Market Revenue (Million) Forecast, by Application 2019 & 2032
- Table 88: United States Next-generation Computing Market Volume (K Unit) Forecast, by Application 2019 & 2032
- Table 89: Canada Next-generation Computing Market Revenue (Million) Forecast, by Application 2019 & 2032
- Table 90: Canada Next-generation Computing Market Volume (K Unit) Forecast, by Application 2019 & 2032
- Table 91: Mexico Next-generation Computing Market Revenue (Million) Forecast, by Application 2019 & 2032
- Table 92: Mexico Next-generation Computing Market Volume (K Unit) Forecast, by Application 2019 & 2032
- Table 93: Global Next-generation Computing Market Revenue Million Forecast, by Country 2019 & 2032
- Table 94: Global Next-generation Computing Market Volume K Unit Forecast, by Country 2019 & 2032
- Table 95: United Arab Emirates Next-generation Computing Market Revenue (Million) Forecast, by Application 2019 & 2032
- Table 96: United Arab Emirates Next-generation Computing Market Volume (K Unit) Forecast, by Application 2019 & 2032
- Table 97: Saudi Arabia Next-generation Computing Market Revenue (Million) Forecast, by Application 2019 & 2032
- Table 98: Saudi Arabia Next-generation Computing Market Volume (K Unit) Forecast, by Application 2019 & 2032
- Table 99: South Africa Next-generation Computing Market Revenue (Million) Forecast, by Application 2019 & 2032
- Table 100: South Africa Next-generation Computing Market Volume (K Unit) Forecast, by Application 2019 & 2032
- Table 101: Rest of Middle East and Africa Next-generation Computing Market Revenue (Million) Forecast, by Application 2019 & 2032
- Table 102: Rest of Middle East and Africa Next-generation Computing Market Volume (K Unit) Forecast, by Application 2019 & 2032
- Table 103: Global Next-generation Computing Market Revenue Million Forecast, by Component 2019 & 2032
- Table 104: Global Next-generation Computing Market Volume K Unit Forecast, by Component 2019 & 2032
- Table 105: Global Next-generation Computing Market Revenue Million Forecast, by Computing Type 2019 & 2032
- Table 106: Global Next-generation Computing Market Volume K Unit Forecast, by Computing Type 2019 & 2032
- Table 107: Global Next-generation Computing Market Revenue Million Forecast, by Deployement 2019 & 2032
- Table 108: Global Next-generation Computing Market Volume K Unit Forecast, by Deployement 2019 & 2032
- Table 109: Global Next-generation Computing Market Revenue Million Forecast, by End-user 2019 & 2032
- Table 110: Global Next-generation Computing Market Volume K Unit Forecast, by End-user 2019 & 2032
- Table 111: Global Next-generation Computing Market Revenue Million Forecast, by Country 2019 & 2032
- Table 112: Global Next-generation Computing Market Volume K Unit Forecast, by Country 2019 & 2032
- Table 113: Global Next-generation Computing Market Revenue Million Forecast, by Component 2019 & 2032
- Table 114: Global Next-generation Computing Market Volume K Unit Forecast, by Component 2019 & 2032
- Table 115: Global Next-generation Computing Market Revenue Million Forecast, by Computing Type 2019 & 2032
- Table 116: Global Next-generation Computing Market Volume K Unit Forecast, by Computing Type 2019 & 2032
- Table 117: Global Next-generation Computing Market Revenue Million Forecast, by Deployement 2019 & 2032
- Table 118: Global Next-generation Computing Market Volume K Unit Forecast, by Deployement 2019 & 2032
- Table 119: Global Next-generation Computing Market Revenue Million Forecast, by End-user 2019 & 2032
- Table 120: Global Next-generation Computing Market Volume K Unit Forecast, by End-user 2019 & 2032
- Table 121: Global Next-generation Computing Market Revenue Million Forecast, by Country 2019 & 2032
- Table 122: Global Next-generation Computing Market Volume K Unit Forecast, by Country 2019 & 2032
- Table 123: Global Next-generation Computing Market Revenue Million Forecast, by Component 2019 & 2032
- Table 124: Global Next-generation Computing Market Volume K Unit Forecast, by Component 2019 & 2032
- Table 125: Global Next-generation Computing Market Revenue Million Forecast, by Computing Type 2019 & 2032
- Table 126: Global Next-generation Computing Market Volume K Unit Forecast, by Computing Type 2019 & 2032
- Table 127: Global Next-generation Computing Market Revenue Million Forecast, by Deployement 2019 & 2032
- Table 128: Global Next-generation Computing Market Volume K Unit Forecast, by Deployement 2019 & 2032
- Table 129: Global Next-generation Computing Market Revenue Million Forecast, by End-user 2019 & 2032
- Table 130: Global Next-generation Computing Market Volume K Unit Forecast, by End-user 2019 & 2032
- Table 131: Global Next-generation Computing Market Revenue Million Forecast, by Country 2019 & 2032
- Table 132: Global Next-generation Computing Market Volume K Unit Forecast, by Country 2019 & 2032
- Table 133: Global Next-generation Computing Market Revenue Million Forecast, by Component 2019 & 2032
- Table 134: Global Next-generation Computing Market Volume K Unit Forecast, by Component 2019 & 2032
- Table 135: Global Next-generation Computing Market Revenue Million Forecast, by Computing Type 2019 & 2032
- Table 136: Global Next-generation Computing Market Volume K Unit Forecast, by Computing Type 2019 & 2032
- Table 137: Global Next-generation Computing Market Revenue Million Forecast, by Deployement 2019 & 2032
- Table 138: Global Next-generation Computing Market Volume K Unit Forecast, by Deployement 2019 & 2032
- Table 139: Global Next-generation Computing Market Revenue Million Forecast, by End-user 2019 & 2032
- Table 140: Global Next-generation Computing Market Volume K Unit Forecast, by End-user 2019 & 2032
- Table 141: Global Next-generation Computing Market Revenue Million Forecast, by Country 2019 & 2032
- Table 142: Global Next-generation Computing Market Volume K Unit Forecast, by Country 2019 & 2032
- Table 143: Global Next-generation Computing Market Revenue Million Forecast, by Component 2019 & 2032
- Table 144: Global Next-generation Computing Market Volume K Unit Forecast, by Component 2019 & 2032
- Table 145: Global Next-generation Computing Market Revenue Million Forecast, by Computing Type 2019 & 2032
- Table 146: Global Next-generation Computing Market Volume K Unit Forecast, by Computing Type 2019 & 2032
- Table 147: Global Next-generation Computing Market Revenue Million Forecast, by Deployement 2019 & 2032
- Table 148: Global Next-generation Computing Market Volume K Unit Forecast, by Deployement 2019 & 2032
- Table 149: Global Next-generation Computing Market Revenue Million Forecast, by End-user 2019 & 2032
- Table 150: Global Next-generation Computing Market Volume K Unit Forecast, by End-user 2019 & 2032
- Table 151: Global Next-generation Computing Market Revenue Million Forecast, by Country 2019 & 2032
- Table 152: Global Next-generation Computing Market Volume K Unit Forecast, by Country 2019 & 2032
- Table 153: Global Next-generation Computing Market Revenue Million Forecast, by Component 2019 & 2032
- Table 154: Global Next-generation Computing Market Volume K Unit Forecast, by Component 2019 & 2032
- Table 155: Global Next-generation Computing Market Revenue Million Forecast, by Computing Type 2019 & 2032
- Table 156: Global Next-generation Computing Market Volume K Unit Forecast, by Computing Type 2019 & 2032
- Table 157: Global Next-generation Computing Market Revenue Million Forecast, by Deployement 2019 & 2032
- Table 158: Global Next-generation Computing Market Volume K Unit Forecast, by Deployement 2019 & 2032
- Table 159: Global Next-generation Computing Market Revenue Million Forecast, by End-user 2019 & 2032
- Table 160: Global Next-generation Computing Market Volume K Unit Forecast, by End-user 2019 & 2032
- Table 161: Global Next-generation Computing Market Revenue Million Forecast, by Country 2019 & 2032
- Table 162: Global Next-generation Computing Market Volume K Unit Forecast, by Country 2019 & 2032
Frequently Asked Questions
1. What is the projected Compound Annual Growth Rate (CAGR) of the Next-generation Computing Market?
The projected CAGR is approximately 19.38%.
2. Which companies are prominent players in the Next-generation Computing Market?
Key companies in the market include IBM Corporation, Alibaba Group Holding Limited, Google LLC, Microsoft Corporation, Amazon Web Services Inc, NVIDIA Corp, NEC Corporation, Oracle Corporation, Cisco Systems, Intel Corporation.
3. What are the main segments of the Next-generation Computing Market?
The market segments include Component, Computing Type, Deployement, End-user.
4. Can you provide details about the market size?
The market size is estimated to be USD 191.62 Million as of 2022.
5. What are some drivers contributing to market growth?
Growth in demand for high performance computing; Adoption of Advanced Analytics in SMEs.
6. What are the notable trends driving market growth?
The Cloud Deployment of The Solutions Significantly Contributes to The Market Growth.
7. Are there any restraints impacting market growth?
Risk of Data Breach in Storing and Processing Large Data in Next-gen Computing; High operational challenges in Implementing the Solution.
8. Can you provide examples of recent developments in the market?
July 2023: Moody's and Microsoft have partnered strategically to co-create next-generation data, analytics, research, collaboration, and risk solutions for financial services, which would be built by combining Microsoft's Azure OpenAI Service, Fabric, and Teams with Moody's proprietary data, analytics, and research and has been designed to enhance insights into corporate intelligence and risk assessment.
9. What pricing options are available for accessing the report?
Pricing options include single-user, multi-user, and enterprise licenses priced at USD 4750, USD 5250, and USD 8750 respectively.
10. Is the market size provided in terms of value or volume?
The market size is provided in terms of value, measured in Million and volume, measured in K Unit.
11. Are there any specific market keywords associated with the report?
Yes, the market keyword associated with the report is "Next-generation Computing Market," which aids in identifying and referencing the specific market segment covered.
12. How do I determine which pricing option suits my needs best?
The pricing options vary based on user requirements and access needs. Individual users may opt for single-user licenses, while businesses requiring broader access may choose multi-user or enterprise licenses for cost-effective access to the report.
13. Are there any additional resources or data provided in the Next-generation Computing Market report?
While the report offers comprehensive insights, it's advisable to review the specific contents or supplementary materials provided to ascertain if additional resources or data are available.
14. How can I stay updated on further developments or reports in the Next-generation Computing Market?
To stay informed about further developments, trends, and reports in the Next-generation Computing Market, consider subscribing to industry newsletters, following relevant companies and organizations, or regularly checking reputable industry news sources and publications.
Methodology
Step 1 - Identification of Relevant Samples Size from Population Database


Step 2 - Approaches for Defining Global Market Size (Value, Volume* & Price*)

Note*: In applicable scenarios
Step 3 - Data Sources
Primary Research
- Web Analytics
- Survey Reports
- Research Institute
- Latest Research Reports
- Opinion Leaders
Secondary Research
- Annual Reports
- White Paper
- Latest Press Release
- Industry Association
- Paid Database
- Investor Presentations

Step 4 - Data Triangulation
Involves using different sources of information in order to increase the validity of a study
These sources are likely to be stakeholders in a program - participants, other researchers, program staff, other community members, and so on.
Then we put all data in single framework & apply various statistical tools to find out the dynamic on the market.
During the analysis stage, feedback from the stakeholder groups would be compared to determine areas of agreement as well as areas of divergence
