

Key Insights
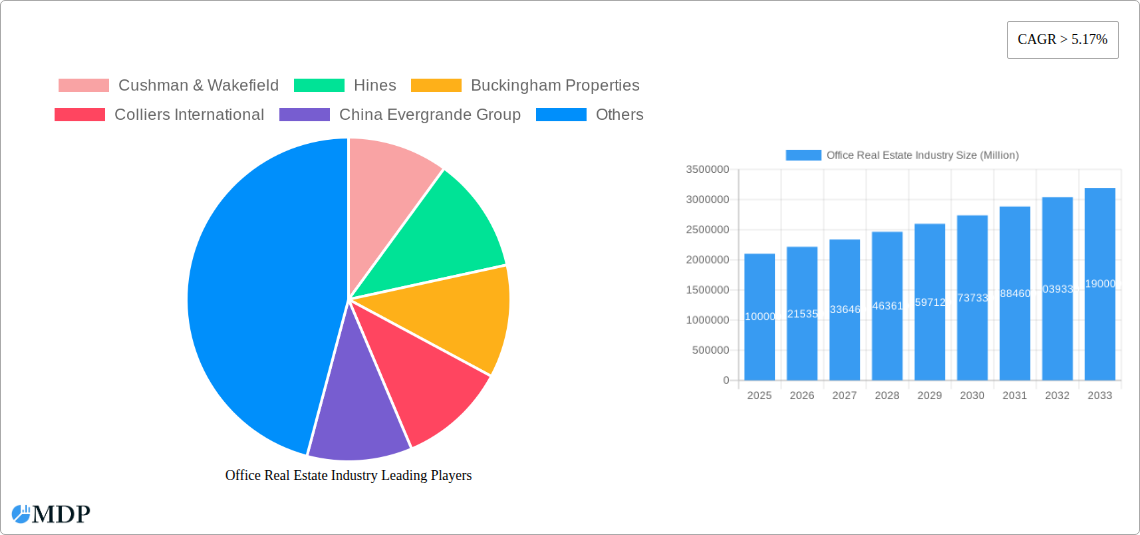
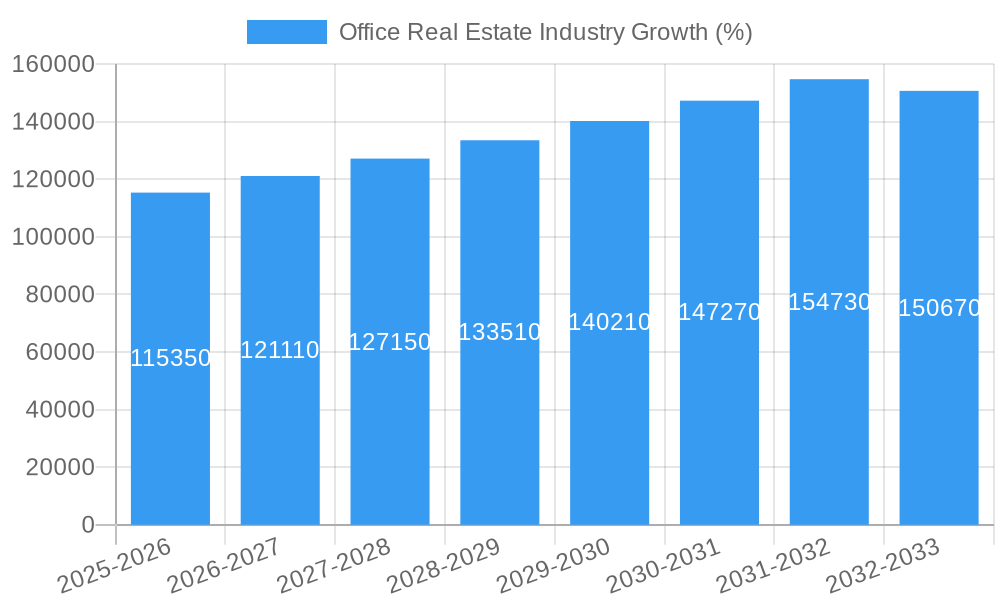
The global office real estate market, valued at $2.10 trillion in 2025, is poised for robust growth, exhibiting a compound annual growth rate (CAGR) exceeding 5.17% from 2025 to 2033. This expansion is driven by several key factors. Firstly, the ongoing urbanization and population growth in major global cities are increasing demand for office spaces, particularly in emerging economies within Asia-Pacific and South America. Secondly, the sustained growth of various sectors, including technology, finance, and professional services, fuels the need for modern and efficient office accommodations. Technological advancements, such as smart building technologies and flexible workspace solutions, are also contributing to market expansion by enhancing operational efficiency and attracting tenants. However, economic downturns and shifts towards remote work models pose challenges to the market. The increasing adoption of hybrid work arrangements may slightly moderate the growth rate compared to a purely office-based workforce. Nevertheless, the long-term outlook for the office real estate market remains positive, driven by the persistent need for collaborative workspaces and physical office presence, particularly for certain industries. The market is segmented by product type (office accommodation, equipment, and services) and application (corporate, government, and financial institutions), providing opportunities for diverse investment strategies. Key players like Cushman & Wakefield, JLL, and Hines are shaping market dynamics through strategic acquisitions, technological innovation, and the development of sustainable office spaces. Geographic diversification across North America, Europe, and the Asia-Pacific region offers significant investment potential.
The market's segmentation presents further opportunities. While corporate offices remain the largest segment, government and financial institutions' increasing investments in modern office infrastructure offer sustained growth potential. The demand for high-quality office accommodation, featuring advanced amenities and sustainable features, is notably prominent in major metropolitan areas. Furthermore, the growing focus on improving employee well-being and productivity is pushing the adoption of ergonomic office equipment and services, bolstering the market's growth. However, the real estate market will need to adapt to changing trends; effective strategies focusing on tenant experience, building sustainability, and flexible lease terms are crucial to mitigating risks and maximizing returns in this dynamic sector. The market's long-term trajectory suggests a sustained period of growth driven by fundamental demographic trends and sustained economic progress across multiple regions.
Unlocking Billions: A Comprehensive Analysis of the Office Real Estate Industry (2019-2033)
This in-depth report provides a comprehensive analysis of the global office real estate industry, projecting a market valuation exceeding $XX Billion by 2033. This crucial analysis covers market dynamics, leading players, emerging trends, and future opportunities, offering actionable insights for investors, developers, and industry stakeholders. The study period spans 2019-2033, with a base and estimated year of 2025 and a forecast period of 2025-2033. This report is essential for navigating the complexities of this dynamic sector and capitalizing on its substantial growth potential.
Office Real Estate Industry Market Dynamics & Concentration
The global office real estate market, valued at $XX Billion in 2024, exhibits a moderately concentrated landscape. Key players like Cushman & Wakefield, JLL, and Hines hold significant market share, driving innovation and shaping industry standards. However, the market is witnessing increased competition from regional and specialized firms. Regulatory frameworks, particularly zoning laws and building codes, significantly impact development and investment decisions. The emergence of flexible workspace models and co-working spaces presents a notable substitute, challenging traditional office leasing. End-user trends, including a shift towards remote work and hybrid models, are influencing demand patterns. Mergers and acquisitions (M&A) activity remains robust, with over XX deals recorded in the historical period (2019-2024), indicating ongoing consolidation and expansion strategies.
- Market Share (2024): Cushman & Wakefield (XX%), JLL (XX%), Hines (XX%), Others (XX%).
- M&A Deal Count (2019-2024): XX
- Innovation Drivers: Smart building technologies, flexible workspace solutions, sustainable design practices.
Office Real Estate Industry Industry Trends & Analysis
The office real estate market is experiencing a period of significant transformation, driven by technological advancements, evolving consumer preferences, and intense competition. The Compound Annual Growth Rate (CAGR) is projected at XX% from 2025 to 2033. Market penetration of smart building technologies is steadily increasing, reaching an estimated XX% in 2025, while the adoption of flexible work arrangements is impacting traditional office space demand. The rise of e-commerce and the gig economy are creating new demand patterns, particularly in suburban and secondary markets. Competitive dynamics are shaped by factors such as pricing strategies, service offerings, and the ability to attract and retain tenants in a rapidly evolving market landscape. Increased focus on sustainability and ESG (Environmental, Social, and Governance) factors is impacting investment decisions and development priorities.
Leading Markets & Segments in Office Real Estate Industry
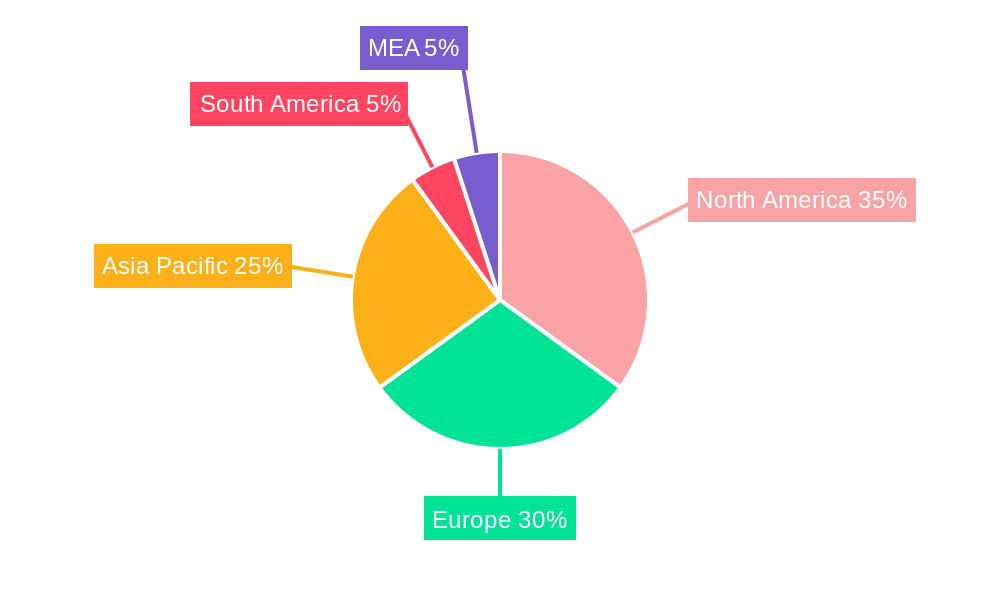
The North American office real estate market, specifically the United States, maintains its dominant position, driven by strong economic growth and robust demand from major corporations and financial institutions. Within product types, office accommodation commands the largest market share, followed by office services and office equipment. Corporate offices remain the leading application segment.
- Key Drivers in North America: Strong economic fundamentals, robust technological infrastructure, favorable regulatory environment.
- Key Drivers in Asia-Pacific: Rapid urbanization, rising disposable incomes, significant foreign investment.
- Segment Dominance: Office Accommodation (XX% of market value), followed by Office Services (XX%) and Office Equipment (XX%).
- Application Dominance: Corporate Offices (XX%), followed by Government Offices (XX%) and Financial Institutions (XX%).
Office Real Estate Industry Product Developments
Recent product innovations focus on integrating smart technologies to enhance building efficiency, occupant experience, and sustainability. Smart building systems, data analytics platforms, and flexible workspace configurations are gaining traction. These innovations aim to enhance tenant satisfaction, reduce operating costs, and improve the overall value proposition of office space. Competition is intensifying among providers of these technological solutions and service offerings.
Key Drivers of Office Real Estate Industry Growth
Several factors contribute to the continued growth of the office real estate market. Technological advancements are increasing efficiency and productivity, driving demand for modern office spaces. Strong economic performance in key regions fuels investment and expansion. Favorable government policies, including tax incentives and infrastructure development, also support market growth. For example, government initiatives focused on smart city development are stimulating demand for sophisticated office infrastructure.
Challenges in the Office Real Estate Industry Market
The office real estate sector faces several challenges, including stringent regulatory approvals that can delay projects, supply chain disruptions impacting construction costs, and increasing competition from alternative workspaces. These factors can hinder profitability and limit market expansion. For example, rising interest rates can impact financing options for development projects, leading to slower growth. The ongoing shift toward remote and hybrid work models poses a significant challenge to occupancy rates in traditional office spaces.
Emerging Opportunities in Office Real Estate Industry
Long-term growth is fueled by several emerging opportunities. The increasing adoption of sustainable building practices presents significant opportunities for environmentally conscious investors. Strategic partnerships between real estate companies and technology providers are generating innovative solutions for office spaces. Expanding into new markets, particularly in rapidly developing economies, offers substantial growth potential.
Leading Players in the Office Real Estate Industry Sector
- Cushman & Wakefield
- Hines
- Buckingham Properties
- Colliers International
- China Evergrande Group
- Delhi Land & Finance
- JLL
- Skanska
Key Milestones in Office Real Estate Industry Industry
- 2020: Increased focus on workplace safety and hygiene standards due to the COVID-19 pandemic.
- 2021: Significant rise in demand for flexible and adaptable office spaces.
- 2022: Increased adoption of smart building technologies.
- 2023: Growing emphasis on ESG (Environmental, Social, and Governance) factors in investment decisions.
- 2024: Continued M&A activity in the sector.
Strategic Outlook for Office Real Estate Industry Market
The office real estate sector is poised for continued growth, driven by technological innovation, evolving workplace strategies, and the increasing demand for sustainable and efficient office spaces. Focusing on providing flexible and adaptable solutions, incorporating smart building technologies, and prioritizing sustainability will be crucial for success in this dynamic market. Strategic partnerships and expansion into new markets will further enhance growth potential.
Office Real Estate Industry Segmentation
- 1. Production Analysis
- 2. Consumption Analysis
- 3. Import Market Analysis (Value & Volume)
- 4. Export Market Analysis (Value & Volume)
- 5. Price Trend Analysis
Office Real Estate Industry Segmentation By Geography
-
1. North America
- 1.1. United States
- 1.2. Canada
- 1.3. Mexico
-
2. Europe
- 2.1. United Kingdom
- 2.2. France
- 2.3. Germany
- 2.4. Rest of Europe
-
3. Asia Pacific
- 3.1. China
- 3.2. India
- 3.3. Japan
- 3.4. South Korea
- 3.5. Rest of Asia Pacific
- 4. Middle East
-
5. United Arab Emirates
- 5.1. Saudi Arabia
- 5.2. South Africa
- 5.3. Rest of Middle East
-
6. Latin America
- 6.1. Brazil
- 6.2. Argentina
- 6.3. Rest of Latin America
- 7. Rest of the World
Office Real Estate Industry REPORT HIGHLIGHTS
| Aspects | Details |
|---|---|
| Study Period | 2019-2033 |
| Base Year | 2024 |
| Estimated Year | 2025 |
| Forecast Period | 2025-2033 |
| Historical Period | 2019-2024 |
| Growth Rate | CAGR of > 5.17% from 2019-2033 |
| Segmentation |
|
Table of Contents
- 1. Introduction
- 1.1. Research Scope
- 1.2. Market Segmentation
- 1.3. Research Methodology
- 1.4. Definitions and Assumptions
- 2. Executive Summary
- 2.1. Introduction
- 3. Market Dynamics
- 3.1. Introduction
- 3.2. Market Drivers
- 3.2.1. Office Leasing Volume is Witnessing Significant Growth; Increasing Rental Prices of Office Spaces
- 3.3. Market Restrains
- 3.3.1. Remote Work and Hybrid Models; High vacancy rates can be a significant challenge in the office market
- 3.4. Market Trends
- 3.4.1. Rise in Demand for Coworking Spaces
- 4. Market Factor Analysis
- 4.1. Porters Five Forces
- 4.2. Supply/Value Chain
- 4.3. PESTEL analysis
- 4.4. Market Entropy
- 4.5. Patent/Trademark Analysis
- 5. Global Office Real Estate Industry Analysis, Insights and Forecast, 2019-2031
- 5.1. Market Analysis, Insights and Forecast - by Production Analysis
- 5.2. Market Analysis, Insights and Forecast - by Consumption Analysis
- 5.3. Market Analysis, Insights and Forecast - by Import Market Analysis (Value & Volume)
- 5.4. Market Analysis, Insights and Forecast - by Export Market Analysis (Value & Volume)
- 5.5. Market Analysis, Insights and Forecast - by Price Trend Analysis
- 5.6. Market Analysis, Insights and Forecast - by Region
- 5.6.1. North America
- 5.6.2. Europe
- 5.6.3. Asia Pacific
- 5.6.4. Middle East
- 5.6.5. United Arab Emirates
- 5.6.6. Latin America
- 5.6.7. Rest of the World
- 5.1. Market Analysis, Insights and Forecast - by Production Analysis
- 6. North America Office Real Estate Industry Analysis, Insights and Forecast, 2019-2031
- 6.1. Market Analysis, Insights and Forecast - by Production Analysis
- 6.2. Market Analysis, Insights and Forecast - by Consumption Analysis
- 6.3. Market Analysis, Insights and Forecast - by Import Market Analysis (Value & Volume)
- 6.4. Market Analysis, Insights and Forecast - by Export Market Analysis (Value & Volume)
- 6.5. Market Analysis, Insights and Forecast - by Price Trend Analysis
- 6.1. Market Analysis, Insights and Forecast - by Production Analysis
- 7. Europe Office Real Estate Industry Analysis, Insights and Forecast, 2019-2031
- 7.1. Market Analysis, Insights and Forecast - by Production Analysis
- 7.2. Market Analysis, Insights and Forecast - by Consumption Analysis
- 7.3. Market Analysis, Insights and Forecast - by Import Market Analysis (Value & Volume)
- 7.4. Market Analysis, Insights and Forecast - by Export Market Analysis (Value & Volume)
- 7.5. Market Analysis, Insights and Forecast - by Price Trend Analysis
- 7.1. Market Analysis, Insights and Forecast - by Production Analysis
- 8. Asia Pacific Office Real Estate Industry Analysis, Insights and Forecast, 2019-2031
- 8.1. Market Analysis, Insights and Forecast - by Production Analysis
- 8.2. Market Analysis, Insights and Forecast - by Consumption Analysis
- 8.3. Market Analysis, Insights and Forecast - by Import Market Analysis (Value & Volume)
- 8.4. Market Analysis, Insights and Forecast - by Export Market Analysis (Value & Volume)
- 8.5. Market Analysis, Insights and Forecast - by Price Trend Analysis
- 8.1. Market Analysis, Insights and Forecast - by Production Analysis
- 9. Middle East Office Real Estate Industry Analysis, Insights and Forecast, 2019-2031
- 9.1. Market Analysis, Insights and Forecast - by Production Analysis
- 9.2. Market Analysis, Insights and Forecast - by Consumption Analysis
- 9.3. Market Analysis, Insights and Forecast - by Import Market Analysis (Value & Volume)
- 9.4. Market Analysis, Insights and Forecast - by Export Market Analysis (Value & Volume)
- 9.5. Market Analysis, Insights and Forecast - by Price Trend Analysis
- 9.1. Market Analysis, Insights and Forecast - by Production Analysis
- 10. United Arab Emirates Office Real Estate Industry Analysis, Insights and Forecast, 2019-2031
- 10.1. Market Analysis, Insights and Forecast - by Production Analysis
- 10.2. Market Analysis, Insights and Forecast - by Consumption Analysis
- 10.3. Market Analysis, Insights and Forecast - by Import Market Analysis (Value & Volume)
- 10.4. Market Analysis, Insights and Forecast - by Export Market Analysis (Value & Volume)
- 10.5. Market Analysis, Insights and Forecast - by Price Trend Analysis
- 10.1. Market Analysis, Insights and Forecast - by Production Analysis
- 11. Latin America Office Real Estate Industry Analysis, Insights and Forecast, 2019-2031
- 11.1. Market Analysis, Insights and Forecast - by Production Analysis
- 11.2. Market Analysis, Insights and Forecast - by Consumption Analysis
- 11.3. Market Analysis, Insights and Forecast - by Import Market Analysis (Value & Volume)
- 11.4. Market Analysis, Insights and Forecast - by Export Market Analysis (Value & Volume)
- 11.5. Market Analysis, Insights and Forecast - by Price Trend Analysis
- 11.1. Market Analysis, Insights and Forecast - by Production Analysis
- 12. Rest of the World Office Real Estate Industry Analysis, Insights and Forecast, 2019-2031
- 12.1. Market Analysis, Insights and Forecast - by Production Analysis
- 12.2. Market Analysis, Insights and Forecast - by Consumption Analysis
- 12.3. Market Analysis, Insights and Forecast - by Import Market Analysis (Value & Volume)
- 12.4. Market Analysis, Insights and Forecast - by Export Market Analysis (Value & Volume)
- 12.5. Market Analysis, Insights and Forecast - by Price Trend Analysis
- 12.1. Market Analysis, Insights and Forecast - by Production Analysis
- 13. North America Office Real Estate Industry Analysis, Insights and Forecast, 2019-2031
- 13.1. Market Analysis, Insights and Forecast - By Country/Sub-region
- 13.1.1 United States
- 13.1.2 Canada
- 13.1.3 Mexico
- 14. Europe Office Real Estate Industry Analysis, Insights and Forecast, 2019-2031
- 14.1. Market Analysis, Insights and Forecast - By Country/Sub-region
- 14.1.1 United Kingdom
- 14.1.2 France
- 14.1.3 Germany
- 14.1.4 Rest of Europe
- 15. Asia Pacific Office Real Estate Industry Analysis, Insights and Forecast, 2019-2031
- 15.1. Market Analysis, Insights and Forecast - By Country/Sub-region
- 15.1.1 China
- 15.1.2 India
- 15.1.3 Japan
- 15.1.4 South Korea
- 15.1.5 Rest of Asia Pacific
- 16. South America Office Real Estate Industry Analysis, Insights and Forecast, 2019-2031
- 16.1. Market Analysis, Insights and Forecast - By Country/Sub-region
- 16.1.1 Brazil
- 16.1.2 Argentina
- 16.1.3 Rest of South America
- 17. MEA Office Real Estate Industry Analysis, Insights and Forecast, 2019-2031
- 17.1. Market Analysis, Insights and Forecast - By Country/Sub-region
- 17.1.1 United Arab Emirates
- 17.1.2 Saudi Arabia
- 17.1.3 South Africa
- 17.1.4 Rest of Middle East and Africa
- 18. Competitive Analysis
- 18.1. Global Market Share Analysis 2024
- 18.2. Company Profiles
- 18.2.1 Cushman & Wakefield
- 18.2.1.1. Overview
- 18.2.1.2. Products
- 18.2.1.3. SWOT Analysis
- 18.2.1.4. Recent Developments
- 18.2.1.5. Financials (Based on Availability)
- 18.2.2 Hines
- 18.2.2.1. Overview
- 18.2.2.2. Products
- 18.2.2.3. SWOT Analysis
- 18.2.2.4. Recent Developments
- 18.2.2.5. Financials (Based on Availability)
- 18.2.3 Buckingham Properties
- 18.2.3.1. Overview
- 18.2.3.2. Products
- 18.2.3.3. SWOT Analysis
- 18.2.3.4. Recent Developments
- 18.2.3.5. Financials (Based on Availability)
- 18.2.4 Colliers International
- 18.2.4.1. Overview
- 18.2.4.2. Products
- 18.2.4.3. SWOT Analysis
- 18.2.4.4. Recent Developments
- 18.2.4.5. Financials (Based on Availability)
- 18.2.5 China Evergrande Group
- 18.2.5.1. Overview
- 18.2.5.2. Products
- 18.2.5.3. SWOT Analysis
- 18.2.5.4. Recent Developments
- 18.2.5.5. Financials (Based on Availability)
- 18.2.6 Delhi Land & Finance
- 18.2.6.1. Overview
- 18.2.6.2. Products
- 18.2.6.3. SWOT Analysis
- 18.2.6.4. Recent Developments
- 18.2.6.5. Financials (Based on Availability)
- 18.2.7 JLL
- 18.2.7.1. Overview
- 18.2.7.2. Products
- 18.2.7.3. SWOT Analysis
- 18.2.7.4. Recent Developments
- 18.2.7.5. Financials (Based on Availability)
- 18.2.8 Skanska
- 18.2.8.1. Overview
- 18.2.8.2. Products
- 18.2.8.3. SWOT Analysis
- 18.2.8.4. Recent Developments
- 18.2.8.5. Financials (Based on Availability)
- 18.2.1 Cushman & Wakefield
List of Figures
- Figure 1: Global Office Real Estate Industry Revenue Breakdown (Million, %) by Region 2024 & 2032
- Figure 2: North America Office Real Estate Industry Revenue (Million), by Country 2024 & 2032
- Figure 3: North America Office Real Estate Industry Revenue Share (%), by Country 2024 & 2032
- Figure 4: Europe Office Real Estate Industry Revenue (Million), by Country 2024 & 2032
- Figure 5: Europe Office Real Estate Industry Revenue Share (%), by Country 2024 & 2032
- Figure 6: Asia Pacific Office Real Estate Industry Revenue (Million), by Country 2024 & 2032
- Figure 7: Asia Pacific Office Real Estate Industry Revenue Share (%), by Country 2024 & 2032
- Figure 8: South America Office Real Estate Industry Revenue (Million), by Country 2024 & 2032
- Figure 9: South America Office Real Estate Industry Revenue Share (%), by Country 2024 & 2032
- Figure 10: MEA Office Real Estate Industry Revenue (Million), by Country 2024 & 2032
- Figure 11: MEA Office Real Estate Industry Revenue Share (%), by Country 2024 & 2032
- Figure 12: North America Office Real Estate Industry Revenue (Million), by Production Analysis 2024 & 2032
- Figure 13: North America Office Real Estate Industry Revenue Share (%), by Production Analysis 2024 & 2032
- Figure 14: North America Office Real Estate Industry Revenue (Million), by Consumption Analysis 2024 & 2032
- Figure 15: North America Office Real Estate Industry Revenue Share (%), by Consumption Analysis 2024 & 2032
- Figure 16: North America Office Real Estate Industry Revenue (Million), by Import Market Analysis (Value & Volume) 2024 & 2032
- Figure 17: North America Office Real Estate Industry Revenue Share (%), by Import Market Analysis (Value & Volume) 2024 & 2032
- Figure 18: North America Office Real Estate Industry Revenue (Million), by Export Market Analysis (Value & Volume) 2024 & 2032
- Figure 19: North America Office Real Estate Industry Revenue Share (%), by Export Market Analysis (Value & Volume) 2024 & 2032
- Figure 20: North America Office Real Estate Industry Revenue (Million), by Price Trend Analysis 2024 & 2032
- Figure 21: North America Office Real Estate Industry Revenue Share (%), by Price Trend Analysis 2024 & 2032
- Figure 22: North America Office Real Estate Industry Revenue (Million), by Country 2024 & 2032
- Figure 23: North America Office Real Estate Industry Revenue Share (%), by Country 2024 & 2032
- Figure 24: Europe Office Real Estate Industry Revenue (Million), by Production Analysis 2024 & 2032
- Figure 25: Europe Office Real Estate Industry Revenue Share (%), by Production Analysis 2024 & 2032
- Figure 26: Europe Office Real Estate Industry Revenue (Million), by Consumption Analysis 2024 & 2032
- Figure 27: Europe Office Real Estate Industry Revenue Share (%), by Consumption Analysis 2024 & 2032
- Figure 28: Europe Office Real Estate Industry Revenue (Million), by Import Market Analysis (Value & Volume) 2024 & 2032
- Figure 29: Europe Office Real Estate Industry Revenue Share (%), by Import Market Analysis (Value & Volume) 2024 & 2032
- Figure 30: Europe Office Real Estate Industry Revenue (Million), by Export Market Analysis (Value & Volume) 2024 & 2032
- Figure 31: Europe Office Real Estate Industry Revenue Share (%), by Export Market Analysis (Value & Volume) 2024 & 2032
- Figure 32: Europe Office Real Estate Industry Revenue (Million), by Price Trend Analysis 2024 & 2032
- Figure 33: Europe Office Real Estate Industry Revenue Share (%), by Price Trend Analysis 2024 & 2032
- Figure 34: Europe Office Real Estate Industry Revenue (Million), by Country 2024 & 2032
- Figure 35: Europe Office Real Estate Industry Revenue Share (%), by Country 2024 & 2032
- Figure 36: Asia Pacific Office Real Estate Industry Revenue (Million), by Production Analysis 2024 & 2032
- Figure 37: Asia Pacific Office Real Estate Industry Revenue Share (%), by Production Analysis 2024 & 2032
- Figure 38: Asia Pacific Office Real Estate Industry Revenue (Million), by Consumption Analysis 2024 & 2032
- Figure 39: Asia Pacific Office Real Estate Industry Revenue Share (%), by Consumption Analysis 2024 & 2032
- Figure 40: Asia Pacific Office Real Estate Industry Revenue (Million), by Import Market Analysis (Value & Volume) 2024 & 2032
- Figure 41: Asia Pacific Office Real Estate Industry Revenue Share (%), by Import Market Analysis (Value & Volume) 2024 & 2032
- Figure 42: Asia Pacific Office Real Estate Industry Revenue (Million), by Export Market Analysis (Value & Volume) 2024 & 2032
- Figure 43: Asia Pacific Office Real Estate Industry Revenue Share (%), by Export Market Analysis (Value & Volume) 2024 & 2032
- Figure 44: Asia Pacific Office Real Estate Industry Revenue (Million), by Price Trend Analysis 2024 & 2032
- Figure 45: Asia Pacific Office Real Estate Industry Revenue Share (%), by Price Trend Analysis 2024 & 2032
- Figure 46: Asia Pacific Office Real Estate Industry Revenue (Million), by Country 2024 & 2032
- Figure 47: Asia Pacific Office Real Estate Industry Revenue Share (%), by Country 2024 & 2032
- Figure 48: Middle East Office Real Estate Industry Revenue (Million), by Production Analysis 2024 & 2032
- Figure 49: Middle East Office Real Estate Industry Revenue Share (%), by Production Analysis 2024 & 2032
- Figure 50: Middle East Office Real Estate Industry Revenue (Million), by Consumption Analysis 2024 & 2032
- Figure 51: Middle East Office Real Estate Industry Revenue Share (%), by Consumption Analysis 2024 & 2032
- Figure 52: Middle East Office Real Estate Industry Revenue (Million), by Import Market Analysis (Value & Volume) 2024 & 2032
- Figure 53: Middle East Office Real Estate Industry Revenue Share (%), by Import Market Analysis (Value & Volume) 2024 & 2032
- Figure 54: Middle East Office Real Estate Industry Revenue (Million), by Export Market Analysis (Value & Volume) 2024 & 2032
- Figure 55: Middle East Office Real Estate Industry Revenue Share (%), by Export Market Analysis (Value & Volume) 2024 & 2032
- Figure 56: Middle East Office Real Estate Industry Revenue (Million), by Price Trend Analysis 2024 & 2032
- Figure 57: Middle East Office Real Estate Industry Revenue Share (%), by Price Trend Analysis 2024 & 2032
- Figure 58: Middle East Office Real Estate Industry Revenue (Million), by Country 2024 & 2032
- Figure 59: Middle East Office Real Estate Industry Revenue Share (%), by Country 2024 & 2032
- Figure 60: United Arab Emirates Office Real Estate Industry Revenue (Million), by Production Analysis 2024 & 2032
- Figure 61: United Arab Emirates Office Real Estate Industry Revenue Share (%), by Production Analysis 2024 & 2032
- Figure 62: United Arab Emirates Office Real Estate Industry Revenue (Million), by Consumption Analysis 2024 & 2032
- Figure 63: United Arab Emirates Office Real Estate Industry Revenue Share (%), by Consumption Analysis 2024 & 2032
- Figure 64: United Arab Emirates Office Real Estate Industry Revenue (Million), by Import Market Analysis (Value & Volume) 2024 & 2032
- Figure 65: United Arab Emirates Office Real Estate Industry Revenue Share (%), by Import Market Analysis (Value & Volume) 2024 & 2032
- Figure 66: United Arab Emirates Office Real Estate Industry Revenue (Million), by Export Market Analysis (Value & Volume) 2024 & 2032
- Figure 67: United Arab Emirates Office Real Estate Industry Revenue Share (%), by Export Market Analysis (Value & Volume) 2024 & 2032
- Figure 68: United Arab Emirates Office Real Estate Industry Revenue (Million), by Price Trend Analysis 2024 & 2032
- Figure 69: United Arab Emirates Office Real Estate Industry Revenue Share (%), by Price Trend Analysis 2024 & 2032
- Figure 70: United Arab Emirates Office Real Estate Industry Revenue (Million), by Country 2024 & 2032
- Figure 71: United Arab Emirates Office Real Estate Industry Revenue Share (%), by Country 2024 & 2032
- Figure 72: Latin America Office Real Estate Industry Revenue (Million), by Production Analysis 2024 & 2032
- Figure 73: Latin America Office Real Estate Industry Revenue Share (%), by Production Analysis 2024 & 2032
- Figure 74: Latin America Office Real Estate Industry Revenue (Million), by Consumption Analysis 2024 & 2032
- Figure 75: Latin America Office Real Estate Industry Revenue Share (%), by Consumption Analysis 2024 & 2032
- Figure 76: Latin America Office Real Estate Industry Revenue (Million), by Import Market Analysis (Value & Volume) 2024 & 2032
- Figure 77: Latin America Office Real Estate Industry Revenue Share (%), by Import Market Analysis (Value & Volume) 2024 & 2032
- Figure 78: Latin America Office Real Estate Industry Revenue (Million), by Export Market Analysis (Value & Volume) 2024 & 2032
- Figure 79: Latin America Office Real Estate Industry Revenue Share (%), by Export Market Analysis (Value & Volume) 2024 & 2032
- Figure 80: Latin America Office Real Estate Industry Revenue (Million), by Price Trend Analysis 2024 & 2032
- Figure 81: Latin America Office Real Estate Industry Revenue Share (%), by Price Trend Analysis 2024 & 2032
- Figure 82: Latin America Office Real Estate Industry Revenue (Million), by Country 2024 & 2032
- Figure 83: Latin America Office Real Estate Industry Revenue Share (%), by Country 2024 & 2032
- Figure 84: Rest of the World Office Real Estate Industry Revenue (Million), by Production Analysis 2024 & 2032
- Figure 85: Rest of the World Office Real Estate Industry Revenue Share (%), by Production Analysis 2024 & 2032
- Figure 86: Rest of the World Office Real Estate Industry Revenue (Million), by Consumption Analysis 2024 & 2032
- Figure 87: Rest of the World Office Real Estate Industry Revenue Share (%), by Consumption Analysis 2024 & 2032
- Figure 88: Rest of the World Office Real Estate Industry Revenue (Million), by Import Market Analysis (Value & Volume) 2024 & 2032
- Figure 89: Rest of the World Office Real Estate Industry Revenue Share (%), by Import Market Analysis (Value & Volume) 2024 & 2032
- Figure 90: Rest of the World Office Real Estate Industry Revenue (Million), by Export Market Analysis (Value & Volume) 2024 & 2032
- Figure 91: Rest of the World Office Real Estate Industry Revenue Share (%), by Export Market Analysis (Value & Volume) 2024 & 2032
- Figure 92: Rest of the World Office Real Estate Industry Revenue (Million), by Price Trend Analysis 2024 & 2032
- Figure 93: Rest of the World Office Real Estate Industry Revenue Share (%), by Price Trend Analysis 2024 & 2032
- Figure 94: Rest of the World Office Real Estate Industry Revenue (Million), by Country 2024 & 2032
- Figure 95: Rest of the World Office Real Estate Industry Revenue Share (%), by Country 2024 & 2032
List of Tables
- Table 1: Global Office Real Estate Industry Revenue Million Forecast, by Region 2019 & 2032
- Table 2: Global Office Real Estate Industry Revenue Million Forecast, by Production Analysis 2019 & 2032
- Table 3: Global Office Real Estate Industry Revenue Million Forecast, by Consumption Analysis 2019 & 2032
- Table 4: Global Office Real Estate Industry Revenue Million Forecast, by Import Market Analysis (Value & Volume) 2019 & 2032
- Table 5: Global Office Real Estate Industry Revenue Million Forecast, by Export Market Analysis (Value & Volume) 2019 & 2032
- Table 6: Global Office Real Estate Industry Revenue Million Forecast, by Price Trend Analysis 2019 & 2032
- Table 7: Global Office Real Estate Industry Revenue Million Forecast, by Region 2019 & 2032
- Table 8: Global Office Real Estate Industry Revenue Million Forecast, by Country 2019 & 2032
- Table 9: United States Office Real Estate Industry Revenue (Million) Forecast, by Application 2019 & 2032
- Table 10: Canada Office Real Estate Industry Revenue (Million) Forecast, by Application 2019 & 2032
- Table 11: Mexico Office Real Estate Industry Revenue (Million) Forecast, by Application 2019 & 2032
- Table 12: Global Office Real Estate Industry Revenue Million Forecast, by Country 2019 & 2032
- Table 13: United Kingdom Office Real Estate Industry Revenue (Million) Forecast, by Application 2019 & 2032
- Table 14: France Office Real Estate Industry Revenue (Million) Forecast, by Application 2019 & 2032
- Table 15: Germany Office Real Estate Industry Revenue (Million) Forecast, by Application 2019 & 2032
- Table 16: Rest of Europe Office Real Estate Industry Revenue (Million) Forecast, by Application 2019 & 2032
- Table 17: Global Office Real Estate Industry Revenue Million Forecast, by Country 2019 & 2032
- Table 18: China Office Real Estate Industry Revenue (Million) Forecast, by Application 2019 & 2032
- Table 19: India Office Real Estate Industry Revenue (Million) Forecast, by Application 2019 & 2032
- Table 20: Japan Office Real Estate Industry Revenue (Million) Forecast, by Application 2019 & 2032
- Table 21: South Korea Office Real Estate Industry Revenue (Million) Forecast, by Application 2019 & 2032
- Table 22: Rest of Asia Pacific Office Real Estate Industry Revenue (Million) Forecast, by Application 2019 & 2032
- Table 23: Global Office Real Estate Industry Revenue Million Forecast, by Country 2019 & 2032
- Table 24: Brazil Office Real Estate Industry Revenue (Million) Forecast, by Application 2019 & 2032
- Table 25: Argentina Office Real Estate Industry Revenue (Million) Forecast, by Application 2019 & 2032
- Table 26: Rest of South America Office Real Estate Industry Revenue (Million) Forecast, by Application 2019 & 2032
- Table 27: Global Office Real Estate Industry Revenue Million Forecast, by Country 2019 & 2032
- Table 28: United Arab Emirates Office Real Estate Industry Revenue (Million) Forecast, by Application 2019 & 2032
- Table 29: Saudi Arabia Office Real Estate Industry Revenue (Million) Forecast, by Application 2019 & 2032
- Table 30: South Africa Office Real Estate Industry Revenue (Million) Forecast, by Application 2019 & 2032
- Table 31: Rest of Middle East and Africa Office Real Estate Industry Revenue (Million) Forecast, by Application 2019 & 2032
- Table 32: Global Office Real Estate Industry Revenue Million Forecast, by Production Analysis 2019 & 2032
- Table 33: Global Office Real Estate Industry Revenue Million Forecast, by Consumption Analysis 2019 & 2032
- Table 34: Global Office Real Estate Industry Revenue Million Forecast, by Import Market Analysis (Value & Volume) 2019 & 2032
- Table 35: Global Office Real Estate Industry Revenue Million Forecast, by Export Market Analysis (Value & Volume) 2019 & 2032
- Table 36: Global Office Real Estate Industry Revenue Million Forecast, by Price Trend Analysis 2019 & 2032
- Table 37: Global Office Real Estate Industry Revenue Million Forecast, by Country 2019 & 2032
- Table 38: United States Office Real Estate Industry Revenue (Million) Forecast, by Application 2019 & 2032
- Table 39: Canada Office Real Estate Industry Revenue (Million) Forecast, by Application 2019 & 2032
- Table 40: Mexico Office Real Estate Industry Revenue (Million) Forecast, by Application 2019 & 2032
- Table 41: Global Office Real Estate Industry Revenue Million Forecast, by Production Analysis 2019 & 2032
- Table 42: Global Office Real Estate Industry Revenue Million Forecast, by Consumption Analysis 2019 & 2032
- Table 43: Global Office Real Estate Industry Revenue Million Forecast, by Import Market Analysis (Value & Volume) 2019 & 2032
- Table 44: Global Office Real Estate Industry Revenue Million Forecast, by Export Market Analysis (Value & Volume) 2019 & 2032
- Table 45: Global Office Real Estate Industry Revenue Million Forecast, by Price Trend Analysis 2019 & 2032
- Table 46: Global Office Real Estate Industry Revenue Million Forecast, by Country 2019 & 2032
- Table 47: United Kingdom Office Real Estate Industry Revenue (Million) Forecast, by Application 2019 & 2032
- Table 48: France Office Real Estate Industry Revenue (Million) Forecast, by Application 2019 & 2032
- Table 49: Germany Office Real Estate Industry Revenue (Million) Forecast, by Application 2019 & 2032
- Table 50: Rest of Europe Office Real Estate Industry Revenue (Million) Forecast, by Application 2019 & 2032
- Table 51: Global Office Real Estate Industry Revenue Million Forecast, by Production Analysis 2019 & 2032
- Table 52: Global Office Real Estate Industry Revenue Million Forecast, by Consumption Analysis 2019 & 2032
- Table 53: Global Office Real Estate Industry Revenue Million Forecast, by Import Market Analysis (Value & Volume) 2019 & 2032
- Table 54: Global Office Real Estate Industry Revenue Million Forecast, by Export Market Analysis (Value & Volume) 2019 & 2032
- Table 55: Global Office Real Estate Industry Revenue Million Forecast, by Price Trend Analysis 2019 & 2032
- Table 56: Global Office Real Estate Industry Revenue Million Forecast, by Country 2019 & 2032
- Table 57: China Office Real Estate Industry Revenue (Million) Forecast, by Application 2019 & 2032
- Table 58: India Office Real Estate Industry Revenue (Million) Forecast, by Application 2019 & 2032
- Table 59: Japan Office Real Estate Industry Revenue (Million) Forecast, by Application 2019 & 2032
- Table 60: South Korea Office Real Estate Industry Revenue (Million) Forecast, by Application 2019 & 2032
- Table 61: Rest of Asia Pacific Office Real Estate Industry Revenue (Million) Forecast, by Application 2019 & 2032
- Table 62: Global Office Real Estate Industry Revenue Million Forecast, by Production Analysis 2019 & 2032
- Table 63: Global Office Real Estate Industry Revenue Million Forecast, by Consumption Analysis 2019 & 2032
- Table 64: Global Office Real Estate Industry Revenue Million Forecast, by Import Market Analysis (Value & Volume) 2019 & 2032
- Table 65: Global Office Real Estate Industry Revenue Million Forecast, by Export Market Analysis (Value & Volume) 2019 & 2032
- Table 66: Global Office Real Estate Industry Revenue Million Forecast, by Price Trend Analysis 2019 & 2032
- Table 67: Global Office Real Estate Industry Revenue Million Forecast, by Country 2019 & 2032
- Table 68: Global Office Real Estate Industry Revenue Million Forecast, by Production Analysis 2019 & 2032
- Table 69: Global Office Real Estate Industry Revenue Million Forecast, by Consumption Analysis 2019 & 2032
- Table 70: Global Office Real Estate Industry Revenue Million Forecast, by Import Market Analysis (Value & Volume) 2019 & 2032
- Table 71: Global Office Real Estate Industry Revenue Million Forecast, by Export Market Analysis (Value & Volume) 2019 & 2032
- Table 72: Global Office Real Estate Industry Revenue Million Forecast, by Price Trend Analysis 2019 & 2032
- Table 73: Global Office Real Estate Industry Revenue Million Forecast, by Country 2019 & 2032
- Table 74: Saudi Arabia Office Real Estate Industry Revenue (Million) Forecast, by Application 2019 & 2032
- Table 75: South Africa Office Real Estate Industry Revenue (Million) Forecast, by Application 2019 & 2032
- Table 76: Rest of Middle East Office Real Estate Industry Revenue (Million) Forecast, by Application 2019 & 2032
- Table 77: Global Office Real Estate Industry Revenue Million Forecast, by Production Analysis 2019 & 2032
- Table 78: Global Office Real Estate Industry Revenue Million Forecast, by Consumption Analysis 2019 & 2032
- Table 79: Global Office Real Estate Industry Revenue Million Forecast, by Import Market Analysis (Value & Volume) 2019 & 2032
- Table 80: Global Office Real Estate Industry Revenue Million Forecast, by Export Market Analysis (Value & Volume) 2019 & 2032
- Table 81: Global Office Real Estate Industry Revenue Million Forecast, by Price Trend Analysis 2019 & 2032
- Table 82: Global Office Real Estate Industry Revenue Million Forecast, by Country 2019 & 2032
- Table 83: Brazil Office Real Estate Industry Revenue (Million) Forecast, by Application 2019 & 2032
- Table 84: Argentina Office Real Estate Industry Revenue (Million) Forecast, by Application 2019 & 2032
- Table 85: Rest of Latin America Office Real Estate Industry Revenue (Million) Forecast, by Application 2019 & 2032
- Table 86: Global Office Real Estate Industry Revenue Million Forecast, by Production Analysis 2019 & 2032
- Table 87: Global Office Real Estate Industry Revenue Million Forecast, by Consumption Analysis 2019 & 2032
- Table 88: Global Office Real Estate Industry Revenue Million Forecast, by Import Market Analysis (Value & Volume) 2019 & 2032
- Table 89: Global Office Real Estate Industry Revenue Million Forecast, by Export Market Analysis (Value & Volume) 2019 & 2032
- Table 90: Global Office Real Estate Industry Revenue Million Forecast, by Price Trend Analysis 2019 & 2032
- Table 91: Global Office Real Estate Industry Revenue Million Forecast, by Country 2019 & 2032
Frequently Asked Questions
1. What is the projected Compound Annual Growth Rate (CAGR) of the Office Real Estate Industry?
The projected CAGR is approximately > 5.17%.
2. Which companies are prominent players in the Office Real Estate Industry?
Key companies in the market include Cushman & Wakefield, Hines, Buckingham Properties, Colliers International, China Evergrande Group, Delhi Land & Finance, JLL, Skanska.
3. What are the main segments of the Office Real Estate Industry?
The market segments include Production Analysis, Consumption Analysis, Import Market Analysis (Value & Volume), Export Market Analysis (Value & Volume), Price Trend Analysis.
4. Can you provide details about the market size?
The market size is estimated to be USD 2.10 Million as of 2022.
5. What are some drivers contributing to market growth?
Office Leasing Volume is Witnessing Significant Growth; Increasing Rental Prices of Office Spaces.
6. What are the notable trends driving market growth?
Rise in Demand for Coworking Spaces.
7. Are there any restraints impacting market growth?
Remote Work and Hybrid Models; High vacancy rates can be a significant challenge in the office market.
8. Can you provide examples of recent developments in the market?
N/A
9. What pricing options are available for accessing the report?
Pricing options include single-user, multi-user, and enterprise licenses priced at USD 4750, USD 5250, and USD 8750 respectively.
10. Is the market size provided in terms of value or volume?
The market size is provided in terms of value, measured in Million.
11. Are there any specific market keywords associated with the report?
Yes, the market keyword associated with the report is "Office Real Estate Industry," which aids in identifying and referencing the specific market segment covered.
12. How do I determine which pricing option suits my needs best?
The pricing options vary based on user requirements and access needs. Individual users may opt for single-user licenses, while businesses requiring broader access may choose multi-user or enterprise licenses for cost-effective access to the report.
13. Are there any additional resources or data provided in the Office Real Estate Industry report?
While the report offers comprehensive insights, it's advisable to review the specific contents or supplementary materials provided to ascertain if additional resources or data are available.
14. How can I stay updated on further developments or reports in the Office Real Estate Industry?
To stay informed about further developments, trends, and reports in the Office Real Estate Industry, consider subscribing to industry newsletters, following relevant companies and organizations, or regularly checking reputable industry news sources and publications.
Methodology
Step 1 - Identification of Relevant Samples Size from Population Database


Step 2 - Approaches for Defining Global Market Size (Value, Volume* & Price*)

Note*: In applicable scenarios
Step 3 - Data Sources
Primary Research
- Web Analytics
- Survey Reports
- Research Institute
- Latest Research Reports
- Opinion Leaders
Secondary Research
- Annual Reports
- White Paper
- Latest Press Release
- Industry Association
- Paid Database
- Investor Presentations

Step 4 - Data Triangulation
Involves using different sources of information in order to increase the validity of a study
These sources are likely to be stakeholders in a program - participants, other researchers, program staff, other community members, and so on.
Then we put all data in single framework & apply various statistical tools to find out the dynamic on the market.
During the analysis stage, feedback from the stakeholder groups would be compared to determine areas of agreement as well as areas of divergence
