

Key Insights
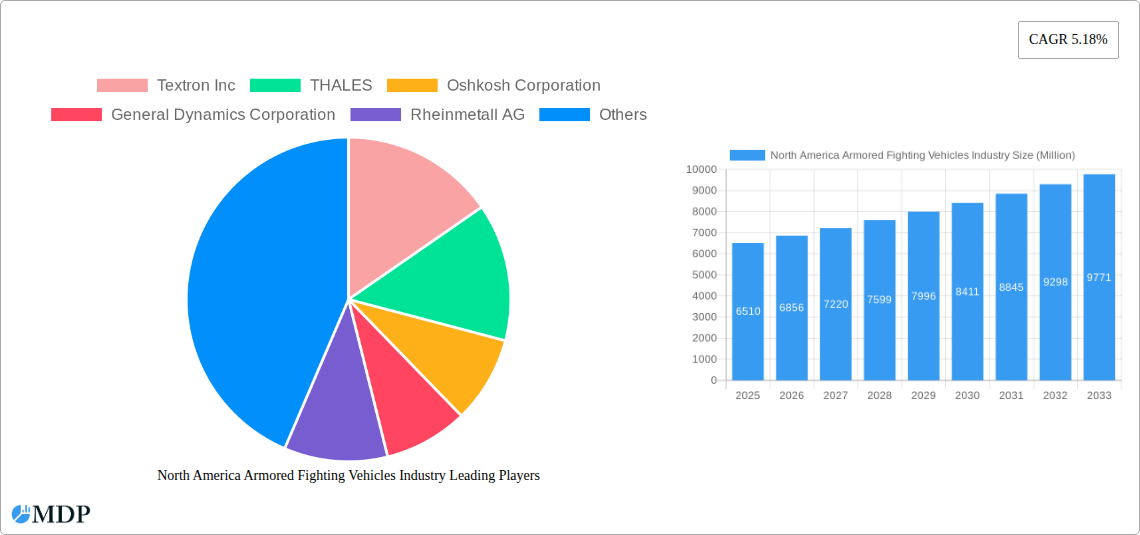
The North American armored fighting vehicles (AFV) market, valued at $6.51 billion in 2025, is projected to experience robust growth, driven by increasing defense budgets, modernization initiatives, and geopolitical instability. The market's Compound Annual Growth Rate (CAGR) of 5.18% from 2025 to 2033 indicates a significant expansion over the forecast period. Key market segments include Armored Personnel Carriers (APCs), Infantry Fighting Vehicles (IFVs), and Main Battle Tanks (MBTs), with APCs likely holding the largest market share due to their versatility and widespread adoption. The United States, as the largest economy and military spender in North America, is expected to dominate the regional market, followed by Canada and Mexico. Growth is fueled by a need to replace aging fleets, technological advancements in areas like active protection systems and improved mobility, and a focus on enhancing situational awareness through advanced sensors and communication systems. However, economic downturns and potential shifts in defense priorities could act as market restraints. Leading companies like Textron, Thales, Oshkosh, General Dynamics, and BAE Systems are vying for market share through innovation and strategic partnerships. The increasing adoption of unmanned and autonomous systems will likely be a key factor shaping market trends in the coming years.
The competitive landscape is characterized by a mix of established defense contractors and emerging technology providers. Strategic alliances and mergers & acquisitions are expected to play a significant role in shaping the market structure. Government regulations and stringent quality standards also influence the industry. Specific vehicle types within the market are likely to see varying growth rates, reflecting their individual applications and evolving military strategies. The forecast period's growth will depend on geopolitical events, technological innovations, and the overall economic climate.
North America Armored Fighting Vehicles Industry Market Report: 2019-2033
Dive deep into the dynamic North American Armored Fighting Vehicles (AFV) market with this comprehensive report, offering invaluable insights for strategic decision-making. This in-depth analysis covers the period from 2019 to 2033, providing historical data (2019-2024), a base year (2025), and a robust forecast (2025-2033). Uncover key trends, competitive landscapes, and growth opportunities within the APC, IFV, MBT, and other vehicle segments. This report is essential for industry stakeholders, investors, and anyone seeking a comprehensive understanding of this crucial sector.
North America Armored Fighting Vehicles Industry Market Dynamics & Concentration
The North American armored fighting vehicles market exhibits moderate concentration, with several major players holding significant market share. Textron Inc., Thales, Oshkosh Corporation, General Dynamics Corporation, and BAE Systems plc are key players, often competing for large government contracts. Market share fluctuates based on contract wins and technological advancements. Innovation is driven by the need for enhanced protection, mobility, and firepower, leading to continuous improvements in vehicle design and integration of advanced technologies like AI and autonomous systems. Stringent regulatory frameworks, including export controls and safety standards, impact market dynamics. Product substitutes are limited, with the primary alternative being older, less technologically advanced vehicles. End-user trends show a growing preference for lighter, more agile vehicles suitable for asymmetric warfare scenarios. M&A activity has been moderate in recent years, with a focus on strengthening technological capabilities and expanding market reach. An estimated xx M&A deals occurred between 2019-2024, resulting in a xx% market share shift among the top 5 players.
- Market Concentration: Moderate, with a few dominant players.
- Innovation Drivers: Enhanced protection, mobility, firepower, AI integration, autonomous systems.
- Regulatory Frameworks: Stringent export controls and safety standards.
- Product Substitutes: Limited, primarily older vehicle models.
- End-User Trends: Preference for lighter, more agile vehicles.
- M&A Activity: Moderate, focused on technological capabilities and market expansion.
North America Armored Fighting Vehicles Industry Industry Trends & Analysis
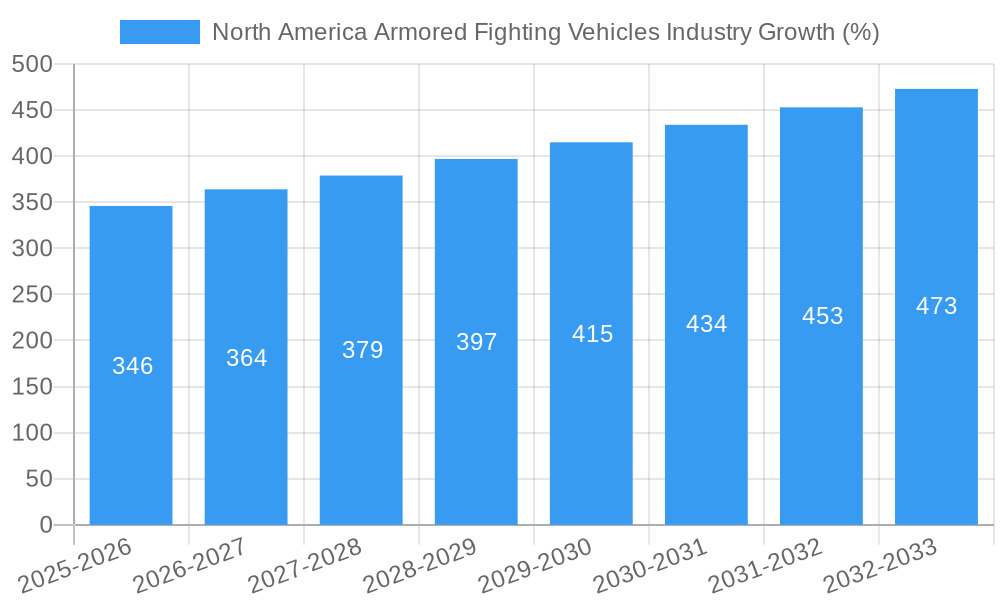
The North American AFV market demonstrates consistent growth driven by increasing defense budgets, geopolitical instability, and modernization efforts across various armed forces. The market is experiencing a CAGR of xx% during the forecast period (2025-2033). Technological disruptions, such as the integration of advanced sensors, communication systems, and improved armor technologies, are reshaping the competitive landscape. Consumer preferences lean toward vehicles offering superior survivability, enhanced situational awareness, and improved lethality. Competitive dynamics are characterized by fierce competition among established players and the emergence of specialized niche providers. Market penetration of advanced technologies is steadily increasing, with xx% of newly produced vehicles incorporating AI-assisted targeting systems by 2033.
Leading Markets & Segments in North America Armored Fighting Vehicles Industry
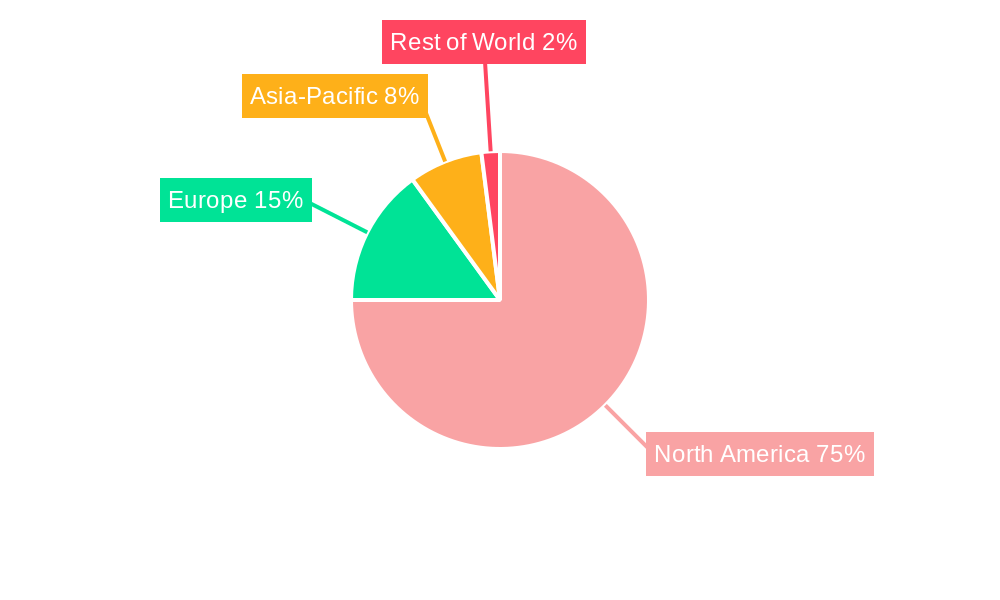
The United States dominates the North American AFV market, driven by substantial defense spending and ongoing modernization programs. Canada also represents a significant market due to its investment in military equipment upgrades. Within vehicle types, Armored Personnel Carriers (APCs) and Infantry Fighting Vehicles (IFVs) constitute the largest segments, owing to their versatility and wide-ranging applications.
- Key Drivers of US Market Dominance: High defense spending, continuous modernization programs, large military inventory.
- Key Drivers of Canadian Market: Military modernization efforts and equipment replacements.
- Dominant Segments: APCs and IFVs due to their versatility.
- MBT Market: Relatively smaller compared to APCs and IFVs, with sales driven by specific military procurement needs.
The market share for APCs is projected to be xx% while IFVs will constitute xx% by 2033. MBTs and other vehicle types hold smaller but still significant segments.
North America Armored Fighting Vehicles Industry Product Developments
Recent product innovations focus on lightweight materials, improved armor protection, enhanced situational awareness systems, and integration of advanced weaponry. These advancements enhance vehicle survivability, mobility, and firepower, addressing evolving battlefield requirements. The market is seeing increased adoption of hybrid and electric propulsion systems, aiming to improve fuel efficiency and reduce environmental impact. These technological trends directly correlate with a growing market demand for more efficient and sustainable AFVs.
Key Drivers of North America Armored Fighting Vehicles Industry Growth
Several factors drive the North American AFV market's growth. Increased defense spending by the US and Canada fuels procurement programs for advanced equipment. Geopolitical instability and regional conflicts create a demand for advanced military hardware. Technological advancements, such as improved armor, integrated systems, and autonomous capabilities, significantly enhance vehicle performance, driving market growth. Stringent regulatory environments and ongoing efforts to modernize existing fleets contribute further to market expansion.
Challenges in the North America Armored Fighting Vehicles Industry Market
The North American AFV market faces challenges, including stringent regulatory compliance, which increases development and production costs. Supply chain disruptions can impact production timelines and costs. Intense competition among established and emerging players creates price pressures, affecting profitability. The high cost of research and development, coupled with long lead times for contract awards, also poses significant hurdles to market entry. These factors, when aggregated, impact market growth with estimated annual losses of xx Million.
Emerging Opportunities in North America Armored Fighting Vehicles Industry
Technological breakthroughs, like the development of advanced sensor systems, AI-powered decision support tools, and unmanned ground vehicles, present significant opportunities. Strategic partnerships between defense contractors and technology firms can facilitate rapid innovation and deployment. Market expansion into niche segments, such as specialized armored vehicles for law enforcement or emergency response, provides further growth potential.
Leading Players in the North America Armored Fighting Vehicles Industry Sector
- Textron Inc.
- THALES
- Oshkosh Corporation
- General Dynamics Corporation
- Rheinmetall AG
- Elbit Systems Ltd
- QinetiQ Group
- AM General LLC
- Leonardo S p A
- BAE Systems plc
- HDT Global
Key Milestones in North America Armored Fighting Vehicles Industry Industry
- November 2022: BAE Systems plc awarded a USD 32 million contract by the US DoD for M2A4 and M7A4 Bradley fighting vehicles.
- November 2022: General Dynamics Corporation secured a USD 165 million contract with the Canadian military for 39 additional light-armored vehicles.
Strategic Outlook for North America Armored Fighting Vehicles Industry Market
The North American AFV market is poised for continued growth, driven by sustained defense spending, technological advancements, and geopolitical uncertainties. Strategic opportunities exist in developing and deploying advanced technologies, forging strategic partnerships, and expanding into new market segments. Focus on innovation, particularly in areas like autonomous systems and hybrid propulsion, will be crucial for maintaining competitiveness and capturing market share in the coming years. The market is projected to reach xx Million by 2033, presenting lucrative opportunities for established and emerging players alike.
North America Armored Fighting Vehicles Industry Segmentation
-
1. Vehicle Type
- 1.1. Armored Personnel Carrier (APC)
- 1.2. Infantry Fighting Vehicle (IFV)
- 1.3. Main Battle Tank (MBT)
- 1.4. Other Vehicle Types
-
2. Geography
- 2.1. United States
- 2.2. Canada
North America Armored Fighting Vehicles Industry Segmentation By Geography
- 1. United States
- 2. Canada
North America Armored Fighting Vehicles Industry REPORT HIGHLIGHTS
| Aspects | Details |
|---|---|
| Study Period | 2019-2033 |
| Base Year | 2024 |
| Estimated Year | 2025 |
| Forecast Period | 2025-2033 |
| Historical Period | 2019-2024 |
| Growth Rate | CAGR of 5.18% from 2019-2033 |
| Segmentation |
|
Table of Contents
- 1. Introduction
- 1.1. Research Scope
- 1.2. Market Segmentation
- 1.3. Research Methodology
- 1.4. Definitions and Assumptions
- 2. Executive Summary
- 2.1. Introduction
- 3. Market Dynamics
- 3.1. Introduction
- 3.2. Market Drivers
- 3.3. Market Restrains
- 3.4. Market Trends
- 3.4.1. Main Battle Tanks Segment to Dominate the Market
- 4. Market Factor Analysis
- 4.1. Porters Five Forces
- 4.2. Supply/Value Chain
- 4.3. PESTEL analysis
- 4.4. Market Entropy
- 4.5. Patent/Trademark Analysis
- 5. North America Armored Fighting Vehicles Industry Analysis, Insights and Forecast, 2019-2031
- 5.1. Market Analysis, Insights and Forecast - by Vehicle Type
- 5.1.1. Armored Personnel Carrier (APC)
- 5.1.2. Infantry Fighting Vehicle (IFV)
- 5.1.3. Main Battle Tank (MBT)
- 5.1.4. Other Vehicle Types
- 5.2. Market Analysis, Insights and Forecast - by Geography
- 5.2.1. United States
- 5.2.2. Canada
- 5.3. Market Analysis, Insights and Forecast - by Region
- 5.3.1. United States
- 5.3.2. Canada
- 5.1. Market Analysis, Insights and Forecast - by Vehicle Type
- 6. United States North America Armored Fighting Vehicles Industry Analysis, Insights and Forecast, 2019-2031
- 6.1. Market Analysis, Insights and Forecast - by Vehicle Type
- 6.1.1. Armored Personnel Carrier (APC)
- 6.1.2. Infantry Fighting Vehicle (IFV)
- 6.1.3. Main Battle Tank (MBT)
- 6.1.4. Other Vehicle Types
- 6.2. Market Analysis, Insights and Forecast - by Geography
- 6.2.1. United States
- 6.2.2. Canada
- 6.1. Market Analysis, Insights and Forecast - by Vehicle Type
- 7. Canada North America Armored Fighting Vehicles Industry Analysis, Insights and Forecast, 2019-2031
- 7.1. Market Analysis, Insights and Forecast - by Vehicle Type
- 7.1.1. Armored Personnel Carrier (APC)
- 7.1.2. Infantry Fighting Vehicle (IFV)
- 7.1.3. Main Battle Tank (MBT)
- 7.1.4. Other Vehicle Types
- 7.2. Market Analysis, Insights and Forecast - by Geography
- 7.2.1. United States
- 7.2.2. Canada
- 7.1. Market Analysis, Insights and Forecast - by Vehicle Type
- 8. United States North America Armored Fighting Vehicles Industry Analysis, Insights and Forecast, 2019-2031
- 9. Canada North America Armored Fighting Vehicles Industry Analysis, Insights and Forecast, 2019-2031
- 10. Mexico North America Armored Fighting Vehicles Industry Analysis, Insights and Forecast, 2019-2031
- 11. Rest of North America North America Armored Fighting Vehicles Industry Analysis, Insights and Forecast, 2019-2031
- 12. Competitive Analysis
- 12.1. Market Share Analysis 2024
- 12.2. Company Profiles
- 12.2.1 Textron Inc
- 12.2.1.1. Overview
- 12.2.1.2. Products
- 12.2.1.3. SWOT Analysis
- 12.2.1.4. Recent Developments
- 12.2.1.5. Financials (Based on Availability)
- 12.2.2 THALES
- 12.2.2.1. Overview
- 12.2.2.2. Products
- 12.2.2.3. SWOT Analysis
- 12.2.2.4. Recent Developments
- 12.2.2.5. Financials (Based on Availability)
- 12.2.3 Oshkosh Corporation
- 12.2.3.1. Overview
- 12.2.3.2. Products
- 12.2.3.3. SWOT Analysis
- 12.2.3.4. Recent Developments
- 12.2.3.5. Financials (Based on Availability)
- 12.2.4 General Dynamics Corporation
- 12.2.4.1. Overview
- 12.2.4.2. Products
- 12.2.4.3. SWOT Analysis
- 12.2.4.4. Recent Developments
- 12.2.4.5. Financials (Based on Availability)
- 12.2.5 Rheinmetall AG
- 12.2.5.1. Overview
- 12.2.5.2. Products
- 12.2.5.3. SWOT Analysis
- 12.2.5.4. Recent Developments
- 12.2.5.5. Financials (Based on Availability)
- 12.2.6 Elbit Systems Ltd
- 12.2.6.1. Overview
- 12.2.6.2. Products
- 12.2.6.3. SWOT Analysis
- 12.2.6.4. Recent Developments
- 12.2.6.5. Financials (Based on Availability)
- 12.2.7 QinetiQ Group
- 12.2.7.1. Overview
- 12.2.7.2. Products
- 12.2.7.3. SWOT Analysis
- 12.2.7.4. Recent Developments
- 12.2.7.5. Financials (Based on Availability)
- 12.2.8 AM General LLC
- 12.2.8.1. Overview
- 12.2.8.2. Products
- 12.2.8.3. SWOT Analysis
- 12.2.8.4. Recent Developments
- 12.2.8.5. Financials (Based on Availability)
- 12.2.9 Leonardo S p A
- 12.2.9.1. Overview
- 12.2.9.2. Products
- 12.2.9.3. SWOT Analysis
- 12.2.9.4. Recent Developments
- 12.2.9.5. Financials (Based on Availability)
- 12.2.10 BAE Systems plc
- 12.2.10.1. Overview
- 12.2.10.2. Products
- 12.2.10.3. SWOT Analysis
- 12.2.10.4. Recent Developments
- 12.2.10.5. Financials (Based on Availability)
- 12.2.11 HDT Global
- 12.2.11.1. Overview
- 12.2.11.2. Products
- 12.2.11.3. SWOT Analysis
- 12.2.11.4. Recent Developments
- 12.2.11.5. Financials (Based on Availability)
- 12.2.1 Textron Inc
List of Figures
- Figure 1: North America Armored Fighting Vehicles Industry Revenue Breakdown (Million, %) by Product 2024 & 2032
- Figure 2: North America Armored Fighting Vehicles Industry Share (%) by Company 2024
List of Tables
- Table 1: North America Armored Fighting Vehicles Industry Revenue Million Forecast, by Region 2019 & 2032
- Table 2: North America Armored Fighting Vehicles Industry Revenue Million Forecast, by Vehicle Type 2019 & 2032
- Table 3: North America Armored Fighting Vehicles Industry Revenue Million Forecast, by Geography 2019 & 2032
- Table 4: North America Armored Fighting Vehicles Industry Revenue Million Forecast, by Region 2019 & 2032
- Table 5: North America Armored Fighting Vehicles Industry Revenue Million Forecast, by Country 2019 & 2032
- Table 6: United States North America Armored Fighting Vehicles Industry Revenue (Million) Forecast, by Application 2019 & 2032
- Table 7: Canada North America Armored Fighting Vehicles Industry Revenue (Million) Forecast, by Application 2019 & 2032
- Table 8: Mexico North America Armored Fighting Vehicles Industry Revenue (Million) Forecast, by Application 2019 & 2032
- Table 9: Rest of North America North America Armored Fighting Vehicles Industry Revenue (Million) Forecast, by Application 2019 & 2032
- Table 10: North America Armored Fighting Vehicles Industry Revenue Million Forecast, by Vehicle Type 2019 & 2032
- Table 11: North America Armored Fighting Vehicles Industry Revenue Million Forecast, by Geography 2019 & 2032
- Table 12: North America Armored Fighting Vehicles Industry Revenue Million Forecast, by Country 2019 & 2032
- Table 13: North America Armored Fighting Vehicles Industry Revenue Million Forecast, by Vehicle Type 2019 & 2032
- Table 14: North America Armored Fighting Vehicles Industry Revenue Million Forecast, by Geography 2019 & 2032
- Table 15: North America Armored Fighting Vehicles Industry Revenue Million Forecast, by Country 2019 & 2032
Frequently Asked Questions
1. What is the projected Compound Annual Growth Rate (CAGR) of the North America Armored Fighting Vehicles Industry?
The projected CAGR is approximately 5.18%.
2. Which companies are prominent players in the North America Armored Fighting Vehicles Industry?
Key companies in the market include Textron Inc, THALES, Oshkosh Corporation, General Dynamics Corporation, Rheinmetall AG, Elbit Systems Ltd, QinetiQ Group, AM General LLC, Leonardo S p A, BAE Systems plc, HDT Global.
3. What are the main segments of the North America Armored Fighting Vehicles Industry?
The market segments include Vehicle Type, Geography.
4. Can you provide details about the market size?
The market size is estimated to be USD 6.51 Million as of 2022.
5. What are some drivers contributing to market growth?
N/A
6. What are the notable trends driving market growth?
Main Battle Tanks Segment to Dominate the Market.
7. Are there any restraints impacting market growth?
N/A
8. Can you provide examples of recent developments in the market?
November 2022: BAE Systems plc was awarded a contract worth USD 32 million by the US Department of Defense (DoD) to supply M2A4 and M7A4 Bradley fighting vehicles to the US Army. These vehicles are designed to provide mechanized infantry with improved mobility, firepower, and protection. The project is slated to be completed by August 2023.
9. What pricing options are available for accessing the report?
Pricing options include single-user, multi-user, and enterprise licenses priced at USD 4750, USD 5250, and USD 8750 respectively.
10. Is the market size provided in terms of value or volume?
The market size is provided in terms of value, measured in Million.
11. Are there any specific market keywords associated with the report?
Yes, the market keyword associated with the report is "North America Armored Fighting Vehicles Industry," which aids in identifying and referencing the specific market segment covered.
12. How do I determine which pricing option suits my needs best?
The pricing options vary based on user requirements and access needs. Individual users may opt for single-user licenses, while businesses requiring broader access may choose multi-user or enterprise licenses for cost-effective access to the report.
13. Are there any additional resources or data provided in the North America Armored Fighting Vehicles Industry report?
While the report offers comprehensive insights, it's advisable to review the specific contents or supplementary materials provided to ascertain if additional resources or data are available.
14. How can I stay updated on further developments or reports in the North America Armored Fighting Vehicles Industry?
To stay informed about further developments, trends, and reports in the North America Armored Fighting Vehicles Industry, consider subscribing to industry newsletters, following relevant companies and organizations, or regularly checking reputable industry news sources and publications.
Methodology
Step 1 - Identification of Relevant Samples Size from Population Database


Step 2 - Approaches for Defining Global Market Size (Value, Volume* & Price*)

Note*: In applicable scenarios
Step 3 - Data Sources
Primary Research
- Web Analytics
- Survey Reports
- Research Institute
- Latest Research Reports
- Opinion Leaders
Secondary Research
- Annual Reports
- White Paper
- Latest Press Release
- Industry Association
- Paid Database
- Investor Presentations

Step 4 - Data Triangulation
Involves using different sources of information in order to increase the validity of a study
These sources are likely to be stakeholders in a program - participants, other researchers, program staff, other community members, and so on.
Then we put all data in single framework & apply various statistical tools to find out the dynamic on the market.
During the analysis stage, feedback from the stakeholder groups would be compared to determine areas of agreement as well as areas of divergence
