

Key Insights
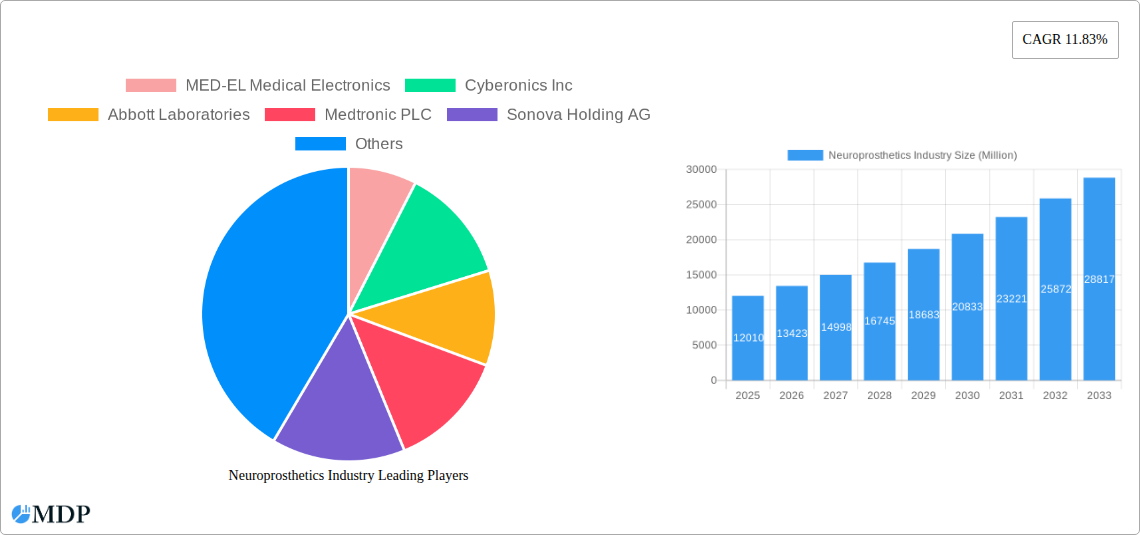
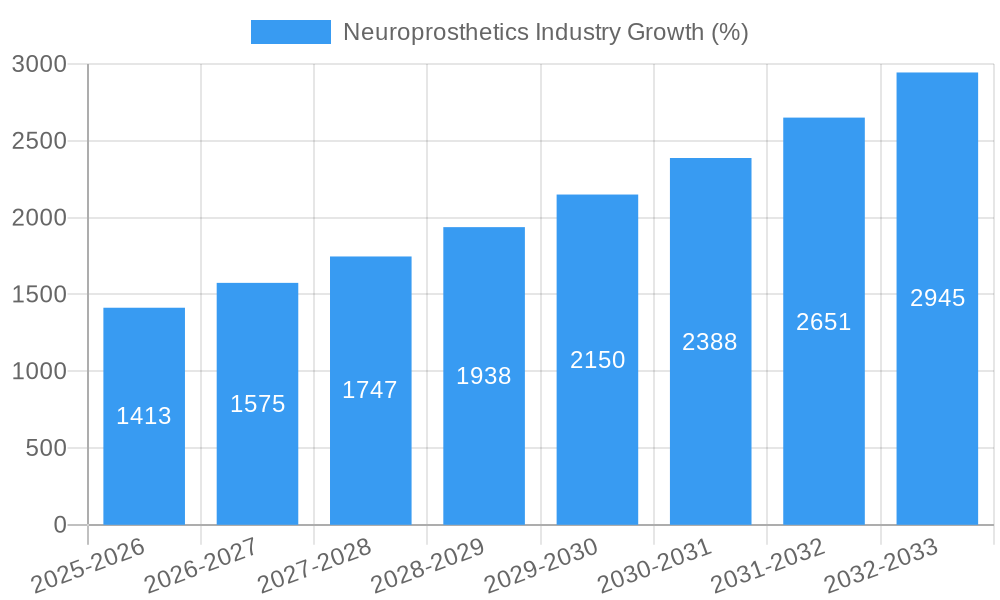
The global neuroprosthetics market, valued at $12.01 billion in 2025, is projected to experience robust growth, driven by a compound annual growth rate (CAGR) of 11.83% from 2025 to 2033. This expansion is fueled by several key factors. Firstly, the rising prevalence of neurological disorders like Parkinson's disease, Alzheimer's disease, and epilepsy is creating a significant demand for effective treatment options. Neuroprosthetics offer a promising avenue for improving the quality of life for patients suffering from these conditions, thereby driving market growth. Secondly, advancements in neurostimulation techniques, including deep brain stimulation (DBS), spinal cord stimulation (SCS), and vagus nerve stimulation (VNS), are enhancing the efficacy and safety of neuroprosthetics, leading to wider adoption. Furthermore, ongoing research and development efforts focused on improving the biocompatibility and functionality of implantable devices are further contributing to market expansion. The development of sophisticated neural interfaces capable of more precise and targeted stimulation is also a significant driver.
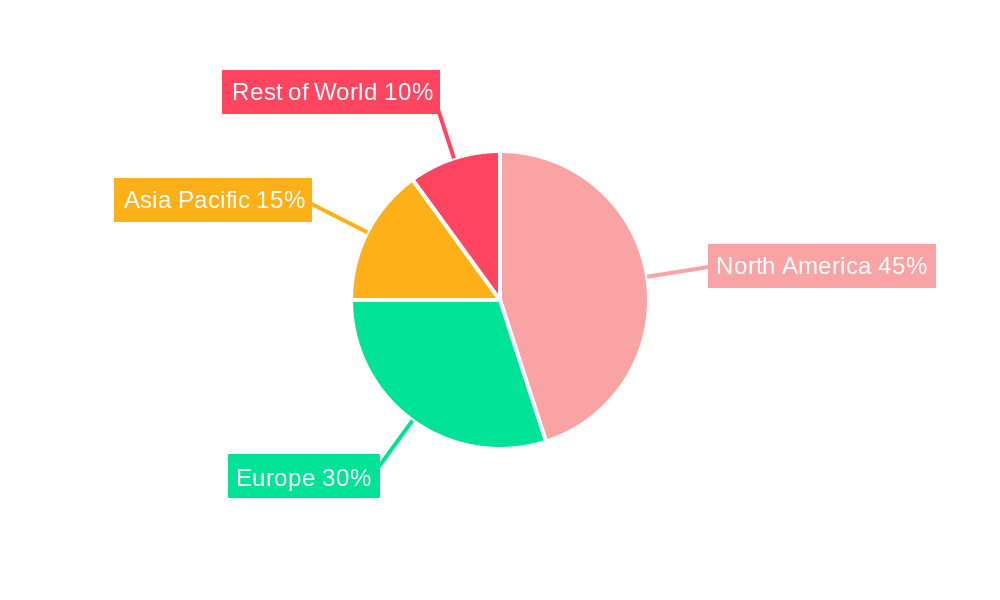
The market segmentation reveals significant opportunities within various application areas. Input and output neural prosthetics cater to diverse needs, while techniques like DBS and SCS dominate due to their established clinical efficacy. Geographically, North America currently holds a substantial market share due to advanced healthcare infrastructure and high adoption rates of innovative medical technologies. However, the Asia-Pacific region is expected to witness significant growth in the coming years, driven by rising healthcare expenditure and a growing awareness of neuroprosthetics among patients and healthcare professionals. Competitive landscape analysis indicates that major players like Medtronic, Abbott Laboratories, and Boston Scientific are actively involved in developing and commercializing advanced neuroprosthetics, fostering innovation and contributing to market expansion. While challenges remain, including the high cost of devices and procedures, and potential side effects, the overall market outlook for neuroprosthetics remains highly positive, promising substantial growth over the forecast period.
Neuroprosthetics Industry Report: 2019-2033
Dive into the dynamic world of neuroprosthetics with this comprehensive market analysis, projecting a xx Million USD market by 2033. This report provides a detailed examination of the neuroprosthetics industry, covering market size, leading players, technological advancements, and future growth potential. From spinal cord stimulation to brain-computer interfaces, we uncover the key trends shaping this transformative sector. Our in-depth analysis, spanning the historical period (2019-2024), base year (2025), and forecast period (2025-2033), equips stakeholders with actionable insights for strategic decision-making.
Neuroprosthetics Industry Market Dynamics & Concentration
The neuroprosthetics market is characterized by moderate concentration, with several multinational corporations holding significant market share. The industry is witnessing robust innovation driven by advancements in materials science, miniaturization, and improved biocompatibility. Stringent regulatory frameworks, particularly in relation to safety and efficacy, govern product approvals. While there are limited direct substitutes for neuroprosthetics, alternative treatment options influence market penetration. End-user preferences are increasingly focused on minimally invasive procedures with enhanced outcomes and improved quality of life. Mergers and acquisitions (M&A) activity remains prevalent, with an estimated xx M&A deals occurring between 2019 and 2024, consolidating market power and driving technological integration. Key players such as Medtronic PLC and Abbott Laboratories hold a significant portion of the overall market share, exceeding xx% collectively, while other companies such as Cochlear Limited and MED-EL maintain substantial regional influence.
Neuroprosthetics Industry Industry Trends & Analysis
The neuroprosthetics industry is experiencing substantial growth, propelled by a rising geriatric population, increasing prevalence of neurological disorders, and technological advancements. The market is projected to register a Compound Annual Growth Rate (CAGR) of xx% during the forecast period (2025-2033), reaching a value of xx Million USD by 2033. Market penetration is expected to increase significantly across various applications, particularly in treating Parkinson's disease, epilepsy, and auditory processing disorders. Technological disruptions, such as the development of advanced brain-computer interfaces (BCIs) and minimally invasive surgical techniques, are revolutionizing the industry, enhancing treatment efficacy and reducing side effects. Consumer preferences are shifting towards personalized and adaptive neuroprosthetics with improved patient compliance and ease of use. The competitive landscape remains dynamic, with both established players and emerging companies vying for market share through innovation and strategic partnerships.
Leading Markets & Segments in Neuroprosthetics Industry
North America currently dominates the neuroprosthetics market, driven by robust healthcare infrastructure, high technological adoption rates, and significant investments in research and development.
- Key Drivers in North America: Strong regulatory support, high healthcare expenditure, and advanced medical technology infrastructure.
Within the neuroprosthetics segment, output neural prosthetics currently hold a larger market share than input neural prosthetics, due to greater maturity of the technology and wider clinical adoption. Deep brain stimulation (DBS) and spinal cord stimulation (SCS) techniques are currently the most prevalent, while vagus nerve stimulation is demonstrating increasing adoption rates. Parkinson's disease and auditory processing disorders represent the largest application segments.
- Dominance Analysis: The dominance of North America is attributed to its early adoption of neuroprosthetics technology and the presence of major market players such as Medtronic, Abbott and Boston Scientific. The high prevalence of age-related neurological disorders and significant healthcare spending further contribute to market growth.
Neuroprosthetics Industry Product Developments
Recent innovations focus on miniaturization, improved biocompatibility, and wireless connectivity. Smart implants with adaptive stimulation algorithms are gaining traction, while advancements in BCIs are opening doors to new therapeutic applications. This enhanced technology offers improved therapeutic efficacy and reduces the risks associated with traditional invasive surgeries. The market is seeing a move towards closed-loop systems providing more personalized and effective treatments.
Key Drivers of Neuroprosthetics Industry Growth
Several factors fuel the neuroprosthetics market's expansion. These include the rising prevalence of neurological disorders (such as Parkinson’s and Alzheimer’s), substantial investments in R&D, advancements in minimally invasive surgical techniques and biocompatible materials, and supportive government regulations encouraging technology adoption. The increasing availability of reimbursement options and the growing demand for advanced therapies further boost market growth.
Challenges in the Neuroprosthetics Industry Market
The neuroprosthetics market faces challenges including high development costs, stringent regulatory approvals processes (potentially delaying product launches), complexities in clinical trials for BCIs, and the risk of adverse effects. Furthermore, the market also faces supply chain disruptions and intense competition among established players and emerging companies. These factors cumulatively influence the overall market trajectory and cost-effectiveness.
Emerging Opportunities in Neuroprosthetics Industry
Significant opportunities exist within the development of sophisticated BCIs, personalized medicine approaches, and AI-driven stimulation protocols. Strategic partnerships between technology firms and healthcare providers are creating synergies, while expanding into emerging markets holds substantial potential. These collaborative efforts are leading to the creation of innovative devices and treatments with improved outcomes.
Leading Players in the Neuroprosthetics Industry Sector
- MED-EL Medical Electronics
- Cyberonics Inc
- Abbott Laboratories
- Medtronic PLC
- Sonova Holding AG
- LivaNova PLC
- Demant AS
- Boston Scientific Corporation
- Second Sight
- Cochlear Limited
- BrainGate
Key Milestones in Neuroprosthetics Industry Industry
- December 2022: The Government of Saskatchewan launched an expanded Cochlear Implant Program, significantly increasing accessibility.
- October 2022: Axoft secured USD 8 Million in funding for its FDA breakthrough-designated brain-machine interface.
Strategic Outlook for Neuroprosthetics Industry Market
The neuroprosthetics market exhibits immense long-term potential, driven by continuous technological advancements and rising healthcare needs. Strategic opportunities include focusing on personalized therapies, developing cost-effective devices, and expanding into underserved global markets. The increasing integration of AI and machine learning into neuroprosthetics holds the promise of enhancing treatment efficacy and improving patient outcomes, leading to further market expansion.
Neuroprosthetics Industry Segmentation
-
1. Type
- 1.1. Output Neural Prosthetics
- 1.2. Input Neural Prosthetics
-
2. Technique
- 2.1. Spinal Cord Stimulation
- 2.2. Deep Brain Stimulation
- 2.3. Vagus Nerve Stimulation
- 2.4. Other Techniques
-
3. Application
- 3.1. Parkinson's Disease
- 3.2. Alzheimer's Disease
- 3.3. Epilepsy
- 3.4. Auditory Processing Disorders
- 3.5. Ophthalmic Disorders
- 3.6. Other Applications
Neuroprosthetics Industry Segmentation By Geography
-
1. North America
- 1.1. United States
- 1.2. Canada
- 1.3. Mexico
-
2. Europe
- 2.1. Germany
- 2.2. United Kingdom
- 2.3. France
- 2.4. Italy
- 2.5. Spain
- 2.6. Rest of Europe
-
3. Asia Pacific
- 3.1. China
- 3.2. Japan
- 3.3. India
- 3.4. Australia
- 3.5. South Korea
- 3.6. Rest of Asia Pacific
-
4. Middle East and Africa
- 4.1. GCC
- 4.2. South Africa
- 4.3. Rest of Middle East and Africa
-
5. South America
- 5.1. Brazil
- 5.2. Argentina
- 5.3. Rest of South America
Neuroprosthetics Industry REPORT HIGHLIGHTS
| Aspects | Details |
|---|---|
| Study Period | 2019-2033 |
| Base Year | 2024 |
| Estimated Year | 2025 |
| Forecast Period | 2025-2033 |
| Historical Period | 2019-2024 |
| Growth Rate | CAGR of 11.83% from 2019-2033 |
| Segmentation |
|
Table of Contents
- 1. Introduction
- 1.1. Research Scope
- 1.2. Market Segmentation
- 1.3. Research Methodology
- 1.4. Definitions and Assumptions
- 2. Executive Summary
- 2.1. Introduction
- 3. Market Dynamics
- 3.1. Introduction
- 3.2. Market Drivers
- 3.2.1. Increasing Number of Patients Suffering from Neurological Disorders and Nerve Injury; Growing Burden of Hearing Loss and Related Defects
- 3.3. Market Restrains
- 3.3.1. Availability of Alternative Treatment Options; High Cost of Neuroprosthetics
- 3.4. Market Trends
- 3.4.1. The Input Neural Prosthetics Segment is Expected to Show a Significant Growth Over the Forecast Period
- 4. Market Factor Analysis
- 4.1. Porters Five Forces
- 4.2. Supply/Value Chain
- 4.3. PESTEL analysis
- 4.4. Market Entropy
- 4.5. Patent/Trademark Analysis
- 5. Global Neuroprosthetics Industry Analysis, Insights and Forecast, 2019-2031
- 5.1. Market Analysis, Insights and Forecast - by Type
- 5.1.1. Output Neural Prosthetics
- 5.1.2. Input Neural Prosthetics
- 5.2. Market Analysis, Insights and Forecast - by Technique
- 5.2.1. Spinal Cord Stimulation
- 5.2.2. Deep Brain Stimulation
- 5.2.3. Vagus Nerve Stimulation
- 5.2.4. Other Techniques
- 5.3. Market Analysis, Insights and Forecast - by Application
- 5.3.1. Parkinson's Disease
- 5.3.2. Alzheimer's Disease
- 5.3.3. Epilepsy
- 5.3.4. Auditory Processing Disorders
- 5.3.5. Ophthalmic Disorders
- 5.3.6. Other Applications
- 5.4. Market Analysis, Insights and Forecast - by Region
- 5.4.1. North America
- 5.4.2. Europe
- 5.4.3. Asia Pacific
- 5.4.4. Middle East and Africa
- 5.4.5. South America
- 5.1. Market Analysis, Insights and Forecast - by Type
- 6. North America Neuroprosthetics Industry Analysis, Insights and Forecast, 2019-2031
- 6.1. Market Analysis, Insights and Forecast - by Type
- 6.1.1. Output Neural Prosthetics
- 6.1.2. Input Neural Prosthetics
- 6.2. Market Analysis, Insights and Forecast - by Technique
- 6.2.1. Spinal Cord Stimulation
- 6.2.2. Deep Brain Stimulation
- 6.2.3. Vagus Nerve Stimulation
- 6.2.4. Other Techniques
- 6.3. Market Analysis, Insights and Forecast - by Application
- 6.3.1. Parkinson's Disease
- 6.3.2. Alzheimer's Disease
- 6.3.3. Epilepsy
- 6.3.4. Auditory Processing Disorders
- 6.3.5. Ophthalmic Disorders
- 6.3.6. Other Applications
- 6.1. Market Analysis, Insights and Forecast - by Type
- 7. Europe Neuroprosthetics Industry Analysis, Insights and Forecast, 2019-2031
- 7.1. Market Analysis, Insights and Forecast - by Type
- 7.1.1. Output Neural Prosthetics
- 7.1.2. Input Neural Prosthetics
- 7.2. Market Analysis, Insights and Forecast - by Technique
- 7.2.1. Spinal Cord Stimulation
- 7.2.2. Deep Brain Stimulation
- 7.2.3. Vagus Nerve Stimulation
- 7.2.4. Other Techniques
- 7.3. Market Analysis, Insights and Forecast - by Application
- 7.3.1. Parkinson's Disease
- 7.3.2. Alzheimer's Disease
- 7.3.3. Epilepsy
- 7.3.4. Auditory Processing Disorders
- 7.3.5. Ophthalmic Disorders
- 7.3.6. Other Applications
- 7.1. Market Analysis, Insights and Forecast - by Type
- 8. Asia Pacific Neuroprosthetics Industry Analysis, Insights and Forecast, 2019-2031
- 8.1. Market Analysis, Insights and Forecast - by Type
- 8.1.1. Output Neural Prosthetics
- 8.1.2. Input Neural Prosthetics
- 8.2. Market Analysis, Insights and Forecast - by Technique
- 8.2.1. Spinal Cord Stimulation
- 8.2.2. Deep Brain Stimulation
- 8.2.3. Vagus Nerve Stimulation
- 8.2.4. Other Techniques
- 8.3. Market Analysis, Insights and Forecast - by Application
- 8.3.1. Parkinson's Disease
- 8.3.2. Alzheimer's Disease
- 8.3.3. Epilepsy
- 8.3.4. Auditory Processing Disorders
- 8.3.5. Ophthalmic Disorders
- 8.3.6. Other Applications
- 8.1. Market Analysis, Insights and Forecast - by Type
- 9. Middle East and Africa Neuroprosthetics Industry Analysis, Insights and Forecast, 2019-2031
- 9.1. Market Analysis, Insights and Forecast - by Type
- 9.1.1. Output Neural Prosthetics
- 9.1.2. Input Neural Prosthetics
- 9.2. Market Analysis, Insights and Forecast - by Technique
- 9.2.1. Spinal Cord Stimulation
- 9.2.2. Deep Brain Stimulation
- 9.2.3. Vagus Nerve Stimulation
- 9.2.4. Other Techniques
- 9.3. Market Analysis, Insights and Forecast - by Application
- 9.3.1. Parkinson's Disease
- 9.3.2. Alzheimer's Disease
- 9.3.3. Epilepsy
- 9.3.4. Auditory Processing Disorders
- 9.3.5. Ophthalmic Disorders
- 9.3.6. Other Applications
- 9.1. Market Analysis, Insights and Forecast - by Type
- 10. South America Neuroprosthetics Industry Analysis, Insights and Forecast, 2019-2031
- 10.1. Market Analysis, Insights and Forecast - by Type
- 10.1.1. Output Neural Prosthetics
- 10.1.2. Input Neural Prosthetics
- 10.2. Market Analysis, Insights and Forecast - by Technique
- 10.2.1. Spinal Cord Stimulation
- 10.2.2. Deep Brain Stimulation
- 10.2.3. Vagus Nerve Stimulation
- 10.2.4. Other Techniques
- 10.3. Market Analysis, Insights and Forecast - by Application
- 10.3.1. Parkinson's Disease
- 10.3.2. Alzheimer's Disease
- 10.3.3. Epilepsy
- 10.3.4. Auditory Processing Disorders
- 10.3.5. Ophthalmic Disorders
- 10.3.6. Other Applications
- 10.1. Market Analysis, Insights and Forecast - by Type
- 11. North Americ Neuroprosthetics Industry Analysis, Insights and Forecast, 2019-2031
- 11.1. Market Analysis, Insights and Forecast - By Country/Sub-region
- 11.1.1 United States
- 11.1.2 Canada
- 11.1.3 Mexico
- 12. South America Neuroprosthetics Industry Analysis, Insights and Forecast, 2019-2031
- 12.1. Market Analysis, Insights and Forecast - By Country/Sub-region
- 12.1.1 Brazil
- 12.1.2 Mexico
- 12.1.3 Rest of South America
- 13. Europe Neuroprosthetics Industry Analysis, Insights and Forecast, 2019-2031
- 13.1. Market Analysis, Insights and Forecast - By Country/Sub-region
- 13.1.1 Germany
- 13.1.2 United Kingdom
- 13.1.3 France
- 13.1.4 Italy
- 13.1.5 Spain
- 13.1.6 Rest of Europe
- 14. Asia Pacific Neuroprosthetics Industry Analysis, Insights and Forecast, 2019-2031
- 14.1. Market Analysis, Insights and Forecast - By Country/Sub-region
- 14.1.1 China
- 14.1.2 Japan
- 14.1.3 India
- 14.1.4 South Korea
- 14.1.5 Taiwan
- 14.1.6 Australia
- 14.1.7 Rest of Asia-Pacific
- 15. MEA Neuroprosthetics Industry Analysis, Insights and Forecast, 2019-2031
- 15.1. Market Analysis, Insights and Forecast - By Country/Sub-region
- 15.1.1 Middle East
- 15.1.2 Africa
- 16. Competitive Analysis
- 16.1. Global Market Share Analysis 2024
- 16.2. Company Profiles
- 16.2.1 MED-EL Medical Electronics
- 16.2.1.1. Overview
- 16.2.1.2. Products
- 16.2.1.3. SWOT Analysis
- 16.2.1.4. Recent Developments
- 16.2.1.5. Financials (Based on Availability)
- 16.2.2 Cyberonics Inc
- 16.2.2.1. Overview
- 16.2.2.2. Products
- 16.2.2.3. SWOT Analysis
- 16.2.2.4. Recent Developments
- 16.2.2.5. Financials (Based on Availability)
- 16.2.3 Abbott Laboratories
- 16.2.3.1. Overview
- 16.2.3.2. Products
- 16.2.3.3. SWOT Analysis
- 16.2.3.4. Recent Developments
- 16.2.3.5. Financials (Based on Availability)
- 16.2.4 Medtronic PLC
- 16.2.4.1. Overview
- 16.2.4.2. Products
- 16.2.4.3. SWOT Analysis
- 16.2.4.4. Recent Developments
- 16.2.4.5. Financials (Based on Availability)
- 16.2.5 Sonova Holding AG
- 16.2.5.1. Overview
- 16.2.5.2. Products
- 16.2.5.3. SWOT Analysis
- 16.2.5.4. Recent Developments
- 16.2.5.5. Financials (Based on Availability)
- 16.2.6 LivaNova PLC
- 16.2.6.1. Overview
- 16.2.6.2. Products
- 16.2.6.3. SWOT Analysis
- 16.2.6.4. Recent Developments
- 16.2.6.5. Financials (Based on Availability)
- 16.2.7 Demant AS
- 16.2.7.1. Overview
- 16.2.7.2. Products
- 16.2.7.3. SWOT Analysis
- 16.2.7.4. Recent Developments
- 16.2.7.5. Financials (Based on Availability)
- 16.2.8 Boston Scientific Corporation
- 16.2.8.1. Overview
- 16.2.8.2. Products
- 16.2.8.3. SWOT Analysis
- 16.2.8.4. Recent Developments
- 16.2.8.5. Financials (Based on Availability)
- 16.2.9 Second Sight
- 16.2.9.1. Overview
- 16.2.9.2. Products
- 16.2.9.3. SWOT Analysis
- 16.2.9.4. Recent Developments
- 16.2.9.5. Financials (Based on Availability)
- 16.2.10 Cochlear Limited
- 16.2.10.1. Overview
- 16.2.10.2. Products
- 16.2.10.3. SWOT Analysis
- 16.2.10.4. Recent Developments
- 16.2.10.5. Financials (Based on Availability)
- 16.2.11 BrainGate
- 16.2.11.1. Overview
- 16.2.11.2. Products
- 16.2.11.3. SWOT Analysis
- 16.2.11.4. Recent Developments
- 16.2.11.5. Financials (Based on Availability)
- 16.2.1 MED-EL Medical Electronics
List of Figures
- Figure 1: Global Neuroprosthetics Industry Revenue Breakdown (Million, %) by Region 2024 & 2032
- Figure 2: Global Neuroprosthetics Industry Volume Breakdown (K Unit, %) by Region 2024 & 2032
- Figure 3: North Americ Neuroprosthetics Industry Revenue (Million), by Country 2024 & 2032
- Figure 4: North Americ Neuroprosthetics Industry Volume (K Unit), by Country 2024 & 2032
- Figure 5: North Americ Neuroprosthetics Industry Revenue Share (%), by Country 2024 & 2032
- Figure 6: North Americ Neuroprosthetics Industry Volume Share (%), by Country 2024 & 2032
- Figure 7: South America Neuroprosthetics Industry Revenue (Million), by Country 2024 & 2032
- Figure 8: South America Neuroprosthetics Industry Volume (K Unit), by Country 2024 & 2032
- Figure 9: South America Neuroprosthetics Industry Revenue Share (%), by Country 2024 & 2032
- Figure 10: South America Neuroprosthetics Industry Volume Share (%), by Country 2024 & 2032
- Figure 11: Europe Neuroprosthetics Industry Revenue (Million), by Country 2024 & 2032
- Figure 12: Europe Neuroprosthetics Industry Volume (K Unit), by Country 2024 & 2032
- Figure 13: Europe Neuroprosthetics Industry Revenue Share (%), by Country 2024 & 2032
- Figure 14: Europe Neuroprosthetics Industry Volume Share (%), by Country 2024 & 2032
- Figure 15: Asia Pacific Neuroprosthetics Industry Revenue (Million), by Country 2024 & 2032
- Figure 16: Asia Pacific Neuroprosthetics Industry Volume (K Unit), by Country 2024 & 2032
- Figure 17: Asia Pacific Neuroprosthetics Industry Revenue Share (%), by Country 2024 & 2032
- Figure 18: Asia Pacific Neuroprosthetics Industry Volume Share (%), by Country 2024 & 2032
- Figure 19: MEA Neuroprosthetics Industry Revenue (Million), by Country 2024 & 2032
- Figure 20: MEA Neuroprosthetics Industry Volume (K Unit), by Country 2024 & 2032
- Figure 21: MEA Neuroprosthetics Industry Revenue Share (%), by Country 2024 & 2032
- Figure 22: MEA Neuroprosthetics Industry Volume Share (%), by Country 2024 & 2032
- Figure 23: North America Neuroprosthetics Industry Revenue (Million), by Type 2024 & 2032
- Figure 24: North America Neuroprosthetics Industry Volume (K Unit), by Type 2024 & 2032
- Figure 25: North America Neuroprosthetics Industry Revenue Share (%), by Type 2024 & 2032
- Figure 26: North America Neuroprosthetics Industry Volume Share (%), by Type 2024 & 2032
- Figure 27: North America Neuroprosthetics Industry Revenue (Million), by Technique 2024 & 2032
- Figure 28: North America Neuroprosthetics Industry Volume (K Unit), by Technique 2024 & 2032
- Figure 29: North America Neuroprosthetics Industry Revenue Share (%), by Technique 2024 & 2032
- Figure 30: North America Neuroprosthetics Industry Volume Share (%), by Technique 2024 & 2032
- Figure 31: North America Neuroprosthetics Industry Revenue (Million), by Application 2024 & 2032
- Figure 32: North America Neuroprosthetics Industry Volume (K Unit), by Application 2024 & 2032
- Figure 33: North America Neuroprosthetics Industry Revenue Share (%), by Application 2024 & 2032
- Figure 34: North America Neuroprosthetics Industry Volume Share (%), by Application 2024 & 2032
- Figure 35: North America Neuroprosthetics Industry Revenue (Million), by Country 2024 & 2032
- Figure 36: North America Neuroprosthetics Industry Volume (K Unit), by Country 2024 & 2032
- Figure 37: North America Neuroprosthetics Industry Revenue Share (%), by Country 2024 & 2032
- Figure 38: North America Neuroprosthetics Industry Volume Share (%), by Country 2024 & 2032
- Figure 39: Europe Neuroprosthetics Industry Revenue (Million), by Type 2024 & 2032
- Figure 40: Europe Neuroprosthetics Industry Volume (K Unit), by Type 2024 & 2032
- Figure 41: Europe Neuroprosthetics Industry Revenue Share (%), by Type 2024 & 2032
- Figure 42: Europe Neuroprosthetics Industry Volume Share (%), by Type 2024 & 2032
- Figure 43: Europe Neuroprosthetics Industry Revenue (Million), by Technique 2024 & 2032
- Figure 44: Europe Neuroprosthetics Industry Volume (K Unit), by Technique 2024 & 2032
- Figure 45: Europe Neuroprosthetics Industry Revenue Share (%), by Technique 2024 & 2032
- Figure 46: Europe Neuroprosthetics Industry Volume Share (%), by Technique 2024 & 2032
- Figure 47: Europe Neuroprosthetics Industry Revenue (Million), by Application 2024 & 2032
- Figure 48: Europe Neuroprosthetics Industry Volume (K Unit), by Application 2024 & 2032
- Figure 49: Europe Neuroprosthetics Industry Revenue Share (%), by Application 2024 & 2032
- Figure 50: Europe Neuroprosthetics Industry Volume Share (%), by Application 2024 & 2032
- Figure 51: Europe Neuroprosthetics Industry Revenue (Million), by Country 2024 & 2032
- Figure 52: Europe Neuroprosthetics Industry Volume (K Unit), by Country 2024 & 2032
- Figure 53: Europe Neuroprosthetics Industry Revenue Share (%), by Country 2024 & 2032
- Figure 54: Europe Neuroprosthetics Industry Volume Share (%), by Country 2024 & 2032
- Figure 55: Asia Pacific Neuroprosthetics Industry Revenue (Million), by Type 2024 & 2032
- Figure 56: Asia Pacific Neuroprosthetics Industry Volume (K Unit), by Type 2024 & 2032
- Figure 57: Asia Pacific Neuroprosthetics Industry Revenue Share (%), by Type 2024 & 2032
- Figure 58: Asia Pacific Neuroprosthetics Industry Volume Share (%), by Type 2024 & 2032
- Figure 59: Asia Pacific Neuroprosthetics Industry Revenue (Million), by Technique 2024 & 2032
- Figure 60: Asia Pacific Neuroprosthetics Industry Volume (K Unit), by Technique 2024 & 2032
- Figure 61: Asia Pacific Neuroprosthetics Industry Revenue Share (%), by Technique 2024 & 2032
- Figure 62: Asia Pacific Neuroprosthetics Industry Volume Share (%), by Technique 2024 & 2032
- Figure 63: Asia Pacific Neuroprosthetics Industry Revenue (Million), by Application 2024 & 2032
- Figure 64: Asia Pacific Neuroprosthetics Industry Volume (K Unit), by Application 2024 & 2032
- Figure 65: Asia Pacific Neuroprosthetics Industry Revenue Share (%), by Application 2024 & 2032
- Figure 66: Asia Pacific Neuroprosthetics Industry Volume Share (%), by Application 2024 & 2032
- Figure 67: Asia Pacific Neuroprosthetics Industry Revenue (Million), by Country 2024 & 2032
- Figure 68: Asia Pacific Neuroprosthetics Industry Volume (K Unit), by Country 2024 & 2032
- Figure 69: Asia Pacific Neuroprosthetics Industry Revenue Share (%), by Country 2024 & 2032
- Figure 70: Asia Pacific Neuroprosthetics Industry Volume Share (%), by Country 2024 & 2032
- Figure 71: Middle East and Africa Neuroprosthetics Industry Revenue (Million), by Type 2024 & 2032
- Figure 72: Middle East and Africa Neuroprosthetics Industry Volume (K Unit), by Type 2024 & 2032
- Figure 73: Middle East and Africa Neuroprosthetics Industry Revenue Share (%), by Type 2024 & 2032
- Figure 74: Middle East and Africa Neuroprosthetics Industry Volume Share (%), by Type 2024 & 2032
- Figure 75: Middle East and Africa Neuroprosthetics Industry Revenue (Million), by Technique 2024 & 2032
- Figure 76: Middle East and Africa Neuroprosthetics Industry Volume (K Unit), by Technique 2024 & 2032
- Figure 77: Middle East and Africa Neuroprosthetics Industry Revenue Share (%), by Technique 2024 & 2032
- Figure 78: Middle East and Africa Neuroprosthetics Industry Volume Share (%), by Technique 2024 & 2032
- Figure 79: Middle East and Africa Neuroprosthetics Industry Revenue (Million), by Application 2024 & 2032
- Figure 80: Middle East and Africa Neuroprosthetics Industry Volume (K Unit), by Application 2024 & 2032
- Figure 81: Middle East and Africa Neuroprosthetics Industry Revenue Share (%), by Application 2024 & 2032
- Figure 82: Middle East and Africa Neuroprosthetics Industry Volume Share (%), by Application 2024 & 2032
- Figure 83: Middle East and Africa Neuroprosthetics Industry Revenue (Million), by Country 2024 & 2032
- Figure 84: Middle East and Africa Neuroprosthetics Industry Volume (K Unit), by Country 2024 & 2032
- Figure 85: Middle East and Africa Neuroprosthetics Industry Revenue Share (%), by Country 2024 & 2032
- Figure 86: Middle East and Africa Neuroprosthetics Industry Volume Share (%), by Country 2024 & 2032
- Figure 87: South America Neuroprosthetics Industry Revenue (Million), by Type 2024 & 2032
- Figure 88: South America Neuroprosthetics Industry Volume (K Unit), by Type 2024 & 2032
- Figure 89: South America Neuroprosthetics Industry Revenue Share (%), by Type 2024 & 2032
- Figure 90: South America Neuroprosthetics Industry Volume Share (%), by Type 2024 & 2032
- Figure 91: South America Neuroprosthetics Industry Revenue (Million), by Technique 2024 & 2032
- Figure 92: South America Neuroprosthetics Industry Volume (K Unit), by Technique 2024 & 2032
- Figure 93: South America Neuroprosthetics Industry Revenue Share (%), by Technique 2024 & 2032
- Figure 94: South America Neuroprosthetics Industry Volume Share (%), by Technique 2024 & 2032
- Figure 95: South America Neuroprosthetics Industry Revenue (Million), by Application 2024 & 2032
- Figure 96: South America Neuroprosthetics Industry Volume (K Unit), by Application 2024 & 2032
- Figure 97: South America Neuroprosthetics Industry Revenue Share (%), by Application 2024 & 2032
- Figure 98: South America Neuroprosthetics Industry Volume Share (%), by Application 2024 & 2032
- Figure 99: South America Neuroprosthetics Industry Revenue (Million), by Country 2024 & 2032
- Figure 100: South America Neuroprosthetics Industry Volume (K Unit), by Country 2024 & 2032
- Figure 101: South America Neuroprosthetics Industry Revenue Share (%), by Country 2024 & 2032
- Figure 102: South America Neuroprosthetics Industry Volume Share (%), by Country 2024 & 2032
List of Tables
- Table 1: Global Neuroprosthetics Industry Revenue Million Forecast, by Region 2019 & 2032
- Table 2: Global Neuroprosthetics Industry Volume K Unit Forecast, by Region 2019 & 2032
- Table 3: Global Neuroprosthetics Industry Revenue Million Forecast, by Type 2019 & 2032
- Table 4: Global Neuroprosthetics Industry Volume K Unit Forecast, by Type 2019 & 2032
- Table 5: Global Neuroprosthetics Industry Revenue Million Forecast, by Technique 2019 & 2032
- Table 6: Global Neuroprosthetics Industry Volume K Unit Forecast, by Technique 2019 & 2032
- Table 7: Global Neuroprosthetics Industry Revenue Million Forecast, by Application 2019 & 2032
- Table 8: Global Neuroprosthetics Industry Volume K Unit Forecast, by Application 2019 & 2032
- Table 9: Global Neuroprosthetics Industry Revenue Million Forecast, by Region 2019 & 2032
- Table 10: Global Neuroprosthetics Industry Volume K Unit Forecast, by Region 2019 & 2032
- Table 11: Global Neuroprosthetics Industry Revenue Million Forecast, by Country 2019 & 2032
- Table 12: Global Neuroprosthetics Industry Volume K Unit Forecast, by Country 2019 & 2032
- Table 13: United States Neuroprosthetics Industry Revenue (Million) Forecast, by Application 2019 & 2032
- Table 14: United States Neuroprosthetics Industry Volume (K Unit) Forecast, by Application 2019 & 2032
- Table 15: Canada Neuroprosthetics Industry Revenue (Million) Forecast, by Application 2019 & 2032
- Table 16: Canada Neuroprosthetics Industry Volume (K Unit) Forecast, by Application 2019 & 2032
- Table 17: Mexico Neuroprosthetics Industry Revenue (Million) Forecast, by Application 2019 & 2032
- Table 18: Mexico Neuroprosthetics Industry Volume (K Unit) Forecast, by Application 2019 & 2032
- Table 19: Global Neuroprosthetics Industry Revenue Million Forecast, by Country 2019 & 2032
- Table 20: Global Neuroprosthetics Industry Volume K Unit Forecast, by Country 2019 & 2032
- Table 21: Brazil Neuroprosthetics Industry Revenue (Million) Forecast, by Application 2019 & 2032
- Table 22: Brazil Neuroprosthetics Industry Volume (K Unit) Forecast, by Application 2019 & 2032
- Table 23: Mexico Neuroprosthetics Industry Revenue (Million) Forecast, by Application 2019 & 2032
- Table 24: Mexico Neuroprosthetics Industry Volume (K Unit) Forecast, by Application 2019 & 2032
- Table 25: Rest of South America Neuroprosthetics Industry Revenue (Million) Forecast, by Application 2019 & 2032
- Table 26: Rest of South America Neuroprosthetics Industry Volume (K Unit) Forecast, by Application 2019 & 2032
- Table 27: Global Neuroprosthetics Industry Revenue Million Forecast, by Country 2019 & 2032
- Table 28: Global Neuroprosthetics Industry Volume K Unit Forecast, by Country 2019 & 2032
- Table 29: Germany Neuroprosthetics Industry Revenue (Million) Forecast, by Application 2019 & 2032
- Table 30: Germany Neuroprosthetics Industry Volume (K Unit) Forecast, by Application 2019 & 2032
- Table 31: United Kingdom Neuroprosthetics Industry Revenue (Million) Forecast, by Application 2019 & 2032
- Table 32: United Kingdom Neuroprosthetics Industry Volume (K Unit) Forecast, by Application 2019 & 2032
- Table 33: France Neuroprosthetics Industry Revenue (Million) Forecast, by Application 2019 & 2032
- Table 34: France Neuroprosthetics Industry Volume (K Unit) Forecast, by Application 2019 & 2032
- Table 35: Italy Neuroprosthetics Industry Revenue (Million) Forecast, by Application 2019 & 2032
- Table 36: Italy Neuroprosthetics Industry Volume (K Unit) Forecast, by Application 2019 & 2032
- Table 37: Spain Neuroprosthetics Industry Revenue (Million) Forecast, by Application 2019 & 2032
- Table 38: Spain Neuroprosthetics Industry Volume (K Unit) Forecast, by Application 2019 & 2032
- Table 39: Rest of Europe Neuroprosthetics Industry Revenue (Million) Forecast, by Application 2019 & 2032
- Table 40: Rest of Europe Neuroprosthetics Industry Volume (K Unit) Forecast, by Application 2019 & 2032
- Table 41: Global Neuroprosthetics Industry Revenue Million Forecast, by Country 2019 & 2032
- Table 42: Global Neuroprosthetics Industry Volume K Unit Forecast, by Country 2019 & 2032
- Table 43: China Neuroprosthetics Industry Revenue (Million) Forecast, by Application 2019 & 2032
- Table 44: China Neuroprosthetics Industry Volume (K Unit) Forecast, by Application 2019 & 2032
- Table 45: Japan Neuroprosthetics Industry Revenue (Million) Forecast, by Application 2019 & 2032
- Table 46: Japan Neuroprosthetics Industry Volume (K Unit) Forecast, by Application 2019 & 2032
- Table 47: India Neuroprosthetics Industry Revenue (Million) Forecast, by Application 2019 & 2032
- Table 48: India Neuroprosthetics Industry Volume (K Unit) Forecast, by Application 2019 & 2032
- Table 49: South Korea Neuroprosthetics Industry Revenue (Million) Forecast, by Application 2019 & 2032
- Table 50: South Korea Neuroprosthetics Industry Volume (K Unit) Forecast, by Application 2019 & 2032
- Table 51: Taiwan Neuroprosthetics Industry Revenue (Million) Forecast, by Application 2019 & 2032
- Table 52: Taiwan Neuroprosthetics Industry Volume (K Unit) Forecast, by Application 2019 & 2032
- Table 53: Australia Neuroprosthetics Industry Revenue (Million) Forecast, by Application 2019 & 2032
- Table 54: Australia Neuroprosthetics Industry Volume (K Unit) Forecast, by Application 2019 & 2032
- Table 55: Rest of Asia-Pacific Neuroprosthetics Industry Revenue (Million) Forecast, by Application 2019 & 2032
- Table 56: Rest of Asia-Pacific Neuroprosthetics Industry Volume (K Unit) Forecast, by Application 2019 & 2032
- Table 57: Global Neuroprosthetics Industry Revenue Million Forecast, by Country 2019 & 2032
- Table 58: Global Neuroprosthetics Industry Volume K Unit Forecast, by Country 2019 & 2032
- Table 59: Middle East Neuroprosthetics Industry Revenue (Million) Forecast, by Application 2019 & 2032
- Table 60: Middle East Neuroprosthetics Industry Volume (K Unit) Forecast, by Application 2019 & 2032
- Table 61: Africa Neuroprosthetics Industry Revenue (Million) Forecast, by Application 2019 & 2032
- Table 62: Africa Neuroprosthetics Industry Volume (K Unit) Forecast, by Application 2019 & 2032
- Table 63: Global Neuroprosthetics Industry Revenue Million Forecast, by Type 2019 & 2032
- Table 64: Global Neuroprosthetics Industry Volume K Unit Forecast, by Type 2019 & 2032
- Table 65: Global Neuroprosthetics Industry Revenue Million Forecast, by Technique 2019 & 2032
- Table 66: Global Neuroprosthetics Industry Volume K Unit Forecast, by Technique 2019 & 2032
- Table 67: Global Neuroprosthetics Industry Revenue Million Forecast, by Application 2019 & 2032
- Table 68: Global Neuroprosthetics Industry Volume K Unit Forecast, by Application 2019 & 2032
- Table 69: Global Neuroprosthetics Industry Revenue Million Forecast, by Country 2019 & 2032
- Table 70: Global Neuroprosthetics Industry Volume K Unit Forecast, by Country 2019 & 2032
- Table 71: United States Neuroprosthetics Industry Revenue (Million) Forecast, by Application 2019 & 2032
- Table 72: United States Neuroprosthetics Industry Volume (K Unit) Forecast, by Application 2019 & 2032
- Table 73: Canada Neuroprosthetics Industry Revenue (Million) Forecast, by Application 2019 & 2032
- Table 74: Canada Neuroprosthetics Industry Volume (K Unit) Forecast, by Application 2019 & 2032
- Table 75: Mexico Neuroprosthetics Industry Revenue (Million) Forecast, by Application 2019 & 2032
- Table 76: Mexico Neuroprosthetics Industry Volume (K Unit) Forecast, by Application 2019 & 2032
- Table 77: Global Neuroprosthetics Industry Revenue Million Forecast, by Type 2019 & 2032
- Table 78: Global Neuroprosthetics Industry Volume K Unit Forecast, by Type 2019 & 2032
- Table 79: Global Neuroprosthetics Industry Revenue Million Forecast, by Technique 2019 & 2032
- Table 80: Global Neuroprosthetics Industry Volume K Unit Forecast, by Technique 2019 & 2032
- Table 81: Global Neuroprosthetics Industry Revenue Million Forecast, by Application 2019 & 2032
- Table 82: Global Neuroprosthetics Industry Volume K Unit Forecast, by Application 2019 & 2032
- Table 83: Global Neuroprosthetics Industry Revenue Million Forecast, by Country 2019 & 2032
- Table 84: Global Neuroprosthetics Industry Volume K Unit Forecast, by Country 2019 & 2032
- Table 85: Germany Neuroprosthetics Industry Revenue (Million) Forecast, by Application 2019 & 2032
- Table 86: Germany Neuroprosthetics Industry Volume (K Unit) Forecast, by Application 2019 & 2032
- Table 87: United Kingdom Neuroprosthetics Industry Revenue (Million) Forecast, by Application 2019 & 2032
- Table 88: United Kingdom Neuroprosthetics Industry Volume (K Unit) Forecast, by Application 2019 & 2032
- Table 89: France Neuroprosthetics Industry Revenue (Million) Forecast, by Application 2019 & 2032
- Table 90: France Neuroprosthetics Industry Volume (K Unit) Forecast, by Application 2019 & 2032
- Table 91: Italy Neuroprosthetics Industry Revenue (Million) Forecast, by Application 2019 & 2032
- Table 92: Italy Neuroprosthetics Industry Volume (K Unit) Forecast, by Application 2019 & 2032
- Table 93: Spain Neuroprosthetics Industry Revenue (Million) Forecast, by Application 2019 & 2032
- Table 94: Spain Neuroprosthetics Industry Volume (K Unit) Forecast, by Application 2019 & 2032
- Table 95: Rest of Europe Neuroprosthetics Industry Revenue (Million) Forecast, by Application 2019 & 2032
- Table 96: Rest of Europe Neuroprosthetics Industry Volume (K Unit) Forecast, by Application 2019 & 2032
- Table 97: Global Neuroprosthetics Industry Revenue Million Forecast, by Type 2019 & 2032
- Table 98: Global Neuroprosthetics Industry Volume K Unit Forecast, by Type 2019 & 2032
- Table 99: Global Neuroprosthetics Industry Revenue Million Forecast, by Technique 2019 & 2032
- Table 100: Global Neuroprosthetics Industry Volume K Unit Forecast, by Technique 2019 & 2032
- Table 101: Global Neuroprosthetics Industry Revenue Million Forecast, by Application 2019 & 2032
- Table 102: Global Neuroprosthetics Industry Volume K Unit Forecast, by Application 2019 & 2032
- Table 103: Global Neuroprosthetics Industry Revenue Million Forecast, by Country 2019 & 2032
- Table 104: Global Neuroprosthetics Industry Volume K Unit Forecast, by Country 2019 & 2032
- Table 105: China Neuroprosthetics Industry Revenue (Million) Forecast, by Application 2019 & 2032
- Table 106: China Neuroprosthetics Industry Volume (K Unit) Forecast, by Application 2019 & 2032
- Table 107: Japan Neuroprosthetics Industry Revenue (Million) Forecast, by Application 2019 & 2032
- Table 108: Japan Neuroprosthetics Industry Volume (K Unit) Forecast, by Application 2019 & 2032
- Table 109: India Neuroprosthetics Industry Revenue (Million) Forecast, by Application 2019 & 2032
- Table 110: India Neuroprosthetics Industry Volume (K Unit) Forecast, by Application 2019 & 2032
- Table 111: Australia Neuroprosthetics Industry Revenue (Million) Forecast, by Application 2019 & 2032
- Table 112: Australia Neuroprosthetics Industry Volume (K Unit) Forecast, by Application 2019 & 2032
- Table 113: South Korea Neuroprosthetics Industry Revenue (Million) Forecast, by Application 2019 & 2032
- Table 114: South Korea Neuroprosthetics Industry Volume (K Unit) Forecast, by Application 2019 & 2032
- Table 115: Rest of Asia Pacific Neuroprosthetics Industry Revenue (Million) Forecast, by Application 2019 & 2032
- Table 116: Rest of Asia Pacific Neuroprosthetics Industry Volume (K Unit) Forecast, by Application 2019 & 2032
- Table 117: Global Neuroprosthetics Industry Revenue Million Forecast, by Type 2019 & 2032
- Table 118: Global Neuroprosthetics Industry Volume K Unit Forecast, by Type 2019 & 2032
- Table 119: Global Neuroprosthetics Industry Revenue Million Forecast, by Technique 2019 & 2032
- Table 120: Global Neuroprosthetics Industry Volume K Unit Forecast, by Technique 2019 & 2032
- Table 121: Global Neuroprosthetics Industry Revenue Million Forecast, by Application 2019 & 2032
- Table 122: Global Neuroprosthetics Industry Volume K Unit Forecast, by Application 2019 & 2032
- Table 123: Global Neuroprosthetics Industry Revenue Million Forecast, by Country 2019 & 2032
- Table 124: Global Neuroprosthetics Industry Volume K Unit Forecast, by Country 2019 & 2032
- Table 125: GCC Neuroprosthetics Industry Revenue (Million) Forecast, by Application 2019 & 2032
- Table 126: GCC Neuroprosthetics Industry Volume (K Unit) Forecast, by Application 2019 & 2032
- Table 127: South Africa Neuroprosthetics Industry Revenue (Million) Forecast, by Application 2019 & 2032
- Table 128: South Africa Neuroprosthetics Industry Volume (K Unit) Forecast, by Application 2019 & 2032
- Table 129: Rest of Middle East and Africa Neuroprosthetics Industry Revenue (Million) Forecast, by Application 2019 & 2032
- Table 130: Rest of Middle East and Africa Neuroprosthetics Industry Volume (K Unit) Forecast, by Application 2019 & 2032
- Table 131: Global Neuroprosthetics Industry Revenue Million Forecast, by Type 2019 & 2032
- Table 132: Global Neuroprosthetics Industry Volume K Unit Forecast, by Type 2019 & 2032
- Table 133: Global Neuroprosthetics Industry Revenue Million Forecast, by Technique 2019 & 2032
- Table 134: Global Neuroprosthetics Industry Volume K Unit Forecast, by Technique 2019 & 2032
- Table 135: Global Neuroprosthetics Industry Revenue Million Forecast, by Application 2019 & 2032
- Table 136: Global Neuroprosthetics Industry Volume K Unit Forecast, by Application 2019 & 2032
- Table 137: Global Neuroprosthetics Industry Revenue Million Forecast, by Country 2019 & 2032
- Table 138: Global Neuroprosthetics Industry Volume K Unit Forecast, by Country 2019 & 2032
- Table 139: Brazil Neuroprosthetics Industry Revenue (Million) Forecast, by Application 2019 & 2032
- Table 140: Brazil Neuroprosthetics Industry Volume (K Unit) Forecast, by Application 2019 & 2032
- Table 141: Argentina Neuroprosthetics Industry Revenue (Million) Forecast, by Application 2019 & 2032
- Table 142: Argentina Neuroprosthetics Industry Volume (K Unit) Forecast, by Application 2019 & 2032
- Table 143: Rest of South America Neuroprosthetics Industry Revenue (Million) Forecast, by Application 2019 & 2032
- Table 144: Rest of South America Neuroprosthetics Industry Volume (K Unit) Forecast, by Application 2019 & 2032
Frequently Asked Questions
1. What is the projected Compound Annual Growth Rate (CAGR) of the Neuroprosthetics Industry?
The projected CAGR is approximately 11.83%.
2. Which companies are prominent players in the Neuroprosthetics Industry?
Key companies in the market include MED-EL Medical Electronics, Cyberonics Inc, Abbott Laboratories, Medtronic PLC, Sonova Holding AG, LivaNova PLC, Demant AS, Boston Scientific Corporation, Second Sight, Cochlear Limited, BrainGate.
3. What are the main segments of the Neuroprosthetics Industry?
The market segments include Type, Technique, Application.
4. Can you provide details about the market size?
The market size is estimated to be USD 12.01 Million as of 2022.
5. What are some drivers contributing to market growth?
Increasing Number of Patients Suffering from Neurological Disorders and Nerve Injury; Growing Burden of Hearing Loss and Related Defects.
6. What are the notable trends driving market growth?
The Input Neural Prosthetics Segment is Expected to Show a Significant Growth Over the Forecast Period.
7. Are there any restraints impacting market growth?
Availability of Alternative Treatment Options; High Cost of Neuroprosthetics.
8. Can you provide examples of recent developments in the market?
In December 2022, the Government of Saskatchewan through the Ministry of Health and the Saskatchewan Health Authority (SHA), implemented the expanded Cochlear Implant Program to help those who need their external sound processor replaced. Under the new program, individuals will co-pay USD 840 per implant with the Ministry of Health covering the remainder of the cost, which is often USD 8,000 to USD 12,000.
9. What pricing options are available for accessing the report?
Pricing options include single-user, multi-user, and enterprise licenses priced at USD 4750, USD 5250, and USD 8750 respectively.
10. Is the market size provided in terms of value or volume?
The market size is provided in terms of value, measured in Million and volume, measured in K Unit.
11. Are there any specific market keywords associated with the report?
Yes, the market keyword associated with the report is "Neuroprosthetics Industry," which aids in identifying and referencing the specific market segment covered.
12. How do I determine which pricing option suits my needs best?
The pricing options vary based on user requirements and access needs. Individual users may opt for single-user licenses, while businesses requiring broader access may choose multi-user or enterprise licenses for cost-effective access to the report.
13. Are there any additional resources or data provided in the Neuroprosthetics Industry report?
While the report offers comprehensive insights, it's advisable to review the specific contents or supplementary materials provided to ascertain if additional resources or data are available.
14. How can I stay updated on further developments or reports in the Neuroprosthetics Industry?
To stay informed about further developments, trends, and reports in the Neuroprosthetics Industry, consider subscribing to industry newsletters, following relevant companies and organizations, or regularly checking reputable industry news sources and publications.
Methodology
Step 1 - Identification of Relevant Samples Size from Population Database


Step 2 - Approaches for Defining Global Market Size (Value, Volume* & Price*)

Note*: In applicable scenarios
Step 3 - Data Sources
Primary Research
- Web Analytics
- Survey Reports
- Research Institute
- Latest Research Reports
- Opinion Leaders
Secondary Research
- Annual Reports
- White Paper
- Latest Press Release
- Industry Association
- Paid Database
- Investor Presentations

Step 4 - Data Triangulation
Involves using different sources of information in order to increase the validity of a study
These sources are likely to be stakeholders in a program - participants, other researchers, program staff, other community members, and so on.
Then we put all data in single framework & apply various statistical tools to find out the dynamic on the market.
During the analysis stage, feedback from the stakeholder groups would be compared to determine areas of agreement as well as areas of divergence
