

Key Insights
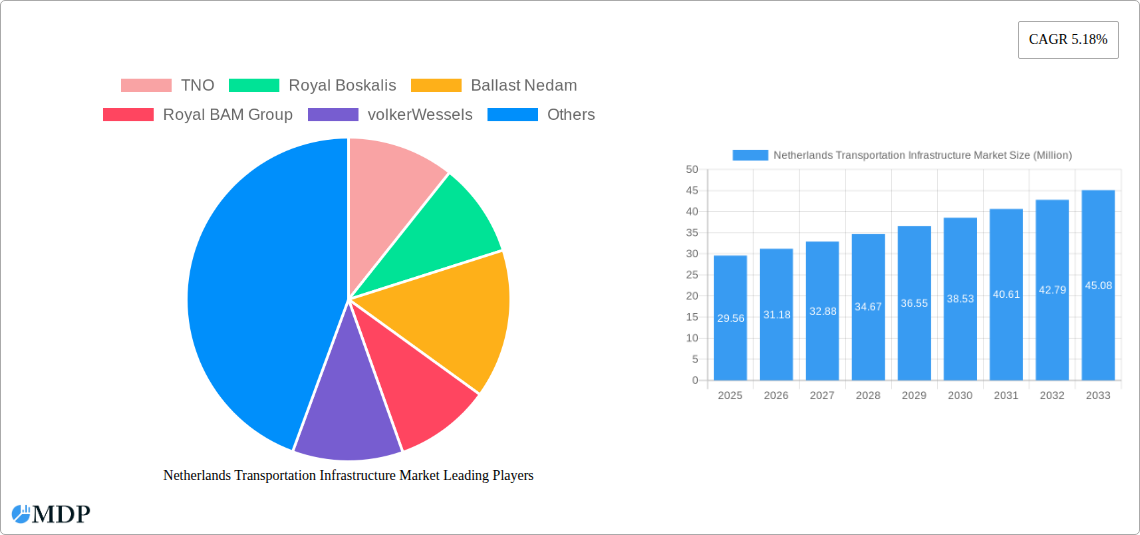
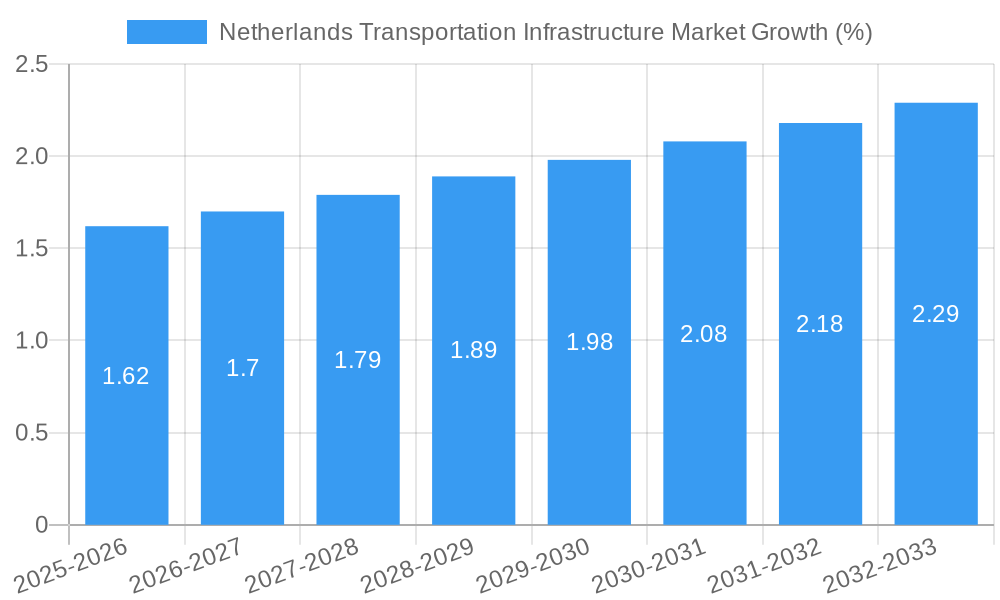
The Netherlands Transportation Infrastructure market, valued at €29.56 million in 2025, is projected to experience robust growth, exhibiting a Compound Annual Growth Rate (CAGR) of 5.18% from 2025 to 2033. This expansion is driven by several key factors. Firstly, the Netherlands' commitment to sustainable transportation, including significant investments in rail infrastructure upgrades and the expansion of cycling networks, is a major catalyst. Secondly, increasing urbanization and population growth necessitate continuous improvements to road networks and port capacity to manage traffic congestion and accommodate growing freight volumes. Furthermore, the country's strategic geographical location as a major European trade hub fuels demand for efficient and reliable port infrastructure and intermodal connectivity. Government initiatives promoting public-private partnerships and innovative construction techniques further contribute to market expansion. Competitive pressures from established players like TNO, Royal Boskalis, and Ballast Nedam alongside the emergence of new players fosters innovation and efficiency gains within the sector.
However, the market faces certain challenges. Material costs volatility and potential labor shortages could impact project timelines and overall costs. Moreover, obtaining necessary permits and navigating complex regulatory frameworks can introduce delays and uncertainties. Environmental concerns related to construction activities and the long-term environmental impact of infrastructure projects necessitate sustainable solutions and stricter adherence to environmental regulations. Despite these constraints, the strong underlying growth drivers and government support suggest a positive outlook for the Netherlands Transportation Infrastructure market throughout the forecast period, with substantial opportunities for market participants. The segment breakdown, showing contributions from roadways, railways, airways, ports and inland waterways, reveals a diverse market with potential for growth across all segments.
Netherlands Transportation Infrastructure Market: A Comprehensive Report (2019-2033)
This in-depth report provides a comprehensive analysis of the Netherlands Transportation Infrastructure Market, encompassing market dynamics, industry trends, leading segments, key players, and future growth prospects. With a focus on the period 2019-2033, including a base year of 2025 and a forecast period of 2025-2033, this report is an essential resource for industry stakeholders, investors, and policymakers. The market is valued at xx Million in 2025 and is projected to reach xx Million by 2033.
Netherlands Transportation Infrastructure Market Market Dynamics & Concentration
The Netherlands transportation infrastructure market exhibits a moderately concentrated landscape, with several large players holding significant market share. However, the presence of numerous smaller, specialized firms contributes to competitive intensity. Innovation is driven by government initiatives promoting sustainable transportation, digitalization, and resilience against climate change. Stringent regulatory frameworks, including environmental standards and safety regulations, shape market dynamics. Product substitutes, such as cycling infrastructure and improved public transport, are gaining traction, influencing market growth. End-user trends reflect a growing preference for efficient, sustainable, and integrated transport systems. M&A activity within the sector has remained relatively consistent, with xx major deals recorded between 2019 and 2024.
- Market Concentration: The top five players account for approximately xx% of the market share in 2025.
- Innovation Drivers: Government funding for R&D in sustainable technologies, smart infrastructure, and autonomous vehicles.
- Regulatory Framework: Strict environmental regulations, safety standards, and licensing requirements influence investment decisions.
- Product Substitutes: Increased investment in cycling infrastructure and public transport, impacting demand for private road transport.
- End-User Trends: Growing demand for integrated, multimodal transport solutions and emphasis on sustainability.
- M&A Activity: An average of xx M&A deals per year between 2019 and 2024, driven by expansion strategies and consolidation.
Netherlands Transportation Infrastructure Market Industry Trends & Analysis
The Netherlands transportation infrastructure market is characterized by steady growth, driven by factors such as increasing urbanization, rising freight volumes, and government investments in infrastructure development. The market is experiencing significant technological disruptions, with the adoption of smart technologies, automation, and sustainable materials gaining momentum. Consumer preferences are increasingly focused on environmentally friendly transport options and improved connectivity. Competitive dynamics are shaped by technological innovation, pricing strategies, and the pursuit of sustainable practices. The CAGR for the market is estimated at xx% during the forecast period (2025-2033). Market penetration of sustainable technologies, such as electric vehicles and hydrogen-powered equipment, is gradually increasing.
Leading Markets & Segments in Netherlands Transportation Infrastructure Market
The roadways segment dominates the Netherlands transportation infrastructure market, driven by the extensive road network and high volumes of vehicular traffic. However, significant investments are being made in railway infrastructure to enhance intercity and regional connectivity. Airways and ports, while representing smaller market segments, are crucial for international trade and tourism. Inland waterways contribute significantly to the logistics sector.
- Roadways:
- Key Drivers: High vehicle ownership rates, increasing freight transportation, government investment in highway expansion and maintenance.
- Railways:
- Key Drivers: Government initiatives to promote rail travel, investments in high-speed rail connections, and efforts to improve intermodal connectivity.
- Airways:
- Key Drivers: Major airports as international hubs, significant contribution to tourism and international trade, ongoing investments in airport infrastructure.
- Ports & Inland Waterways:
- Key Drivers: Strategic location of Rotterdam port as a major European hub, strong logistical network, investment in waterway maintenance and expansion.
Netherlands Transportation Infrastructure Market Product Developments
Recent product innovations focus on sustainable and smart technologies. The adoption of electric and hydrogen-powered vehicles within the construction industry, as demonstrated by Dura Vermeer’s acquisition of hydrogen trucks, signifies a shift towards greener solutions. Smart infrastructure solutions, including intelligent traffic management systems and sensor-based monitoring, are enhancing efficiency and safety. These developments offer competitive advantages through improved operational efficiency, reduced environmental impact, and enhanced customer satisfaction.
Key Drivers of Netherlands Transportation Infrastructure Market Growth
Several factors are driving market growth, including:
- Government Investments: Substantial government spending on infrastructure development, modernization, and sustainability initiatives.
- Technological Advancements: Adoption of smart technologies, automation, and sustainable materials in construction and operation.
- Economic Growth: Steady economic growth and increasing freight transportation needs fuel infrastructure demands.
- Sustainable Transportation Policies: Government policies promoting sustainable transport options (e.g., electric vehicles, cycling).
Challenges in the Netherlands Transportation Infrastructure Market Market
The market faces several challenges, including:
- Funding Constraints: Securing sufficient funding for large-scale infrastructure projects, especially in the face of competing government priorities.
- Environmental Regulations: Meeting stringent environmental regulations while maintaining cost-effectiveness and project timelines.
- Supply Chain Disruptions: Global supply chain issues impacting the availability and cost of construction materials.
- Public Opposition: Dealing with potential public opposition to new infrastructure projects due to environmental concerns or community disruption.
Emerging Opportunities in Netherlands Transportation Infrastructure Market
Long-term growth is driven by:
- Smart City Initiatives: Growing integration of smart technologies in urban transportation systems, creating opportunities for innovative solutions.
- Sustainable Infrastructure Development: Shift towards sustainable materials, electric vehicles, and green technologies within the construction industry.
- Public-Private Partnerships: Increased collaboration between public and private sectors to finance and implement large-scale infrastructure projects.
- Expansion of Multimodal Transport: Investments in intermodal transport systems to improve efficiency and connectivity across different modes of transportation.
Leading Players in the Netherlands Transportation Infrastructure Market Sector
- TNO
- Royal Boskalis Westminster
- Ballast Nedam
- Royal BAM Group
- VolkerWessels
- AVG Infra
- Dura Vermeer
- BESIX
- Actividades de Construccion y Servicios SA
- Heijmans
Key Milestones in Netherlands Transportation Infrastructure Market Industry
- September 2022: Dura Vermeer received an order for one of the first three hydrogen trucks for use in road construction projects, aligning with their "Emissions to 0" sustainability ambition.
- March 2023: The consortium De Groene Waarden (BESIX, Mobilis, Van Gelder, Mourik Infra, and BESIX Infra Nederland) was provisionally awarded the contract for the renewal and widening of the A27 highway between Houten and Everdingen.
Strategic Outlook for Netherlands Transportation Infrastructure Market Market
The Netherlands transportation infrastructure market presents significant long-term growth potential, driven by ongoing government investments, technological advancements, and the increasing focus on sustainability. Strategic partnerships, technological innovation, and proactive adaptation to changing regulatory landscapes will be crucial for success in this dynamic market. The market's future growth will be heavily influenced by the country’s continued commitment to sustainable transportation and smart infrastructure development.
Netherlands Transportation Infrastructure Market Segmentation
-
1. Mode
- 1.1. Roadways
- 1.2. Railways
- 1.3. Airways
- 1.4. Ports and Inland Waterways
Netherlands Transportation Infrastructure Market Segmentation By Geography
- 1. Netherlands
Netherlands Transportation Infrastructure Market REPORT HIGHLIGHTS
| Aspects | Details |
|---|---|
| Study Period | 2019-2033 |
| Base Year | 2024 |
| Estimated Year | 2025 |
| Forecast Period | 2025-2033 |
| Historical Period | 2019-2024 |
| Growth Rate | CAGR of 5.18% from 2019-2033 |
| Segmentation |
|
Table of Contents
- 1. Introduction
- 1.1. Research Scope
- 1.2. Market Segmentation
- 1.3. Research Methodology
- 1.4. Definitions and Assumptions
- 2. Executive Summary
- 2.1. Introduction
- 3. Market Dynamics
- 3.1. Introduction
- 3.2. Market Drivers
- 3.2.1. Demand for Transportation Infrastructure is increasing in Netherlands; Growth in Travel and Tourism is driving the need for Transportation Infrastructure.
- 3.3. Market Restrains
- 3.3.1. High cost of the construction projects; Limited space availability for new projects
- 3.4. Market Trends
- 3.4.1. Increasing Demand for Transportation Infrastructure
- 4. Market Factor Analysis
- 4.1. Porters Five Forces
- 4.2. Supply/Value Chain
- 4.3. PESTEL analysis
- 4.4. Market Entropy
- 4.5. Patent/Trademark Analysis
- 5. Netherlands Transportation Infrastructure Market Analysis, Insights and Forecast, 2019-2031
- 5.1. Market Analysis, Insights and Forecast - by Mode
- 5.1.1. Roadways
- 5.1.2. Railways
- 5.1.3. Airways
- 5.1.4. Ports and Inland Waterways
- 5.2. Market Analysis, Insights and Forecast - by Region
- 5.2.1. Netherlands
- 5.1. Market Analysis, Insights and Forecast - by Mode
- 6. Competitive Analysis
- 6.1. Market Share Analysis 2024
- 6.2. Company Profiles
- 6.2.1 TNO
- 6.2.1.1. Overview
- 6.2.1.2. Products
- 6.2.1.3. SWOT Analysis
- 6.2.1.4. Recent Developments
- 6.2.1.5. Financials (Based on Availability)
- 6.2.2 Royal Boskalis
- 6.2.2.1. Overview
- 6.2.2.2. Products
- 6.2.2.3. SWOT Analysis
- 6.2.2.4. Recent Developments
- 6.2.2.5. Financials (Based on Availability)
- 6.2.3 Ballast Nedam
- 6.2.3.1. Overview
- 6.2.3.2. Products
- 6.2.3.3. SWOT Analysis
- 6.2.3.4. Recent Developments
- 6.2.3.5. Financials (Based on Availability)
- 6.2.4 Royal BAM Group
- 6.2.4.1. Overview
- 6.2.4.2. Products
- 6.2.4.3. SWOT Analysis
- 6.2.4.4. Recent Developments
- 6.2.4.5. Financials (Based on Availability)
- 6.2.5 volkerWessels
- 6.2.5.1. Overview
- 6.2.5.2. Products
- 6.2.5.3. SWOT Analysis
- 6.2.5.4. Recent Developments
- 6.2.5.5. Financials (Based on Availability)
- 6.2.6 AVG Infra
- 6.2.6.1. Overview
- 6.2.6.2. Products
- 6.2.6.3. SWOT Analysis
- 6.2.6.4. Recent Developments
- 6.2.6.5. Financials (Based on Availability)
- 6.2.7 Dura Vermeer
- 6.2.7.1. Overview
- 6.2.7.2. Products
- 6.2.7.3. SWOT Analysis
- 6.2.7.4. Recent Developments
- 6.2.7.5. Financials (Based on Availability)
- 6.2.8 BESIX
- 6.2.8.1. Overview
- 6.2.8.2. Products
- 6.2.8.3. SWOT Analysis
- 6.2.8.4. Recent Developments
- 6.2.8.5. Financials (Based on Availability)
- 6.2.9 Actividades de Construccion y Servicios SA**List Not Exhaustive
- 6.2.9.1. Overview
- 6.2.9.2. Products
- 6.2.9.3. SWOT Analysis
- 6.2.9.4. Recent Developments
- 6.2.9.5. Financials (Based on Availability)
- 6.2.10 Heijmans
- 6.2.10.1. Overview
- 6.2.10.2. Products
- 6.2.10.3. SWOT Analysis
- 6.2.10.4. Recent Developments
- 6.2.10.5. Financials (Based on Availability)
- 6.2.1 TNO
List of Figures
- Figure 1: Netherlands Transportation Infrastructure Market Revenue Breakdown (Million, %) by Product 2024 & 2032
- Figure 2: Netherlands Transportation Infrastructure Market Share (%) by Company 2024
List of Tables
- Table 1: Netherlands Transportation Infrastructure Market Revenue Million Forecast, by Region 2019 & 2032
- Table 2: Netherlands Transportation Infrastructure Market Revenue Million Forecast, by Mode 2019 & 2032
- Table 3: Netherlands Transportation Infrastructure Market Revenue Million Forecast, by Region 2019 & 2032
- Table 4: Netherlands Transportation Infrastructure Market Revenue Million Forecast, by Country 2019 & 2032
- Table 5: Netherlands Transportation Infrastructure Market Revenue Million Forecast, by Mode 2019 & 2032
- Table 6: Netherlands Transportation Infrastructure Market Revenue Million Forecast, by Country 2019 & 2032
Frequently Asked Questions
1. What is the projected Compound Annual Growth Rate (CAGR) of the Netherlands Transportation Infrastructure Market?
The projected CAGR is approximately 5.18%.
2. Which companies are prominent players in the Netherlands Transportation Infrastructure Market?
Key companies in the market include TNO, Royal Boskalis, Ballast Nedam, Royal BAM Group, volkerWessels, AVG Infra, Dura Vermeer, BESIX, Actividades de Construccion y Servicios SA**List Not Exhaustive, Heijmans.
3. What are the main segments of the Netherlands Transportation Infrastructure Market?
The market segments include Mode.
4. Can you provide details about the market size?
The market size is estimated to be USD 29.56 Million as of 2022.
5. What are some drivers contributing to market growth?
Demand for Transportation Infrastructure is increasing in Netherlands; Growth in Travel and Tourism is driving the need for Transportation Infrastructure..
6. What are the notable trends driving market growth?
Increasing Demand for Transportation Infrastructure.
7. Are there any restraints impacting market growth?
High cost of the construction projects; Limited space availability for new projects.
8. Can you provide examples of recent developments in the market?
September 2022: Dura Vermeer received order of one of the first three hydrogen trucks. The trucks will be used in various road construction projects in the Netherlands. The trucks refuel with hydrogen and can drive approximately 520 kilometers on a single fill-up. The hydrogen is converted into electricity in the vehicle by a so-called fuel cell. The emissions contain only water vapor and there is no air pollution by substances such as carbon monoxide, nitrogen oxides or particulate matter. One of Dura Vermeer's sustainability ambitions is "Emissions to 0". For this reason, electrical equipment is used on all projects, if available. For example, the company is working towards an emission-free construction site in 2025. The use of the new hydrogen truck is a great step in realizing this ambition.
9. What pricing options are available for accessing the report?
Pricing options include single-user, multi-user, and enterprise licenses priced at USD 3800, USD 4500, and USD 5800 respectively.
10. Is the market size provided in terms of value or volume?
The market size is provided in terms of value, measured in Million.
11. Are there any specific market keywords associated with the report?
Yes, the market keyword associated with the report is "Netherlands Transportation Infrastructure Market," which aids in identifying and referencing the specific market segment covered.
12. How do I determine which pricing option suits my needs best?
The pricing options vary based on user requirements and access needs. Individual users may opt for single-user licenses, while businesses requiring broader access may choose multi-user or enterprise licenses for cost-effective access to the report.
13. Are there any additional resources or data provided in the Netherlands Transportation Infrastructure Market report?
While the report offers comprehensive insights, it's advisable to review the specific contents or supplementary materials provided to ascertain if additional resources or data are available.
14. How can I stay updated on further developments or reports in the Netherlands Transportation Infrastructure Market?
To stay informed about further developments, trends, and reports in the Netherlands Transportation Infrastructure Market, consider subscribing to industry newsletters, following relevant companies and organizations, or regularly checking reputable industry news sources and publications.
Methodology
Step 1 - Identification of Relevant Samples Size from Population Database


Step 2 - Approaches for Defining Global Market Size (Value, Volume* & Price*)

Note*: In applicable scenarios
Step 3 - Data Sources
Primary Research
- Web Analytics
- Survey Reports
- Research Institute
- Latest Research Reports
- Opinion Leaders
Secondary Research
- Annual Reports
- White Paper
- Latest Press Release
- Industry Association
- Paid Database
- Investor Presentations

Step 4 - Data Triangulation
Involves using different sources of information in order to increase the validity of a study
These sources are likely to be stakeholders in a program - participants, other researchers, program staff, other community members, and so on.
Then we put all data in single framework & apply various statistical tools to find out the dynamic on the market.
During the analysis stage, feedback from the stakeholder groups would be compared to determine areas of agreement as well as areas of divergence
