

Key Insights
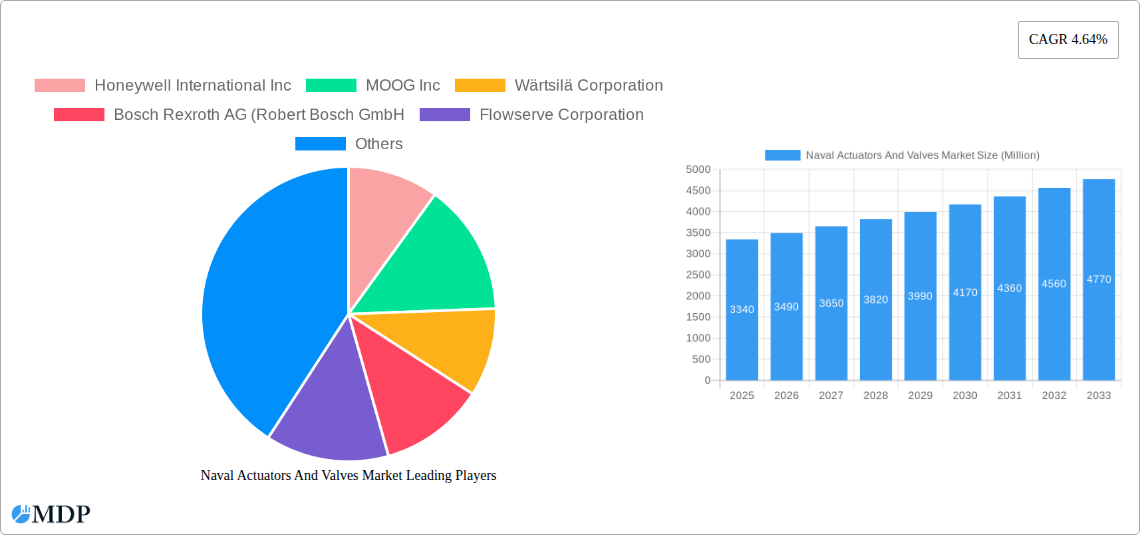
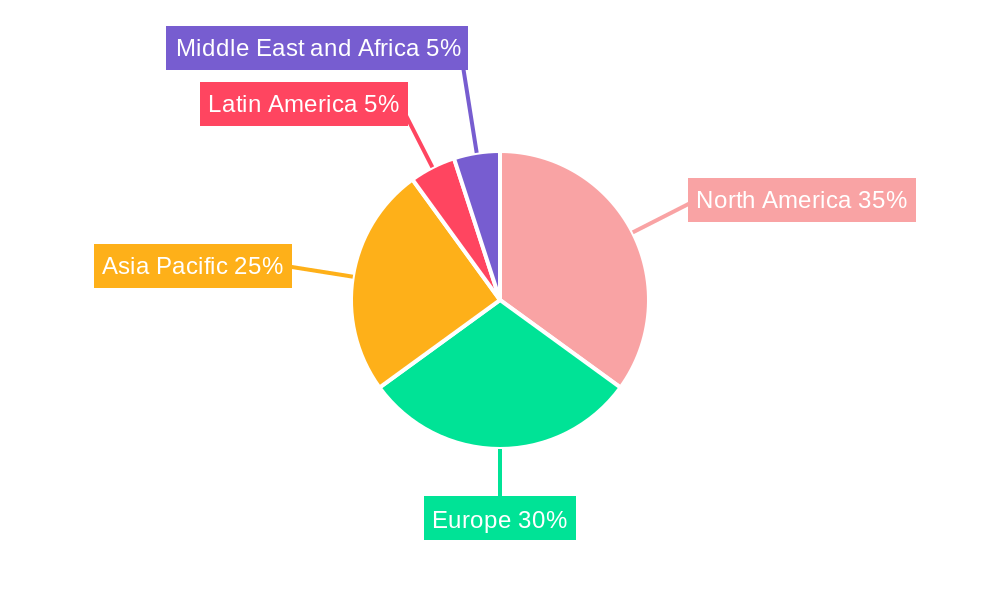
The Naval Actuators and Valves market, valued at $3.34 billion in 2025, is projected to experience robust growth, driven by increasing naval modernization programs globally and the rising demand for advanced automation in naval vessels. A Compound Annual Growth Rate (CAGR) of 4.64% from 2025 to 2033 indicates a significant market expansion. Key growth drivers include the integration of sophisticated control systems, increasing focus on improving vessel efficiency and operational reliability, and the growing adoption of electric and hybrid propulsion systems, which require advanced actuators and valves. Market segmentation reveals a preference for aluminum and stainless steel materials due to their corrosion resistance and lightweight properties. The demand for electrical and hybrid actuator types is growing, reflecting the shift towards more energy-efficient and technologically advanced naval systems. Geographically, North America and Europe currently hold significant market shares, driven by strong defense budgets and a large installed base of naval vessels. However, the Asia-Pacific region is expected to witness substantial growth in the forecast period due to increased defense spending and naval shipbuilding activities in countries like China, India, and South Korea. The market faces some restraints, including the high initial investment costs associated with advanced actuator and valve technologies, and the stringent regulatory requirements surrounding their deployment in naval applications. Nevertheless, the long-term outlook for the Naval Actuators and Valves market remains positive, driven by continued technological advancements and sustained investment in naval modernization.
The competitive landscape is characterized by a mix of established players like Honeywell International Inc., MOOG Inc., and Wärtsilä Corporation, along with regional players. These companies are focusing on R&D to develop advanced technologies, expand their product portfolios, and secure lucrative contracts from navies worldwide. Strategic partnerships, mergers and acquisitions are also expected to shape the market dynamics in the coming years. The market will also see innovations in materials science and control systems further enhancing the performance and reliability of naval actuators and valves. The market's evolution will be closely tied to geopolitical factors, technological breakthroughs, and the evolving needs of the global naval fleet. The forecast suggests a continued upward trajectory, promising substantial growth opportunities for market participants.
Dive Deep into the Naval Actuators and Valves Market: A Comprehensive Report (2019-2033)
This in-depth report offers a comprehensive analysis of the global Naval Actuators and Valves Market, providing crucial insights for stakeholders across the defense, commercial, and industrial sectors. Covering the period from 2019 to 2033, with a focus on 2025, this report unveils market dynamics, trends, leading players, and future opportunities. Expect detailed segmentation analysis across materials (Aluminum, Stainless Steel, Alloy-based), actuator types (Mechanical, Hydraulic, Pneumatic, Electrical, Hybrid), and platforms (Defense, Commercial), revealing significant growth areas and potential investment avenues. The report's data-driven approach, incorporating CAGR projections and market share breakdowns, makes it an indispensable resource for informed decision-making. The market is projected to reach xx Million by 2033.
Naval Actuators And Valves Market Market Dynamics & Concentration
This section meticulously examines the competitive landscape of the naval actuators and valves market. We analyze market concentration through metrics like the Herfindahl-Hirschman Index (HHI) and market share held by key players such as Honeywell International Inc, MOOG Inc, Wärtsilä Corporation, Bosch Rexroth AG, Flowserve Corporation, Rotork PLC, Diakont, Emerson Electric Co, Curtiss-Wright Corporation, Schlumberger Limited, IMI PLC, and AUMA Riester GmbH & Co KG. The report also delves into innovation drivers, including advancements in automation and materials science, regulatory frameworks impacting safety and environmental compliance, and the presence of substitute products and their impact on market share. Further analysis encompasses end-user trends, like the increasing demand for advanced actuators in modern naval vessels, and a detailed overview of recent mergers and acquisitions (M&A) activities within the sector, including the number of deals and their financial implications. For example, the increasing adoption of hybrid actuators is expected to increase the market share of relevant companies by xx% by 2033. The analysis also considers the impact of geopolitical factors and the fluctuating prices of raw materials on the market dynamics. The increasing focus on automation in naval vessels is expected to drive the market growth by xx million between 2025 and 2033.
Naval Actuators And Valves Market Industry Trends & Analysis
This section presents a thorough analysis of the key trends shaping the naval actuators and valves market. We will explore the market's Compound Annual Growth Rate (CAGR) during the forecast period (2025-2033) and its market penetration across various segments. We will examine growth drivers, including rising defense budgets, increasing demand for sophisticated naval vessels, and technological advancements leading to higher efficiency and reliability of actuators and valves. We also analyze technological disruptions such as the integration of smart technologies and the adoption of predictive maintenance solutions, how consumer preferences (i.e., naval contractors and shipbuilders) are impacting demand, and the competitive dynamics, including pricing strategies and product differentiation among key players. The focus will be on understanding how these factors interplay to influence market growth and future opportunities. The increasing adoption of advanced materials such as alloys is expected to increase the market share of the material segment by xx% by 2033.

Leading Markets & Segments in Naval Actuators And Valves Market
This section identifies the dominant regions, countries, and market segments within the naval actuators and valves market. We provide a detailed analysis of the leading segments by material (Aluminum, Stainless Steel, Alloy-based), actuator type (Mechanical, Hydraulic, Pneumatic, Electrical, Hybrid), and platform (Defense, Commercial).
Dominant Regions/Countries: [Detailed analysis of leading regions and countries, including market size, growth drivers, and reasons for dominance. Examples: Strong defense spending in [Country X], favorable government policies in [Country Y], established manufacturing base in [Region Z].]
Dominant Segments: [Analysis of leading segments, for example, the higher adoption rate of hydraulic actuators in military applications, the preference for aluminum components in commercial vessels due to its weight advantage etc., explaining factors such as cost-effectiveness, performance characteristics, and technological advancements contributing to their dominance. Each segment will be evaluated considering factors such as pricing, performance, and market share]
Material: [Detailed analysis of each material segment, including market share and growth drivers. Example: High demand for stainless steel due to corrosion resistance]
Actuator Type: [Detailed analysis of each actuator type segment, including market share and growth drivers. Example: Growth in demand for electric actuators due to energy efficiency.]
Platform: [Detailed analysis of each platform segment (Defense, Commercial) including market share and growth drivers. Example: High growth in the defense segment driven by modernization programs.]
Naval Actuators And Valves Market Product Developments
This section summarizes recent product innovations, applications, and competitive advantages in the naval actuators and valves market. We will highlight technological trends, such as the miniaturization of actuators, the development of more energy-efficient designs, and the integration of advanced sensors and control systems, and how these trends are shaping market fit and creating new opportunities. Key innovations and their impact on market competitiveness will be discussed. For instance, the introduction of xx technology has improved the efficiency of naval actuators by xx%.
Key Drivers of Naval Actuators And Valves Market Growth
Several key factors are driving the growth of the naval actuators and valves market. These include technological advancements leading to improved performance and reliability, the increasing demand for automated systems in naval vessels, supportive government policies and defense budgets, and the rising adoption of advanced materials and manufacturing processes. Economic factors such as growth in global shipbuilding and the need for modernization of existing naval fleets also contribute to market expansion. For example, the increasing demand for autonomous naval vessels is driving the demand for advanced actuators.
Challenges in the Naval Actuators And Valves Market Market
The naval actuators and valves market faces several challenges including stringent regulatory requirements related to safety and environmental compliance, potential supply chain disruptions, and intense competition among established players and emerging entrants. These factors can impact production costs, delivery timelines, and overall profitability, which needs careful strategic management to mitigate the challenges. The increasing cost of raw materials such as steel and aluminum is expected to impact the market growth by xx%.
Emerging Opportunities in Naval Actuators And Valves Market
Despite existing challenges, the naval actuators and valves market offers significant long-term growth opportunities. Technological breakthroughs like the development of advanced materials with enhanced durability and the integration of artificial intelligence (AI) for predictive maintenance are creating new market segments and application areas. Strategic partnerships and collaborations between manufacturers, research institutions, and naval contractors can accelerate innovation and market expansion. Furthermore, the growing demand for modernization of naval fleets globally opens doors for market expansion into new geographic regions.
Leading Players in the Naval Actuators And Valves Market Sector
- Honeywell International Inc
- MOOG Inc
- Wärtsilä Corporation
- Bosch Rexroth AG (Robert Bosch GmbH)
- Flowserve Corporation
- Rotork PLC
- Diakont
- Emerson Electric Co
- Curtiss-Wright Corporation
- Schlumberger Limited
- IMI PLC
- AUMA Riester GmbH & Co KG
Key Milestones in Naval Actuators And Valves Market Industry
- 2021-Q2: Introduction of a new line of high-efficiency electric actuators by [Company Name].
- 2022-Q4: [Company A] and [Company B] announce a strategic partnership for the development of advanced valve technology.
- 2023-Q1: Successful completion of sea trials for a new type of hybrid actuator.
Strategic Outlook for Naval Actuators And Valves Market Market
The future of the naval actuators and valves market looks promising, driven by continuous technological advancements, increasing defense spending, and the growing demand for advanced naval vessels. Strategic opportunities exist for companies that focus on innovation, strategic partnerships, and expansion into new geographic markets. Focusing on sustainable practices and energy-efficient solutions will become increasingly important. The market is poised for strong growth in the coming decade, and proactive companies will benefit significantly from these opportunities.
Naval Actuators And Valves Market Segmentation
- 1. Production Analysis
- 2. Consumption Analysis
- 3. Import Market Analysis (Value & Volume)
- 4. Export Market Analysis (Value & Volume)
- 5. Price Trend Analysis
Naval Actuators And Valves Market Segmentation By Geography
-
1. North America
- 1.1. United States
- 1.2. Canada
- 1.3. Mexico
-
2. South America
- 2.1. Brazil
- 2.2. Argentina
- 2.3. Rest of South America
-
3. Europe
- 3.1. United Kingdom
- 3.2. Germany
- 3.3. France
- 3.4. Italy
- 3.5. Spain
- 3.6. Russia
- 3.7. Benelux
- 3.8. Nordics
- 3.9. Rest of Europe
-
4. Middle East & Africa
- 4.1. Turkey
- 4.2. Israel
- 4.3. GCC
- 4.4. North Africa
- 4.5. South Africa
- 4.6. Rest of Middle East & Africa
-
5. Asia Pacific
- 5.1. China
- 5.2. India
- 5.3. Japan
- 5.4. South Korea
- 5.5. ASEAN
- 5.6. Oceania
- 5.7. Rest of Asia Pacific
Naval Actuators And Valves Market REPORT HIGHLIGHTS
| Aspects | Details |
|---|---|
| Study Period | 2019-2033 |
| Base Year | 2024 |
| Estimated Year | 2025 |
| Forecast Period | 2025-2033 |
| Historical Period | 2019-2024 |
| Growth Rate | CAGR of 4.64% from 2019-2033 |
| Segmentation |
|
Table of Contents
- 1. Introduction
- 1.1. Research Scope
- 1.2. Market Segmentation
- 1.3. Research Methodology
- 1.4. Definitions and Assumptions
- 2. Executive Summary
- 2.1. Introduction
- 3. Market Dynamics
- 3.1. Introduction
- 3.2. Market Drivers
- 3.2.1. Increase in Internet of Things (IoT) and Autonomous Systems; Rise in Demand for Military and Defense Satellite Communication Solutions
- 3.3. Market Restrains
- 3.3.1. Cybersecurity Threats to Satellite Communication; Interference in Transmission of Data
- 3.4. Market Trends
- 3.4.1. Defense Segment is Expected to Dominate the Market
- 4. Market Factor Analysis
- 4.1. Porters Five Forces
- 4.2. Supply/Value Chain
- 4.3. PESTEL analysis
- 4.4. Market Entropy
- 4.5. Patent/Trademark Analysis
- 5. Global Naval Actuators And Valves Market Analysis, Insights and Forecast, 2019-2031
- 5.1. Market Analysis, Insights and Forecast - by Production Analysis
- 5.2. Market Analysis, Insights and Forecast - by Consumption Analysis
- 5.3. Market Analysis, Insights and Forecast - by Import Market Analysis (Value & Volume)
- 5.4. Market Analysis, Insights and Forecast - by Export Market Analysis (Value & Volume)
- 5.5. Market Analysis, Insights and Forecast - by Price Trend Analysis
- 5.6. Market Analysis, Insights and Forecast - by Region
- 5.6.1. North America
- 5.6.2. South America
- 5.6.3. Europe
- 5.6.4. Middle East & Africa
- 5.6.5. Asia Pacific
- 5.1. Market Analysis, Insights and Forecast - by Production Analysis
- 6. North America Naval Actuators And Valves Market Analysis, Insights and Forecast, 2019-2031
- 6.1. Market Analysis, Insights and Forecast - by Production Analysis
- 6.2. Market Analysis, Insights and Forecast - by Consumption Analysis
- 6.3. Market Analysis, Insights and Forecast - by Import Market Analysis (Value & Volume)
- 6.4. Market Analysis, Insights and Forecast - by Export Market Analysis (Value & Volume)
- 6.5. Market Analysis, Insights and Forecast - by Price Trend Analysis
- 6.1. Market Analysis, Insights and Forecast - by Production Analysis
- 7. South America Naval Actuators And Valves Market Analysis, Insights and Forecast, 2019-2031
- 7.1. Market Analysis, Insights and Forecast - by Production Analysis
- 7.2. Market Analysis, Insights and Forecast - by Consumption Analysis
- 7.3. Market Analysis, Insights and Forecast - by Import Market Analysis (Value & Volume)
- 7.4. Market Analysis, Insights and Forecast - by Export Market Analysis (Value & Volume)
- 7.5. Market Analysis, Insights and Forecast - by Price Trend Analysis
- 7.1. Market Analysis, Insights and Forecast - by Production Analysis
- 8. Europe Naval Actuators And Valves Market Analysis, Insights and Forecast, 2019-2031
- 8.1. Market Analysis, Insights and Forecast - by Production Analysis
- 8.2. Market Analysis, Insights and Forecast - by Consumption Analysis
- 8.3. Market Analysis, Insights and Forecast - by Import Market Analysis (Value & Volume)
- 8.4. Market Analysis, Insights and Forecast - by Export Market Analysis (Value & Volume)
- 8.5. Market Analysis, Insights and Forecast - by Price Trend Analysis
- 8.1. Market Analysis, Insights and Forecast - by Production Analysis
- 9. Middle East & Africa Naval Actuators And Valves Market Analysis, Insights and Forecast, 2019-2031
- 9.1. Market Analysis, Insights and Forecast - by Production Analysis
- 9.2. Market Analysis, Insights and Forecast - by Consumption Analysis
- 9.3. Market Analysis, Insights and Forecast - by Import Market Analysis (Value & Volume)
- 9.4. Market Analysis, Insights and Forecast - by Export Market Analysis (Value & Volume)
- 9.5. Market Analysis, Insights and Forecast - by Price Trend Analysis
- 9.1. Market Analysis, Insights and Forecast - by Production Analysis
- 10. Asia Pacific Naval Actuators And Valves Market Analysis, Insights and Forecast, 2019-2031
- 10.1. Market Analysis, Insights and Forecast - by Production Analysis
- 10.2. Market Analysis, Insights and Forecast - by Consumption Analysis
- 10.3. Market Analysis, Insights and Forecast - by Import Market Analysis (Value & Volume)
- 10.4. Market Analysis, Insights and Forecast - by Export Market Analysis (Value & Volume)
- 10.5. Market Analysis, Insights and Forecast - by Price Trend Analysis
- 10.1. Market Analysis, Insights and Forecast - by Production Analysis
- 11. North America Naval Actuators And Valves Market Analysis, Insights and Forecast, 2019-2031
- 11.1. Market Analysis, Insights and Forecast - By Country/Sub-region
- 11.1.1 United States
- 11.1.2 Canada
- 12. Europe Naval Actuators And Valves Market Analysis, Insights and Forecast, 2019-2031
- 12.1. Market Analysis, Insights and Forecast - By Country/Sub-region
- 12.1.1 Germany
- 12.1.2 United Kingdom
- 12.1.3 France
- 12.1.4 Russia
- 12.1.5 Rest of Europe
- 13. Asia Pacific Naval Actuators And Valves Market Analysis, Insights and Forecast, 2019-2031
- 13.1. Market Analysis, Insights and Forecast - By Country/Sub-region
- 13.1.1 India
- 13.1.2 China
- 13.1.3 Japan
- 13.1.4 South Korea
- 13.1.5 Rest of Asia Pacific
- 14. Latin America Naval Actuators And Valves Market Analysis, Insights and Forecast, 2019-2031
- 14.1. Market Analysis, Insights and Forecast - By Country/Sub-region
- 14.1.1 Mexico
- 14.1.2 Brazil
- 14.1.3 Rest of Latin America
- 15. Middle East and Africa Naval Actuators And Valves Market Analysis, Insights and Forecast, 2019-2031
- 15.1. Market Analysis, Insights and Forecast - By Country/Sub-region
- 15.1.1 United Arab Emirates
- 15.1.2 Saudi Arabia
- 15.1.3 Egypt
- 15.1.4 Israel
- 15.1.5 Rest of Middle East and Africa
- 16. Competitive Analysis
- 16.1. Global Market Share Analysis 2024
- 16.2. Company Profiles
- 16.2.1 Honeywell International Inc
- 16.2.1.1. Overview
- 16.2.1.2. Products
- 16.2.1.3. SWOT Analysis
- 16.2.1.4. Recent Developments
- 16.2.1.5. Financials (Based on Availability)
- 16.2.2 MOOG Inc
- 16.2.2.1. Overview
- 16.2.2.2. Products
- 16.2.2.3. SWOT Analysis
- 16.2.2.4. Recent Developments
- 16.2.2.5. Financials (Based on Availability)
- 16.2.3 Wärtsilä Corporation
- 16.2.3.1. Overview
- 16.2.3.2. Products
- 16.2.3.3. SWOT Analysis
- 16.2.3.4. Recent Developments
- 16.2.3.5. Financials (Based on Availability)
- 16.2.4 Bosch Rexroth AG (Robert Bosch GmbH
- 16.2.4.1. Overview
- 16.2.4.2. Products
- 16.2.4.3. SWOT Analysis
- 16.2.4.4. Recent Developments
- 16.2.4.5. Financials (Based on Availability)
- 16.2.5 Flowserve Corporation
- 16.2.5.1. Overview
- 16.2.5.2. Products
- 16.2.5.3. SWOT Analysis
- 16.2.5.4. Recent Developments
- 16.2.5.5. Financials (Based on Availability)
- 16.2.6 Rotork PLC
- 16.2.6.1. Overview
- 16.2.6.2. Products
- 16.2.6.3. SWOT Analysis
- 16.2.6.4. Recent Developments
- 16.2.6.5. Financials (Based on Availability)
- 16.2.7 Diakont
- 16.2.7.1. Overview
- 16.2.7.2. Products
- 16.2.7.3. SWOT Analysis
- 16.2.7.4. Recent Developments
- 16.2.7.5. Financials (Based on Availability)
- 16.2.8 Emerson Electric Co
- 16.2.8.1. Overview
- 16.2.8.2. Products
- 16.2.8.3. SWOT Analysis
- 16.2.8.4. Recent Developments
- 16.2.8.5. Financials (Based on Availability)
- 16.2.9 Curtiss-Wright Corporation
- 16.2.9.1. Overview
- 16.2.9.2. Products
- 16.2.9.3. SWOT Analysis
- 16.2.9.4. Recent Developments
- 16.2.9.5. Financials (Based on Availability)
- 16.2.10 Schlumberger Limited
- 16.2.10.1. Overview
- 16.2.10.2. Products
- 16.2.10.3. SWOT Analysis
- 16.2.10.4. Recent Developments
- 16.2.10.5. Financials (Based on Availability)
- 16.2.11 IMI PLC
- 16.2.11.1. Overview
- 16.2.11.2. Products
- 16.2.11.3. SWOT Analysis
- 16.2.11.4. Recent Developments
- 16.2.11.5. Financials (Based on Availability)
- 16.2.12 AUMA Riester GmbH & Co KG
- 16.2.12.1. Overview
- 16.2.12.2. Products
- 16.2.12.3. SWOT Analysis
- 16.2.12.4. Recent Developments
- 16.2.12.5. Financials (Based on Availability)
- 16.2.1 Honeywell International Inc
List of Figures
- Figure 1: Global Naval Actuators And Valves Market Revenue Breakdown (Million, %) by Region 2024 & 2032
- Figure 2: North America Naval Actuators And Valves Market Revenue (Million), by Country 2024 & 2032
- Figure 3: North America Naval Actuators And Valves Market Revenue Share (%), by Country 2024 & 2032
- Figure 4: Europe Naval Actuators And Valves Market Revenue (Million), by Country 2024 & 2032
- Figure 5: Europe Naval Actuators And Valves Market Revenue Share (%), by Country 2024 & 2032
- Figure 6: Asia Pacific Naval Actuators And Valves Market Revenue (Million), by Country 2024 & 2032
- Figure 7: Asia Pacific Naval Actuators And Valves Market Revenue Share (%), by Country 2024 & 2032
- Figure 8: Latin America Naval Actuators And Valves Market Revenue (Million), by Country 2024 & 2032
- Figure 9: Latin America Naval Actuators And Valves Market Revenue Share (%), by Country 2024 & 2032
- Figure 10: Middle East and Africa Naval Actuators And Valves Market Revenue (Million), by Country 2024 & 2032
- Figure 11: Middle East and Africa Naval Actuators And Valves Market Revenue Share (%), by Country 2024 & 2032
- Figure 12: North America Naval Actuators And Valves Market Revenue (Million), by Production Analysis 2024 & 2032
- Figure 13: North America Naval Actuators And Valves Market Revenue Share (%), by Production Analysis 2024 & 2032
- Figure 14: North America Naval Actuators And Valves Market Revenue (Million), by Consumption Analysis 2024 & 2032
- Figure 15: North America Naval Actuators And Valves Market Revenue Share (%), by Consumption Analysis 2024 & 2032
- Figure 16: North America Naval Actuators And Valves Market Revenue (Million), by Import Market Analysis (Value & Volume) 2024 & 2032
- Figure 17: North America Naval Actuators And Valves Market Revenue Share (%), by Import Market Analysis (Value & Volume) 2024 & 2032
- Figure 18: North America Naval Actuators And Valves Market Revenue (Million), by Export Market Analysis (Value & Volume) 2024 & 2032
- Figure 19: North America Naval Actuators And Valves Market Revenue Share (%), by Export Market Analysis (Value & Volume) 2024 & 2032
- Figure 20: North America Naval Actuators And Valves Market Revenue (Million), by Price Trend Analysis 2024 & 2032
- Figure 21: North America Naval Actuators And Valves Market Revenue Share (%), by Price Trend Analysis 2024 & 2032
- Figure 22: North America Naval Actuators And Valves Market Revenue (Million), by Country 2024 & 2032
- Figure 23: North America Naval Actuators And Valves Market Revenue Share (%), by Country 2024 & 2032
- Figure 24: South America Naval Actuators And Valves Market Revenue (Million), by Production Analysis 2024 & 2032
- Figure 25: South America Naval Actuators And Valves Market Revenue Share (%), by Production Analysis 2024 & 2032
- Figure 26: South America Naval Actuators And Valves Market Revenue (Million), by Consumption Analysis 2024 & 2032
- Figure 27: South America Naval Actuators And Valves Market Revenue Share (%), by Consumption Analysis 2024 & 2032
- Figure 28: South America Naval Actuators And Valves Market Revenue (Million), by Import Market Analysis (Value & Volume) 2024 & 2032
- Figure 29: South America Naval Actuators And Valves Market Revenue Share (%), by Import Market Analysis (Value & Volume) 2024 & 2032
- Figure 30: South America Naval Actuators And Valves Market Revenue (Million), by Export Market Analysis (Value & Volume) 2024 & 2032
- Figure 31: South America Naval Actuators And Valves Market Revenue Share (%), by Export Market Analysis (Value & Volume) 2024 & 2032
- Figure 32: South America Naval Actuators And Valves Market Revenue (Million), by Price Trend Analysis 2024 & 2032
- Figure 33: South America Naval Actuators And Valves Market Revenue Share (%), by Price Trend Analysis 2024 & 2032
- Figure 34: South America Naval Actuators And Valves Market Revenue (Million), by Country 2024 & 2032
- Figure 35: South America Naval Actuators And Valves Market Revenue Share (%), by Country 2024 & 2032
- Figure 36: Europe Naval Actuators And Valves Market Revenue (Million), by Production Analysis 2024 & 2032
- Figure 37: Europe Naval Actuators And Valves Market Revenue Share (%), by Production Analysis 2024 & 2032
- Figure 38: Europe Naval Actuators And Valves Market Revenue (Million), by Consumption Analysis 2024 & 2032
- Figure 39: Europe Naval Actuators And Valves Market Revenue Share (%), by Consumption Analysis 2024 & 2032
- Figure 40: Europe Naval Actuators And Valves Market Revenue (Million), by Import Market Analysis (Value & Volume) 2024 & 2032
- Figure 41: Europe Naval Actuators And Valves Market Revenue Share (%), by Import Market Analysis (Value & Volume) 2024 & 2032
- Figure 42: Europe Naval Actuators And Valves Market Revenue (Million), by Export Market Analysis (Value & Volume) 2024 & 2032
- Figure 43: Europe Naval Actuators And Valves Market Revenue Share (%), by Export Market Analysis (Value & Volume) 2024 & 2032
- Figure 44: Europe Naval Actuators And Valves Market Revenue (Million), by Price Trend Analysis 2024 & 2032
- Figure 45: Europe Naval Actuators And Valves Market Revenue Share (%), by Price Trend Analysis 2024 & 2032
- Figure 46: Europe Naval Actuators And Valves Market Revenue (Million), by Country 2024 & 2032
- Figure 47: Europe Naval Actuators And Valves Market Revenue Share (%), by Country 2024 & 2032
- Figure 48: Middle East & Africa Naval Actuators And Valves Market Revenue (Million), by Production Analysis 2024 & 2032
- Figure 49: Middle East & Africa Naval Actuators And Valves Market Revenue Share (%), by Production Analysis 2024 & 2032
- Figure 50: Middle East & Africa Naval Actuators And Valves Market Revenue (Million), by Consumption Analysis 2024 & 2032
- Figure 51: Middle East & Africa Naval Actuators And Valves Market Revenue Share (%), by Consumption Analysis 2024 & 2032
- Figure 52: Middle East & Africa Naval Actuators And Valves Market Revenue (Million), by Import Market Analysis (Value & Volume) 2024 & 2032
- Figure 53: Middle East & Africa Naval Actuators And Valves Market Revenue Share (%), by Import Market Analysis (Value & Volume) 2024 & 2032
- Figure 54: Middle East & Africa Naval Actuators And Valves Market Revenue (Million), by Export Market Analysis (Value & Volume) 2024 & 2032
- Figure 55: Middle East & Africa Naval Actuators And Valves Market Revenue Share (%), by Export Market Analysis (Value & Volume) 2024 & 2032
- Figure 56: Middle East & Africa Naval Actuators And Valves Market Revenue (Million), by Price Trend Analysis 2024 & 2032
- Figure 57: Middle East & Africa Naval Actuators And Valves Market Revenue Share (%), by Price Trend Analysis 2024 & 2032
- Figure 58: Middle East & Africa Naval Actuators And Valves Market Revenue (Million), by Country 2024 & 2032
- Figure 59: Middle East & Africa Naval Actuators And Valves Market Revenue Share (%), by Country 2024 & 2032
- Figure 60: Asia Pacific Naval Actuators And Valves Market Revenue (Million), by Production Analysis 2024 & 2032
- Figure 61: Asia Pacific Naval Actuators And Valves Market Revenue Share (%), by Production Analysis 2024 & 2032
- Figure 62: Asia Pacific Naval Actuators And Valves Market Revenue (Million), by Consumption Analysis 2024 & 2032
- Figure 63: Asia Pacific Naval Actuators And Valves Market Revenue Share (%), by Consumption Analysis 2024 & 2032
- Figure 64: Asia Pacific Naval Actuators And Valves Market Revenue (Million), by Import Market Analysis (Value & Volume) 2024 & 2032
- Figure 65: Asia Pacific Naval Actuators And Valves Market Revenue Share (%), by Import Market Analysis (Value & Volume) 2024 & 2032
- Figure 66: Asia Pacific Naval Actuators And Valves Market Revenue (Million), by Export Market Analysis (Value & Volume) 2024 & 2032
- Figure 67: Asia Pacific Naval Actuators And Valves Market Revenue Share (%), by Export Market Analysis (Value & Volume) 2024 & 2032
- Figure 68: Asia Pacific Naval Actuators And Valves Market Revenue (Million), by Price Trend Analysis 2024 & 2032
- Figure 69: Asia Pacific Naval Actuators And Valves Market Revenue Share (%), by Price Trend Analysis 2024 & 2032
- Figure 70: Asia Pacific Naval Actuators And Valves Market Revenue (Million), by Country 2024 & 2032
- Figure 71: Asia Pacific Naval Actuators And Valves Market Revenue Share (%), by Country 2024 & 2032
List of Tables
- Table 1: Global Naval Actuators And Valves Market Revenue Million Forecast, by Region 2019 & 2032
- Table 2: Global Naval Actuators And Valves Market Revenue Million Forecast, by Production Analysis 2019 & 2032
- Table 3: Global Naval Actuators And Valves Market Revenue Million Forecast, by Consumption Analysis 2019 & 2032
- Table 4: Global Naval Actuators And Valves Market Revenue Million Forecast, by Import Market Analysis (Value & Volume) 2019 & 2032
- Table 5: Global Naval Actuators And Valves Market Revenue Million Forecast, by Export Market Analysis (Value & Volume) 2019 & 2032
- Table 6: Global Naval Actuators And Valves Market Revenue Million Forecast, by Price Trend Analysis 2019 & 2032
- Table 7: Global Naval Actuators And Valves Market Revenue Million Forecast, by Region 2019 & 2032
- Table 8: Global Naval Actuators And Valves Market Revenue Million Forecast, by Country 2019 & 2032
- Table 9: United States Naval Actuators And Valves Market Revenue (Million) Forecast, by Application 2019 & 2032
- Table 10: Canada Naval Actuators And Valves Market Revenue (Million) Forecast, by Application 2019 & 2032
- Table 11: Global Naval Actuators And Valves Market Revenue Million Forecast, by Country 2019 & 2032
- Table 12: Germany Naval Actuators And Valves Market Revenue (Million) Forecast, by Application 2019 & 2032
- Table 13: United Kingdom Naval Actuators And Valves Market Revenue (Million) Forecast, by Application 2019 & 2032
- Table 14: France Naval Actuators And Valves Market Revenue (Million) Forecast, by Application 2019 & 2032
- Table 15: Russia Naval Actuators And Valves Market Revenue (Million) Forecast, by Application 2019 & 2032
- Table 16: Rest of Europe Naval Actuators And Valves Market Revenue (Million) Forecast, by Application 2019 & 2032
- Table 17: Global Naval Actuators And Valves Market Revenue Million Forecast, by Country 2019 & 2032
- Table 18: India Naval Actuators And Valves Market Revenue (Million) Forecast, by Application 2019 & 2032
- Table 19: China Naval Actuators And Valves Market Revenue (Million) Forecast, by Application 2019 & 2032
- Table 20: Japan Naval Actuators And Valves Market Revenue (Million) Forecast, by Application 2019 & 2032
- Table 21: South Korea Naval Actuators And Valves Market Revenue (Million) Forecast, by Application 2019 & 2032
- Table 22: Rest of Asia Pacific Naval Actuators And Valves Market Revenue (Million) Forecast, by Application 2019 & 2032
- Table 23: Global Naval Actuators And Valves Market Revenue Million Forecast, by Country 2019 & 2032
- Table 24: Mexico Naval Actuators And Valves Market Revenue (Million) Forecast, by Application 2019 & 2032
- Table 25: Brazil Naval Actuators And Valves Market Revenue (Million) Forecast, by Application 2019 & 2032
- Table 26: Rest of Latin America Naval Actuators And Valves Market Revenue (Million) Forecast, by Application 2019 & 2032
- Table 27: Global Naval Actuators And Valves Market Revenue Million Forecast, by Country 2019 & 2032
- Table 28: United Arab Emirates Naval Actuators And Valves Market Revenue (Million) Forecast, by Application 2019 & 2032
- Table 29: Saudi Arabia Naval Actuators And Valves Market Revenue (Million) Forecast, by Application 2019 & 2032
- Table 30: Egypt Naval Actuators And Valves Market Revenue (Million) Forecast, by Application 2019 & 2032
- Table 31: Israel Naval Actuators And Valves Market Revenue (Million) Forecast, by Application 2019 & 2032
- Table 32: Rest of Middle East and Africa Naval Actuators And Valves Market Revenue (Million) Forecast, by Application 2019 & 2032
- Table 33: Global Naval Actuators And Valves Market Revenue Million Forecast, by Production Analysis 2019 & 2032
- Table 34: Global Naval Actuators And Valves Market Revenue Million Forecast, by Consumption Analysis 2019 & 2032
- Table 35: Global Naval Actuators And Valves Market Revenue Million Forecast, by Import Market Analysis (Value & Volume) 2019 & 2032
- Table 36: Global Naval Actuators And Valves Market Revenue Million Forecast, by Export Market Analysis (Value & Volume) 2019 & 2032
- Table 37: Global Naval Actuators And Valves Market Revenue Million Forecast, by Price Trend Analysis 2019 & 2032
- Table 38: Global Naval Actuators And Valves Market Revenue Million Forecast, by Country 2019 & 2032
- Table 39: United States Naval Actuators And Valves Market Revenue (Million) Forecast, by Application 2019 & 2032
- Table 40: Canada Naval Actuators And Valves Market Revenue (Million) Forecast, by Application 2019 & 2032
- Table 41: Mexico Naval Actuators And Valves Market Revenue (Million) Forecast, by Application 2019 & 2032
- Table 42: Global Naval Actuators And Valves Market Revenue Million Forecast, by Production Analysis 2019 & 2032
- Table 43: Global Naval Actuators And Valves Market Revenue Million Forecast, by Consumption Analysis 2019 & 2032
- Table 44: Global Naval Actuators And Valves Market Revenue Million Forecast, by Import Market Analysis (Value & Volume) 2019 & 2032
- Table 45: Global Naval Actuators And Valves Market Revenue Million Forecast, by Export Market Analysis (Value & Volume) 2019 & 2032
- Table 46: Global Naval Actuators And Valves Market Revenue Million Forecast, by Price Trend Analysis 2019 & 2032
- Table 47: Global Naval Actuators And Valves Market Revenue Million Forecast, by Country 2019 & 2032
- Table 48: Brazil Naval Actuators And Valves Market Revenue (Million) Forecast, by Application 2019 & 2032
- Table 49: Argentina Naval Actuators And Valves Market Revenue (Million) Forecast, by Application 2019 & 2032
- Table 50: Rest of South America Naval Actuators And Valves Market Revenue (Million) Forecast, by Application 2019 & 2032
- Table 51: Global Naval Actuators And Valves Market Revenue Million Forecast, by Production Analysis 2019 & 2032
- Table 52: Global Naval Actuators And Valves Market Revenue Million Forecast, by Consumption Analysis 2019 & 2032
- Table 53: Global Naval Actuators And Valves Market Revenue Million Forecast, by Import Market Analysis (Value & Volume) 2019 & 2032
- Table 54: Global Naval Actuators And Valves Market Revenue Million Forecast, by Export Market Analysis (Value & Volume) 2019 & 2032
- Table 55: Global Naval Actuators And Valves Market Revenue Million Forecast, by Price Trend Analysis 2019 & 2032
- Table 56: Global Naval Actuators And Valves Market Revenue Million Forecast, by Country 2019 & 2032
- Table 57: United Kingdom Naval Actuators And Valves Market Revenue (Million) Forecast, by Application 2019 & 2032
- Table 58: Germany Naval Actuators And Valves Market Revenue (Million) Forecast, by Application 2019 & 2032
- Table 59: France Naval Actuators And Valves Market Revenue (Million) Forecast, by Application 2019 & 2032
- Table 60: Italy Naval Actuators And Valves Market Revenue (Million) Forecast, by Application 2019 & 2032
- Table 61: Spain Naval Actuators And Valves Market Revenue (Million) Forecast, by Application 2019 & 2032
- Table 62: Russia Naval Actuators And Valves Market Revenue (Million) Forecast, by Application 2019 & 2032
- Table 63: Benelux Naval Actuators And Valves Market Revenue (Million) Forecast, by Application 2019 & 2032
- Table 64: Nordics Naval Actuators And Valves Market Revenue (Million) Forecast, by Application 2019 & 2032
- Table 65: Rest of Europe Naval Actuators And Valves Market Revenue (Million) Forecast, by Application 2019 & 2032
- Table 66: Global Naval Actuators And Valves Market Revenue Million Forecast, by Production Analysis 2019 & 2032
- Table 67: Global Naval Actuators And Valves Market Revenue Million Forecast, by Consumption Analysis 2019 & 2032
- Table 68: Global Naval Actuators And Valves Market Revenue Million Forecast, by Import Market Analysis (Value & Volume) 2019 & 2032
- Table 69: Global Naval Actuators And Valves Market Revenue Million Forecast, by Export Market Analysis (Value & Volume) 2019 & 2032
- Table 70: Global Naval Actuators And Valves Market Revenue Million Forecast, by Price Trend Analysis 2019 & 2032
- Table 71: Global Naval Actuators And Valves Market Revenue Million Forecast, by Country 2019 & 2032
- Table 72: Turkey Naval Actuators And Valves Market Revenue (Million) Forecast, by Application 2019 & 2032
- Table 73: Israel Naval Actuators And Valves Market Revenue (Million) Forecast, by Application 2019 & 2032
- Table 74: GCC Naval Actuators And Valves Market Revenue (Million) Forecast, by Application 2019 & 2032
- Table 75: North Africa Naval Actuators And Valves Market Revenue (Million) Forecast, by Application 2019 & 2032
- Table 76: South Africa Naval Actuators And Valves Market Revenue (Million) Forecast, by Application 2019 & 2032
- Table 77: Rest of Middle East & Africa Naval Actuators And Valves Market Revenue (Million) Forecast, by Application 2019 & 2032
- Table 78: Global Naval Actuators And Valves Market Revenue Million Forecast, by Production Analysis 2019 & 2032
- Table 79: Global Naval Actuators And Valves Market Revenue Million Forecast, by Consumption Analysis 2019 & 2032
- Table 80: Global Naval Actuators And Valves Market Revenue Million Forecast, by Import Market Analysis (Value & Volume) 2019 & 2032
- Table 81: Global Naval Actuators And Valves Market Revenue Million Forecast, by Export Market Analysis (Value & Volume) 2019 & 2032
- Table 82: Global Naval Actuators And Valves Market Revenue Million Forecast, by Price Trend Analysis 2019 & 2032
- Table 83: Global Naval Actuators And Valves Market Revenue Million Forecast, by Country 2019 & 2032
- Table 84: China Naval Actuators And Valves Market Revenue (Million) Forecast, by Application 2019 & 2032
- Table 85: India Naval Actuators And Valves Market Revenue (Million) Forecast, by Application 2019 & 2032
- Table 86: Japan Naval Actuators And Valves Market Revenue (Million) Forecast, by Application 2019 & 2032
- Table 87: South Korea Naval Actuators And Valves Market Revenue (Million) Forecast, by Application 2019 & 2032
- Table 88: ASEAN Naval Actuators And Valves Market Revenue (Million) Forecast, by Application 2019 & 2032
- Table 89: Oceania Naval Actuators And Valves Market Revenue (Million) Forecast, by Application 2019 & 2032
- Table 90: Rest of Asia Pacific Naval Actuators And Valves Market Revenue (Million) Forecast, by Application 2019 & 2032
Frequently Asked Questions
1. What is the projected Compound Annual Growth Rate (CAGR) of the Naval Actuators And Valves Market?
The projected CAGR is approximately 4.64%.
2. Which companies are prominent players in the Naval Actuators And Valves Market?
Key companies in the market include Honeywell International Inc, MOOG Inc, Wärtsilä Corporation, Bosch Rexroth AG (Robert Bosch GmbH, Flowserve Corporation, Rotork PLC, Diakont, Emerson Electric Co, Curtiss-Wright Corporation, Schlumberger Limited, IMI PLC, AUMA Riester GmbH & Co KG.
3. What are the main segments of the Naval Actuators And Valves Market?
The market segments include Production Analysis, Consumption Analysis, Import Market Analysis (Value & Volume), Export Market Analysis (Value & Volume), Price Trend Analysis.
4. Can you provide details about the market size?
The market size is estimated to be USD 3.34 Million as of 2022.
5. What are some drivers contributing to market growth?
Increase in Internet of Things (IoT) and Autonomous Systems; Rise in Demand for Military and Defense Satellite Communication Solutions.
6. What are the notable trends driving market growth?
Defense Segment is Expected to Dominate the Market.
7. Are there any restraints impacting market growth?
Cybersecurity Threats to Satellite Communication; Interference in Transmission of Data.
8. Can you provide examples of recent developments in the market?
N/A
9. What pricing options are available for accessing the report?
Pricing options include single-user, multi-user, and enterprise licenses priced at USD 4750, USD 5250, and USD 8750 respectively.
10. Is the market size provided in terms of value or volume?
The market size is provided in terms of value, measured in Million.
11. Are there any specific market keywords associated with the report?
Yes, the market keyword associated with the report is "Naval Actuators And Valves Market," which aids in identifying and referencing the specific market segment covered.
12. How do I determine which pricing option suits my needs best?
The pricing options vary based on user requirements and access needs. Individual users may opt for single-user licenses, while businesses requiring broader access may choose multi-user or enterprise licenses for cost-effective access to the report.
13. Are there any additional resources or data provided in the Naval Actuators And Valves Market report?
While the report offers comprehensive insights, it's advisable to review the specific contents or supplementary materials provided to ascertain if additional resources or data are available.
14. How can I stay updated on further developments or reports in the Naval Actuators And Valves Market?
To stay informed about further developments, trends, and reports in the Naval Actuators And Valves Market, consider subscribing to industry newsletters, following relevant companies and organizations, or regularly checking reputable industry news sources and publications.
Methodology
Step 1 - Identification of Relevant Samples Size from Population Database


Step 2 - Approaches for Defining Global Market Size (Value, Volume* & Price*)

Note*: In applicable scenarios
Step 3 - Data Sources
Primary Research
- Web Analytics
- Survey Reports
- Research Institute
- Latest Research Reports
- Opinion Leaders
Secondary Research
- Annual Reports
- White Paper
- Latest Press Release
- Industry Association
- Paid Database
- Investor Presentations

Step 4 - Data Triangulation
Involves using different sources of information in order to increase the validity of a study
These sources are likely to be stakeholders in a program - participants, other researchers, program staff, other community members, and so on.
Then we put all data in single framework & apply various statistical tools to find out the dynamic on the market.
During the analysis stage, feedback from the stakeholder groups would be compared to determine areas of agreement as well as areas of divergence
