

Key Insights
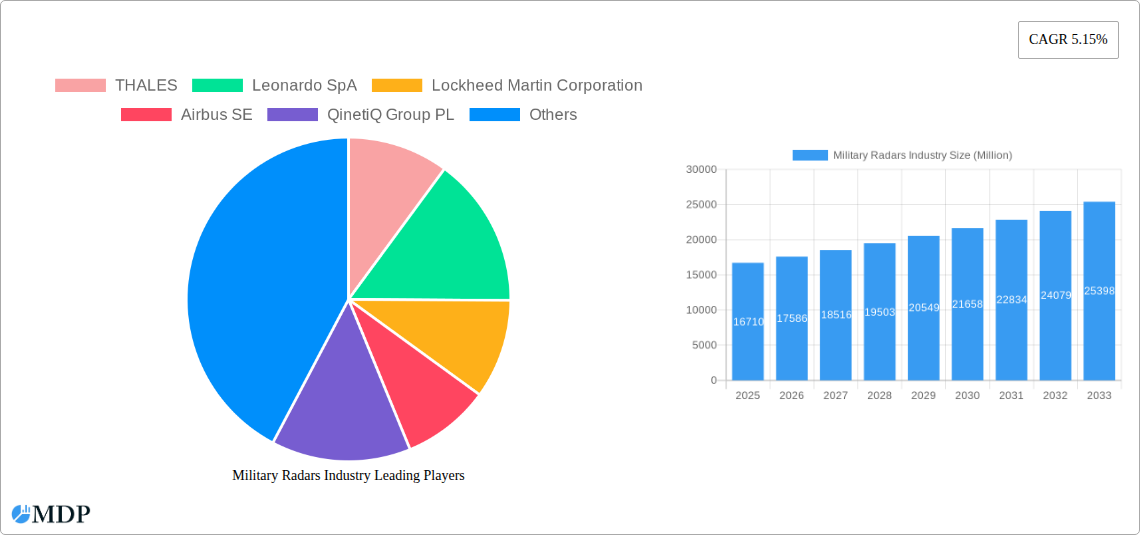
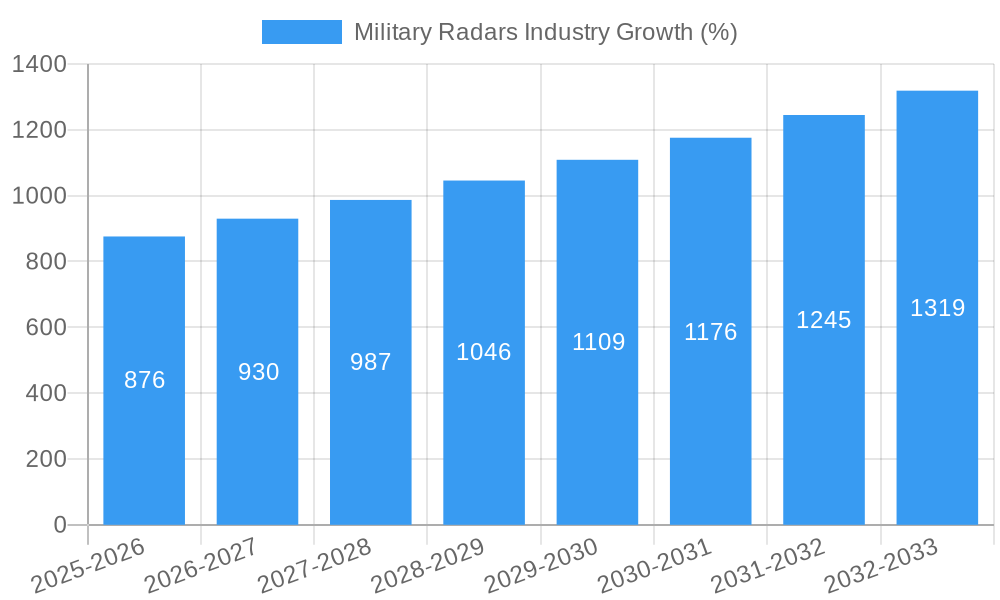
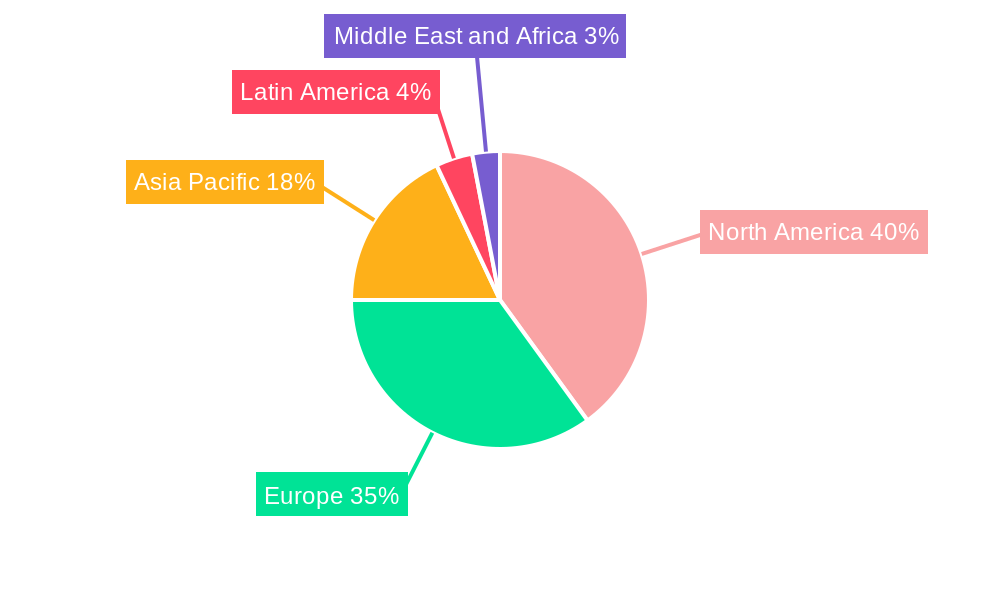
The global military radar market, valued at $16.71 billion in 2025, is projected to experience robust growth, driven by escalating geopolitical tensions, modernization of defense infrastructure, and the increasing demand for advanced surveillance and targeting systems. A Compound Annual Growth Rate (CAGR) of 5.15% is anticipated from 2025 to 2033, indicating a significant market expansion. Key growth drivers include the rising adoption of phased array radar technology offering enhanced detection capabilities and improved target tracking, alongside the integration of artificial intelligence and machine learning for autonomous target recognition and threat assessment. Furthermore, the increasing investments in unmanned aerial vehicles (UAVs) and counter-drone technologies are fueling demand for compact, lightweight, and highly effective radar systems. The market segmentation reveals a diverse landscape, with ground-based radars holding a significant share due to their wide-ranging applications in air defense and border surveillance. However, the naval and airborne segments are experiencing rapid growth fueled by technological advancements and increased defense spending. The application segments, including air and missile defense, ISR, and navigation, all contribute significantly to the market's overall value. Competition among major players, including Thales, Leonardo SpA, Lockheed Martin, and others, is intense, driving innovation and fostering technological advancements. Regional analysis indicates that North America and Europe will remain dominant markets due to higher defense budgets and robust technological capabilities, although Asia-Pacific is expected to exhibit significant growth fueled by increasing military spending and regional security concerns.
The continued investment in R&D by leading companies is expected to contribute significantly to the market's expansion. Technological advancements such as the development of more efficient and powerful Gallium Nitride (GaN) based radar systems, along with the integration of advanced signal processing techniques, are set to further enhance the capabilities and applications of military radars. Despite the growth potential, some challenges remain. The high cost of advanced radar systems and the complexity of integration with existing defense systems could act as potential restraints. However, ongoing efforts towards miniaturization, cost reduction, and modular design are mitigating these challenges. The forecast period of 2025-2033 promises significant opportunities for market players, driven by a combination of technological advancements, strategic investments, and global security concerns. The market's growth will be largely influenced by the evolving geopolitical landscape and the continuous demand for superior defense capabilities.
Military Radars Industry Market Report: 2019-2033 Forecast
Dive deep into the comprehensive analysis of the Military Radars Industry, encompassing market dynamics, leading players, technological advancements, and future growth projections from 2019-2033. This in-depth report provides actionable insights for industry stakeholders, investors, and strategic decision-makers. The study period covers 2019-2033, with 2025 as the base and estimated year. The forecast period spans 2025-2033 and the historical period is 2019-2024. The global market size is projected to reach xx Million by 2033.
Military Radars Industry Market Dynamics & Concentration
The Military Radars industry is characterized by a moderately concentrated market with key players holding significant market share. THALES, Leonardo SpA, Lockheed Martin Corporation, and others dominate the landscape. The market's dynamism is driven by continuous technological innovation, particularly in areas such as AESA (Active Electronically Scanned Array) technology and AI-driven signal processing. Stringent regulatory frameworks governing defense procurement and export control influence market activities. Product substitution is limited due to the specialized nature of military radar systems. However, the increasing adoption of software-defined radars is creating a subtle shift in the competitive landscape. End-user trends favor multi-functional radars capable of performing diverse tasks, and M&A activities have contributed to market consolidation, with xx major deals recorded between 2019 and 2024.
- Market Concentration: Highly concentrated, with top 5 players holding approximately xx% market share in 2024.
- Innovation Drivers: AESA technology, AI-driven signal processing, miniaturization, and software-defined radars.
- Regulatory Frameworks: Stringent export controls and defense procurement regulations.
- M&A Activities: xx major mergers and acquisitions recorded between 2019 and 2024.
- End-User Trends: Growing demand for multi-functional, adaptable radar systems.
Military Radars Industry Industry Trends & Analysis
The Military Radars market exhibits robust growth, driven by escalating geopolitical tensions, modernization of defense forces globally, and the increasing need for advanced surveillance and defense systems. The market is experiencing a Compound Annual Growth Rate (CAGR) of xx% during the forecast period (2025-2033). This growth is fueled by technological disruptions, such as the widespread adoption of AESA technology, leading to improved performance, accuracy, and versatility. Consumer preferences, in this case, governmental and military agencies, increasingly favor systems with enhanced situational awareness capabilities and seamless integration with other defense platforms. Competitive dynamics are characterized by intense R&D investment and strategic partnerships aiming for technological leadership and market share expansion. Market penetration of AESA-based radars is expected to reach xx% by 2033.
Leading Markets & Segments in Military Radars Industry
The North American region currently holds the largest market share due to significant defense budgets and technological advancements. Within segments, the Airborne segment dominates, driven by increasing demand for advanced airborne early warning and control (AEW&C) systems. In terms of application, Air and Missile Defense holds the largest market share due to the critical role of radars in protecting national airspace and assets.
- Dominant Region: North America
- Dominant Platform Segment: Airborne
- Dominant Application Segment: Air and Missile Defense
- Key Drivers (North America): High defense spending, strong technological base, robust R&D investments.
- Key Drivers (Airborne Segment): Rising demand for AEW&C systems, increasing need for situational awareness in aerial operations.
- Key Drivers (Air and Missile Defense): Growing threat of ballistic missiles and unmanned aerial vehicles.
Military Radars Industry Product Developments
Recent product innovations include advanced AESA radars with enhanced range, resolution, and multi-target tracking capabilities. These advancements are driven by miniaturization technologies, enabling the integration of radars into smaller platforms like UAVs and tactical vehicles. Key competitive advantages are derived from superior signal processing algorithms, innovative antenna designs, and seamless integration with other defense systems. The market trend leans towards multi-functional radars capable of performing multiple tasks simultaneously, enhancing operational efficiency.
Key Drivers of Military Radars Industry Growth
Technological advancements in AESA technology, AI, and advanced signal processing are major growth catalysts. Increasing defense budgets globally fuel demand for sophisticated radar systems. Geopolitical instability and rising defense spending contribute significantly to market growth, with specific examples being the increasing tensions in certain regions and the modernization programs of several nations' armed forces.
Challenges in the Military Radars Industry Market
High development and production costs pose significant challenges, particularly for smaller companies. Supply chain disruptions related to crucial components can severely impact production timelines and costs. Intense competition among established players creates pressure on pricing and profit margins, further exacerbated by the increasing complexity and sophistication of the technology.
Emerging Opportunities in Military Radars Industry
The integration of AI and machine learning into radar systems offers significant potential for enhancing situational awareness and automating target recognition. Strategic partnerships between radar manufacturers and software developers are emerging as a major trend, resulting in more advanced and integrated systems. Market expansion into emerging economies with rapidly growing defense budgets presents lucrative opportunities for market expansion.
Leading Players in the Military Radars Industry Sector
- THALES
- Leonardo SpA
- Lockheed Martin Corporation
- Airbus SE
- QinetiQ Group PL
- Teledyne Technologies Incorporated
- BAE Systems PLC
- RTX Corporation
- HENSOLDT Holding Germany GmbH
- Israel Aerospace Industries Ltd
- Northrop Grumman Corporation
- Saab AB
Key Milestones in Military Radars Industry Industry
- 2020: Successful deployment of a new AESA radar system by Lockheed Martin.
- 2021: THALES announces a strategic partnership with a leading AI company for radar signal processing.
- 2022: Leonardo SpA launches a new generation of multi-functional radar.
- 2023: Several significant mergers and acquisitions reshape the market landscape.
- 2024: Increased adoption of software-defined radars observed across the industry.
Strategic Outlook for Military Radars Industry Market
The future of the Military Radars market is bright, driven by ongoing technological innovation and increasing defense budgets worldwide. Strategic opportunities lie in developing advanced AI-powered systems, expanding into new applications, and forging strategic partnerships to enhance product offerings and market reach. The market is poised for continued growth, with AESA and multi-functional radar systems spearheading market expansion.
Military Radars Industry Segmentation
- 1. Production Analysis
- 2. Consumption Analysis
- 3. Import Market Analysis (Value & Volume)
- 4. Export Market Analysis (Value & Volume)
- 5. Price Trend Analysis
Military Radars Industry Segmentation By Geography
-
1. North America
- 1.1. United States
- 1.2. Canada
- 1.3. Mexico
-
2. South America
- 2.1. Brazil
- 2.2. Argentina
- 2.3. Rest of South America
-
3. Europe
- 3.1. United Kingdom
- 3.2. Germany
- 3.3. France
- 3.4. Italy
- 3.5. Spain
- 3.6. Russia
- 3.7. Benelux
- 3.8. Nordics
- 3.9. Rest of Europe
-
4. Middle East & Africa
- 4.1. Turkey
- 4.2. Israel
- 4.3. GCC
- 4.4. North Africa
- 4.5. South Africa
- 4.6. Rest of Middle East & Africa
-
5. Asia Pacific
- 5.1. China
- 5.2. India
- 5.3. Japan
- 5.4. South Korea
- 5.5. ASEAN
- 5.6. Oceania
- 5.7. Rest of Asia Pacific
Military Radars Industry REPORT HIGHLIGHTS
| Aspects | Details |
|---|---|
| Study Period | 2019-2033 |
| Base Year | 2024 |
| Estimated Year | 2025 |
| Forecast Period | 2025-2033 |
| Historical Period | 2019-2024 |
| Growth Rate | CAGR of 5.15% from 2019-2033 |
| Segmentation |
|
Table of Contents
- 1. Introduction
- 1.1. Research Scope
- 1.2. Market Segmentation
- 1.3. Research Methodology
- 1.4. Definitions and Assumptions
- 2. Executive Summary
- 2.1. Introduction
- 3. Market Dynamics
- 3.1. Introduction
- 3.2. Market Drivers
- 3.2.1. Increase in Internet of Things (IoT) and Autonomous Systems; Rise in Demand for Military and Defense Satellite Communication Solutions
- 3.3. Market Restrains
- 3.3.1. Cybersecurity Threats to Satellite Communication; Interference in Transmission of Data
- 3.4. Market Trends
- 3.4.1. Airborne Segment Expected to Register the Highest CAGR During the Forecast Period
- 4. Market Factor Analysis
- 4.1. Porters Five Forces
- 4.2. Supply/Value Chain
- 4.3. PESTEL analysis
- 4.4. Market Entropy
- 4.5. Patent/Trademark Analysis
- 5. Global Military Radars Industry Analysis, Insights and Forecast, 2019-2031
- 5.1. Market Analysis, Insights and Forecast - by Production Analysis
- 5.2. Market Analysis, Insights and Forecast - by Consumption Analysis
- 5.3. Market Analysis, Insights and Forecast - by Import Market Analysis (Value & Volume)
- 5.4. Market Analysis, Insights and Forecast - by Export Market Analysis (Value & Volume)
- 5.5. Market Analysis, Insights and Forecast - by Price Trend Analysis
- 5.6. Market Analysis, Insights and Forecast - by Region
- 5.6.1. North America
- 5.6.2. South America
- 5.6.3. Europe
- 5.6.4. Middle East & Africa
- 5.6.5. Asia Pacific
- 5.1. Market Analysis, Insights and Forecast - by Production Analysis
- 6. North America Military Radars Industry Analysis, Insights and Forecast, 2019-2031
- 6.1. Market Analysis, Insights and Forecast - by Production Analysis
- 6.2. Market Analysis, Insights and Forecast - by Consumption Analysis
- 6.3. Market Analysis, Insights and Forecast - by Import Market Analysis (Value & Volume)
- 6.4. Market Analysis, Insights and Forecast - by Export Market Analysis (Value & Volume)
- 6.5. Market Analysis, Insights and Forecast - by Price Trend Analysis
- 6.1. Market Analysis, Insights and Forecast - by Production Analysis
- 7. South America Military Radars Industry Analysis, Insights and Forecast, 2019-2031
- 7.1. Market Analysis, Insights and Forecast - by Production Analysis
- 7.2. Market Analysis, Insights and Forecast - by Consumption Analysis
- 7.3. Market Analysis, Insights and Forecast - by Import Market Analysis (Value & Volume)
- 7.4. Market Analysis, Insights and Forecast - by Export Market Analysis (Value & Volume)
- 7.5. Market Analysis, Insights and Forecast - by Price Trend Analysis
- 7.1. Market Analysis, Insights and Forecast - by Production Analysis
- 8. Europe Military Radars Industry Analysis, Insights and Forecast, 2019-2031
- 8.1. Market Analysis, Insights and Forecast - by Production Analysis
- 8.2. Market Analysis, Insights and Forecast - by Consumption Analysis
- 8.3. Market Analysis, Insights and Forecast - by Import Market Analysis (Value & Volume)
- 8.4. Market Analysis, Insights and Forecast - by Export Market Analysis (Value & Volume)
- 8.5. Market Analysis, Insights and Forecast - by Price Trend Analysis
- 8.1. Market Analysis, Insights and Forecast - by Production Analysis
- 9. Middle East & Africa Military Radars Industry Analysis, Insights and Forecast, 2019-2031
- 9.1. Market Analysis, Insights and Forecast - by Production Analysis
- 9.2. Market Analysis, Insights and Forecast - by Consumption Analysis
- 9.3. Market Analysis, Insights and Forecast - by Import Market Analysis (Value & Volume)
- 9.4. Market Analysis, Insights and Forecast - by Export Market Analysis (Value & Volume)
- 9.5. Market Analysis, Insights and Forecast - by Price Trend Analysis
- 9.1. Market Analysis, Insights and Forecast - by Production Analysis
- 10. Asia Pacific Military Radars Industry Analysis, Insights and Forecast, 2019-2031
- 10.1. Market Analysis, Insights and Forecast - by Production Analysis
- 10.2. Market Analysis, Insights and Forecast - by Consumption Analysis
- 10.3. Market Analysis, Insights and Forecast - by Import Market Analysis (Value & Volume)
- 10.4. Market Analysis, Insights and Forecast - by Export Market Analysis (Value & Volume)
- 10.5. Market Analysis, Insights and Forecast - by Price Trend Analysis
- 10.1. Market Analysis, Insights and Forecast - by Production Analysis
- 11. North America Military Radars Industry Analysis, Insights and Forecast, 2019-2031
- 11.1. Market Analysis, Insights and Forecast - By Country/Sub-region
- 11.1.1 United States
- 11.1.2 Canada
- 12. Europe Military Radars Industry Analysis, Insights and Forecast, 2019-2031
- 12.1. Market Analysis, Insights and Forecast - By Country/Sub-region
- 12.1.1 United Kingdom
- 12.1.2 Germany
- 12.1.3 France
- 12.1.4 Russia
- 12.1.5 Rest of Europe
- 13. Asia Pacific Military Radars Industry Analysis, Insights and Forecast, 2019-2031
- 13.1. Market Analysis, Insights and Forecast - By Country/Sub-region
- 13.1.1 China
- 13.1.2 India
- 13.1.3 Japan
- 13.1.4 South Korea
- 13.1.5 Rest of Asia Pacific
- 14. Latin America Military Radars Industry Analysis, Insights and Forecast, 2019-2031
- 14.1. Market Analysis, Insights and Forecast - By Country/Sub-region
- 14.1.1 Brazil
- 14.1.2 Rest of Latin America
- 15. Middle East and Africa Military Radars Industry Analysis, Insights and Forecast, 2019-2031
- 15.1. Market Analysis, Insights and Forecast - By Country/Sub-region
- 15.1.1 United Arab Emirates
- 15.1.2 Saudi Arabia
- 15.1.3 Egypt
- 15.1.4 Rest of Middle East and Africa
- 16. Competitive Analysis
- 16.1. Global Market Share Analysis 2024
- 16.2. Company Profiles
- 16.2.1 THALES
- 16.2.1.1. Overview
- 16.2.1.2. Products
- 16.2.1.3. SWOT Analysis
- 16.2.1.4. Recent Developments
- 16.2.1.5. Financials (Based on Availability)
- 16.2.2 Leonardo SpA
- 16.2.2.1. Overview
- 16.2.2.2. Products
- 16.2.2.3. SWOT Analysis
- 16.2.2.4. Recent Developments
- 16.2.2.5. Financials (Based on Availability)
- 16.2.3 Lockheed Martin Corporation
- 16.2.3.1. Overview
- 16.2.3.2. Products
- 16.2.3.3. SWOT Analysis
- 16.2.3.4. Recent Developments
- 16.2.3.5. Financials (Based on Availability)
- 16.2.4 Airbus SE
- 16.2.4.1. Overview
- 16.2.4.2. Products
- 16.2.4.3. SWOT Analysis
- 16.2.4.4. Recent Developments
- 16.2.4.5. Financials (Based on Availability)
- 16.2.5 QinetiQ Group PL
- 16.2.5.1. Overview
- 16.2.5.2. Products
- 16.2.5.3. SWOT Analysis
- 16.2.5.4. Recent Developments
- 16.2.5.5. Financials (Based on Availability)
- 16.2.6 Teledyne Technologies Incorporated
- 16.2.6.1. Overview
- 16.2.6.2. Products
- 16.2.6.3. SWOT Analysis
- 16.2.6.4. Recent Developments
- 16.2.6.5. Financials (Based on Availability)
- 16.2.7 BAE Systems PLC
- 16.2.7.1. Overview
- 16.2.7.2. Products
- 16.2.7.3. SWOT Analysis
- 16.2.7.4. Recent Developments
- 16.2.7.5. Financials (Based on Availability)
- 16.2.8 RTX Corporation
- 16.2.8.1. Overview
- 16.2.8.2. Products
- 16.2.8.3. SWOT Analysis
- 16.2.8.4. Recent Developments
- 16.2.8.5. Financials (Based on Availability)
- 16.2.9 HENSOLDT Holding Germany GmbH
- 16.2.9.1. Overview
- 16.2.9.2. Products
- 16.2.9.3. SWOT Analysis
- 16.2.9.4. Recent Developments
- 16.2.9.5. Financials (Based on Availability)
- 16.2.10 Israel Aerospace Industries Ltd
- 16.2.10.1. Overview
- 16.2.10.2. Products
- 16.2.10.3. SWOT Analysis
- 16.2.10.4. Recent Developments
- 16.2.10.5. Financials (Based on Availability)
- 16.2.11 Northrop Grumman Corporation
- 16.2.11.1. Overview
- 16.2.11.2. Products
- 16.2.11.3. SWOT Analysis
- 16.2.11.4. Recent Developments
- 16.2.11.5. Financials (Based on Availability)
- 16.2.12 Saab AB
- 16.2.12.1. Overview
- 16.2.12.2. Products
- 16.2.12.3. SWOT Analysis
- 16.2.12.4. Recent Developments
- 16.2.12.5. Financials (Based on Availability)
- 16.2.1 THALES
List of Figures
- Figure 1: Global Military Radars Industry Revenue Breakdown (Million, %) by Region 2024 & 2032
- Figure 2: North America Military Radars Industry Revenue (Million), by Country 2024 & 2032
- Figure 3: North America Military Radars Industry Revenue Share (%), by Country 2024 & 2032
- Figure 4: Europe Military Radars Industry Revenue (Million), by Country 2024 & 2032
- Figure 5: Europe Military Radars Industry Revenue Share (%), by Country 2024 & 2032
- Figure 6: Asia Pacific Military Radars Industry Revenue (Million), by Country 2024 & 2032
- Figure 7: Asia Pacific Military Radars Industry Revenue Share (%), by Country 2024 & 2032
- Figure 8: Latin America Military Radars Industry Revenue (Million), by Country 2024 & 2032
- Figure 9: Latin America Military Radars Industry Revenue Share (%), by Country 2024 & 2032
- Figure 10: Middle East and Africa Military Radars Industry Revenue (Million), by Country 2024 & 2032
- Figure 11: Middle East and Africa Military Radars Industry Revenue Share (%), by Country 2024 & 2032
- Figure 12: North America Military Radars Industry Revenue (Million), by Production Analysis 2024 & 2032
- Figure 13: North America Military Radars Industry Revenue Share (%), by Production Analysis 2024 & 2032
- Figure 14: North America Military Radars Industry Revenue (Million), by Consumption Analysis 2024 & 2032
- Figure 15: North America Military Radars Industry Revenue Share (%), by Consumption Analysis 2024 & 2032
- Figure 16: North America Military Radars Industry Revenue (Million), by Import Market Analysis (Value & Volume) 2024 & 2032
- Figure 17: North America Military Radars Industry Revenue Share (%), by Import Market Analysis (Value & Volume) 2024 & 2032
- Figure 18: North America Military Radars Industry Revenue (Million), by Export Market Analysis (Value & Volume) 2024 & 2032
- Figure 19: North America Military Radars Industry Revenue Share (%), by Export Market Analysis (Value & Volume) 2024 & 2032
- Figure 20: North America Military Radars Industry Revenue (Million), by Price Trend Analysis 2024 & 2032
- Figure 21: North America Military Radars Industry Revenue Share (%), by Price Trend Analysis 2024 & 2032
- Figure 22: North America Military Radars Industry Revenue (Million), by Country 2024 & 2032
- Figure 23: North America Military Radars Industry Revenue Share (%), by Country 2024 & 2032
- Figure 24: South America Military Radars Industry Revenue (Million), by Production Analysis 2024 & 2032
- Figure 25: South America Military Radars Industry Revenue Share (%), by Production Analysis 2024 & 2032
- Figure 26: South America Military Radars Industry Revenue (Million), by Consumption Analysis 2024 & 2032
- Figure 27: South America Military Radars Industry Revenue Share (%), by Consumption Analysis 2024 & 2032
- Figure 28: South America Military Radars Industry Revenue (Million), by Import Market Analysis (Value & Volume) 2024 & 2032
- Figure 29: South America Military Radars Industry Revenue Share (%), by Import Market Analysis (Value & Volume) 2024 & 2032
- Figure 30: South America Military Radars Industry Revenue (Million), by Export Market Analysis (Value & Volume) 2024 & 2032
- Figure 31: South America Military Radars Industry Revenue Share (%), by Export Market Analysis (Value & Volume) 2024 & 2032
- Figure 32: South America Military Radars Industry Revenue (Million), by Price Trend Analysis 2024 & 2032
- Figure 33: South America Military Radars Industry Revenue Share (%), by Price Trend Analysis 2024 & 2032
- Figure 34: South America Military Radars Industry Revenue (Million), by Country 2024 & 2032
- Figure 35: South America Military Radars Industry Revenue Share (%), by Country 2024 & 2032
- Figure 36: Europe Military Radars Industry Revenue (Million), by Production Analysis 2024 & 2032
- Figure 37: Europe Military Radars Industry Revenue Share (%), by Production Analysis 2024 & 2032
- Figure 38: Europe Military Radars Industry Revenue (Million), by Consumption Analysis 2024 & 2032
- Figure 39: Europe Military Radars Industry Revenue Share (%), by Consumption Analysis 2024 & 2032
- Figure 40: Europe Military Radars Industry Revenue (Million), by Import Market Analysis (Value & Volume) 2024 & 2032
- Figure 41: Europe Military Radars Industry Revenue Share (%), by Import Market Analysis (Value & Volume) 2024 & 2032
- Figure 42: Europe Military Radars Industry Revenue (Million), by Export Market Analysis (Value & Volume) 2024 & 2032
- Figure 43: Europe Military Radars Industry Revenue Share (%), by Export Market Analysis (Value & Volume) 2024 & 2032
- Figure 44: Europe Military Radars Industry Revenue (Million), by Price Trend Analysis 2024 & 2032
- Figure 45: Europe Military Radars Industry Revenue Share (%), by Price Trend Analysis 2024 & 2032
- Figure 46: Europe Military Radars Industry Revenue (Million), by Country 2024 & 2032
- Figure 47: Europe Military Radars Industry Revenue Share (%), by Country 2024 & 2032
- Figure 48: Middle East & Africa Military Radars Industry Revenue (Million), by Production Analysis 2024 & 2032
- Figure 49: Middle East & Africa Military Radars Industry Revenue Share (%), by Production Analysis 2024 & 2032
- Figure 50: Middle East & Africa Military Radars Industry Revenue (Million), by Consumption Analysis 2024 & 2032
- Figure 51: Middle East & Africa Military Radars Industry Revenue Share (%), by Consumption Analysis 2024 & 2032
- Figure 52: Middle East & Africa Military Radars Industry Revenue (Million), by Import Market Analysis (Value & Volume) 2024 & 2032
- Figure 53: Middle East & Africa Military Radars Industry Revenue Share (%), by Import Market Analysis (Value & Volume) 2024 & 2032
- Figure 54: Middle East & Africa Military Radars Industry Revenue (Million), by Export Market Analysis (Value & Volume) 2024 & 2032
- Figure 55: Middle East & Africa Military Radars Industry Revenue Share (%), by Export Market Analysis (Value & Volume) 2024 & 2032
- Figure 56: Middle East & Africa Military Radars Industry Revenue (Million), by Price Trend Analysis 2024 & 2032
- Figure 57: Middle East & Africa Military Radars Industry Revenue Share (%), by Price Trend Analysis 2024 & 2032
- Figure 58: Middle East & Africa Military Radars Industry Revenue (Million), by Country 2024 & 2032
- Figure 59: Middle East & Africa Military Radars Industry Revenue Share (%), by Country 2024 & 2032
- Figure 60: Asia Pacific Military Radars Industry Revenue (Million), by Production Analysis 2024 & 2032
- Figure 61: Asia Pacific Military Radars Industry Revenue Share (%), by Production Analysis 2024 & 2032
- Figure 62: Asia Pacific Military Radars Industry Revenue (Million), by Consumption Analysis 2024 & 2032
- Figure 63: Asia Pacific Military Radars Industry Revenue Share (%), by Consumption Analysis 2024 & 2032
- Figure 64: Asia Pacific Military Radars Industry Revenue (Million), by Import Market Analysis (Value & Volume) 2024 & 2032
- Figure 65: Asia Pacific Military Radars Industry Revenue Share (%), by Import Market Analysis (Value & Volume) 2024 & 2032
- Figure 66: Asia Pacific Military Radars Industry Revenue (Million), by Export Market Analysis (Value & Volume) 2024 & 2032
- Figure 67: Asia Pacific Military Radars Industry Revenue Share (%), by Export Market Analysis (Value & Volume) 2024 & 2032
- Figure 68: Asia Pacific Military Radars Industry Revenue (Million), by Price Trend Analysis 2024 & 2032
- Figure 69: Asia Pacific Military Radars Industry Revenue Share (%), by Price Trend Analysis 2024 & 2032
- Figure 70: Asia Pacific Military Radars Industry Revenue (Million), by Country 2024 & 2032
- Figure 71: Asia Pacific Military Radars Industry Revenue Share (%), by Country 2024 & 2032
List of Tables
- Table 1: Global Military Radars Industry Revenue Million Forecast, by Region 2019 & 2032
- Table 2: Global Military Radars Industry Revenue Million Forecast, by Production Analysis 2019 & 2032
- Table 3: Global Military Radars Industry Revenue Million Forecast, by Consumption Analysis 2019 & 2032
- Table 4: Global Military Radars Industry Revenue Million Forecast, by Import Market Analysis (Value & Volume) 2019 & 2032
- Table 5: Global Military Radars Industry Revenue Million Forecast, by Export Market Analysis (Value & Volume) 2019 & 2032
- Table 6: Global Military Radars Industry Revenue Million Forecast, by Price Trend Analysis 2019 & 2032
- Table 7: Global Military Radars Industry Revenue Million Forecast, by Region 2019 & 2032
- Table 8: Global Military Radars Industry Revenue Million Forecast, by Country 2019 & 2032
- Table 9: United States Military Radars Industry Revenue (Million) Forecast, by Application 2019 & 2032
- Table 10: Canada Military Radars Industry Revenue (Million) Forecast, by Application 2019 & 2032
- Table 11: Global Military Radars Industry Revenue Million Forecast, by Country 2019 & 2032
- Table 12: United Kingdom Military Radars Industry Revenue (Million) Forecast, by Application 2019 & 2032
- Table 13: Germany Military Radars Industry Revenue (Million) Forecast, by Application 2019 & 2032
- Table 14: France Military Radars Industry Revenue (Million) Forecast, by Application 2019 & 2032
- Table 15: Russia Military Radars Industry Revenue (Million) Forecast, by Application 2019 & 2032
- Table 16: Rest of Europe Military Radars Industry Revenue (Million) Forecast, by Application 2019 & 2032
- Table 17: Global Military Radars Industry Revenue Million Forecast, by Country 2019 & 2032
- Table 18: China Military Radars Industry Revenue (Million) Forecast, by Application 2019 & 2032
- Table 19: India Military Radars Industry Revenue (Million) Forecast, by Application 2019 & 2032
- Table 20: Japan Military Radars Industry Revenue (Million) Forecast, by Application 2019 & 2032
- Table 21: South Korea Military Radars Industry Revenue (Million) Forecast, by Application 2019 & 2032
- Table 22: Rest of Asia Pacific Military Radars Industry Revenue (Million) Forecast, by Application 2019 & 2032
- Table 23: Global Military Radars Industry Revenue Million Forecast, by Country 2019 & 2032
- Table 24: Brazil Military Radars Industry Revenue (Million) Forecast, by Application 2019 & 2032
- Table 25: Rest of Latin America Military Radars Industry Revenue (Million) Forecast, by Application 2019 & 2032
- Table 26: Global Military Radars Industry Revenue Million Forecast, by Country 2019 & 2032
- Table 27: United Arab Emirates Military Radars Industry Revenue (Million) Forecast, by Application 2019 & 2032
- Table 28: Saudi Arabia Military Radars Industry Revenue (Million) Forecast, by Application 2019 & 2032
- Table 29: Egypt Military Radars Industry Revenue (Million) Forecast, by Application 2019 & 2032
- Table 30: Rest of Middle East and Africa Military Radars Industry Revenue (Million) Forecast, by Application 2019 & 2032
- Table 31: Global Military Radars Industry Revenue Million Forecast, by Production Analysis 2019 & 2032
- Table 32: Global Military Radars Industry Revenue Million Forecast, by Consumption Analysis 2019 & 2032
- Table 33: Global Military Radars Industry Revenue Million Forecast, by Import Market Analysis (Value & Volume) 2019 & 2032
- Table 34: Global Military Radars Industry Revenue Million Forecast, by Export Market Analysis (Value & Volume) 2019 & 2032
- Table 35: Global Military Radars Industry Revenue Million Forecast, by Price Trend Analysis 2019 & 2032
- Table 36: Global Military Radars Industry Revenue Million Forecast, by Country 2019 & 2032
- Table 37: United States Military Radars Industry Revenue (Million) Forecast, by Application 2019 & 2032
- Table 38: Canada Military Radars Industry Revenue (Million) Forecast, by Application 2019 & 2032
- Table 39: Mexico Military Radars Industry Revenue (Million) Forecast, by Application 2019 & 2032
- Table 40: Global Military Radars Industry Revenue Million Forecast, by Production Analysis 2019 & 2032
- Table 41: Global Military Radars Industry Revenue Million Forecast, by Consumption Analysis 2019 & 2032
- Table 42: Global Military Radars Industry Revenue Million Forecast, by Import Market Analysis (Value & Volume) 2019 & 2032
- Table 43: Global Military Radars Industry Revenue Million Forecast, by Export Market Analysis (Value & Volume) 2019 & 2032
- Table 44: Global Military Radars Industry Revenue Million Forecast, by Price Trend Analysis 2019 & 2032
- Table 45: Global Military Radars Industry Revenue Million Forecast, by Country 2019 & 2032
- Table 46: Brazil Military Radars Industry Revenue (Million) Forecast, by Application 2019 & 2032
- Table 47: Argentina Military Radars Industry Revenue (Million) Forecast, by Application 2019 & 2032
- Table 48: Rest of South America Military Radars Industry Revenue (Million) Forecast, by Application 2019 & 2032
- Table 49: Global Military Radars Industry Revenue Million Forecast, by Production Analysis 2019 & 2032
- Table 50: Global Military Radars Industry Revenue Million Forecast, by Consumption Analysis 2019 & 2032
- Table 51: Global Military Radars Industry Revenue Million Forecast, by Import Market Analysis (Value & Volume) 2019 & 2032
- Table 52: Global Military Radars Industry Revenue Million Forecast, by Export Market Analysis (Value & Volume) 2019 & 2032
- Table 53: Global Military Radars Industry Revenue Million Forecast, by Price Trend Analysis 2019 & 2032
- Table 54: Global Military Radars Industry Revenue Million Forecast, by Country 2019 & 2032
- Table 55: United Kingdom Military Radars Industry Revenue (Million) Forecast, by Application 2019 & 2032
- Table 56: Germany Military Radars Industry Revenue (Million) Forecast, by Application 2019 & 2032
- Table 57: France Military Radars Industry Revenue (Million) Forecast, by Application 2019 & 2032
- Table 58: Italy Military Radars Industry Revenue (Million) Forecast, by Application 2019 & 2032
- Table 59: Spain Military Radars Industry Revenue (Million) Forecast, by Application 2019 & 2032
- Table 60: Russia Military Radars Industry Revenue (Million) Forecast, by Application 2019 & 2032
- Table 61: Benelux Military Radars Industry Revenue (Million) Forecast, by Application 2019 & 2032
- Table 62: Nordics Military Radars Industry Revenue (Million) Forecast, by Application 2019 & 2032
- Table 63: Rest of Europe Military Radars Industry Revenue (Million) Forecast, by Application 2019 & 2032
- Table 64: Global Military Radars Industry Revenue Million Forecast, by Production Analysis 2019 & 2032
- Table 65: Global Military Radars Industry Revenue Million Forecast, by Consumption Analysis 2019 & 2032
- Table 66: Global Military Radars Industry Revenue Million Forecast, by Import Market Analysis (Value & Volume) 2019 & 2032
- Table 67: Global Military Radars Industry Revenue Million Forecast, by Export Market Analysis (Value & Volume) 2019 & 2032
- Table 68: Global Military Radars Industry Revenue Million Forecast, by Price Trend Analysis 2019 & 2032
- Table 69: Global Military Radars Industry Revenue Million Forecast, by Country 2019 & 2032
- Table 70: Turkey Military Radars Industry Revenue (Million) Forecast, by Application 2019 & 2032
- Table 71: Israel Military Radars Industry Revenue (Million) Forecast, by Application 2019 & 2032
- Table 72: GCC Military Radars Industry Revenue (Million) Forecast, by Application 2019 & 2032
- Table 73: North Africa Military Radars Industry Revenue (Million) Forecast, by Application 2019 & 2032
- Table 74: South Africa Military Radars Industry Revenue (Million) Forecast, by Application 2019 & 2032
- Table 75: Rest of Middle East & Africa Military Radars Industry Revenue (Million) Forecast, by Application 2019 & 2032
- Table 76: Global Military Radars Industry Revenue Million Forecast, by Production Analysis 2019 & 2032
- Table 77: Global Military Radars Industry Revenue Million Forecast, by Consumption Analysis 2019 & 2032
- Table 78: Global Military Radars Industry Revenue Million Forecast, by Import Market Analysis (Value & Volume) 2019 & 2032
- Table 79: Global Military Radars Industry Revenue Million Forecast, by Export Market Analysis (Value & Volume) 2019 & 2032
- Table 80: Global Military Radars Industry Revenue Million Forecast, by Price Trend Analysis 2019 & 2032
- Table 81: Global Military Radars Industry Revenue Million Forecast, by Country 2019 & 2032
- Table 82: China Military Radars Industry Revenue (Million) Forecast, by Application 2019 & 2032
- Table 83: India Military Radars Industry Revenue (Million) Forecast, by Application 2019 & 2032
- Table 84: Japan Military Radars Industry Revenue (Million) Forecast, by Application 2019 & 2032
- Table 85: South Korea Military Radars Industry Revenue (Million) Forecast, by Application 2019 & 2032
- Table 86: ASEAN Military Radars Industry Revenue (Million) Forecast, by Application 2019 & 2032
- Table 87: Oceania Military Radars Industry Revenue (Million) Forecast, by Application 2019 & 2032
- Table 88: Rest of Asia Pacific Military Radars Industry Revenue (Million) Forecast, by Application 2019 & 2032
Frequently Asked Questions
1. What is the projected Compound Annual Growth Rate (CAGR) of the Military Radars Industry?
The projected CAGR is approximately 5.15%.
2. Which companies are prominent players in the Military Radars Industry?
Key companies in the market include THALES, Leonardo SpA, Lockheed Martin Corporation, Airbus SE, QinetiQ Group PL, Teledyne Technologies Incorporated, BAE Systems PLC, RTX Corporation, HENSOLDT Holding Germany GmbH, Israel Aerospace Industries Ltd, Northrop Grumman Corporation, Saab AB.
3. What are the main segments of the Military Radars Industry?
The market segments include Production Analysis, Consumption Analysis, Import Market Analysis (Value & Volume), Export Market Analysis (Value & Volume), Price Trend Analysis.
4. Can you provide details about the market size?
The market size is estimated to be USD 16.71 Million as of 2022.
5. What are some drivers contributing to market growth?
Increase in Internet of Things (IoT) and Autonomous Systems; Rise in Demand for Military and Defense Satellite Communication Solutions.
6. What are the notable trends driving market growth?
Airborne Segment Expected to Register the Highest CAGR During the Forecast Period.
7. Are there any restraints impacting market growth?
Cybersecurity Threats to Satellite Communication; Interference in Transmission of Data.
8. Can you provide examples of recent developments in the market?
N/A
9. What pricing options are available for accessing the report?
Pricing options include single-user, multi-user, and enterprise licenses priced at USD 4750, USD 5250, and USD 8750 respectively.
10. Is the market size provided in terms of value or volume?
The market size is provided in terms of value, measured in Million.
11. Are there any specific market keywords associated with the report?
Yes, the market keyword associated with the report is "Military Radars Industry," which aids in identifying and referencing the specific market segment covered.
12. How do I determine which pricing option suits my needs best?
The pricing options vary based on user requirements and access needs. Individual users may opt for single-user licenses, while businesses requiring broader access may choose multi-user or enterprise licenses for cost-effective access to the report.
13. Are there any additional resources or data provided in the Military Radars Industry report?
While the report offers comprehensive insights, it's advisable to review the specific contents or supplementary materials provided to ascertain if additional resources or data are available.
14. How can I stay updated on further developments or reports in the Military Radars Industry?
To stay informed about further developments, trends, and reports in the Military Radars Industry, consider subscribing to industry newsletters, following relevant companies and organizations, or regularly checking reputable industry news sources and publications.
Methodology
Step 1 - Identification of Relevant Samples Size from Population Database


Step 2 - Approaches for Defining Global Market Size (Value, Volume* & Price*)

Note*: In applicable scenarios
Step 3 - Data Sources
Primary Research
- Web Analytics
- Survey Reports
- Research Institute
- Latest Research Reports
- Opinion Leaders
Secondary Research
- Annual Reports
- White Paper
- Latest Press Release
- Industry Association
- Paid Database
- Investor Presentations

Step 4 - Data Triangulation
Involves using different sources of information in order to increase the validity of a study
These sources are likely to be stakeholders in a program - participants, other researchers, program staff, other community members, and so on.
Then we put all data in single framework & apply various statistical tools to find out the dynamic on the market.
During the analysis stage, feedback from the stakeholder groups would be compared to determine areas of agreement as well as areas of divergence
