

Key Insights
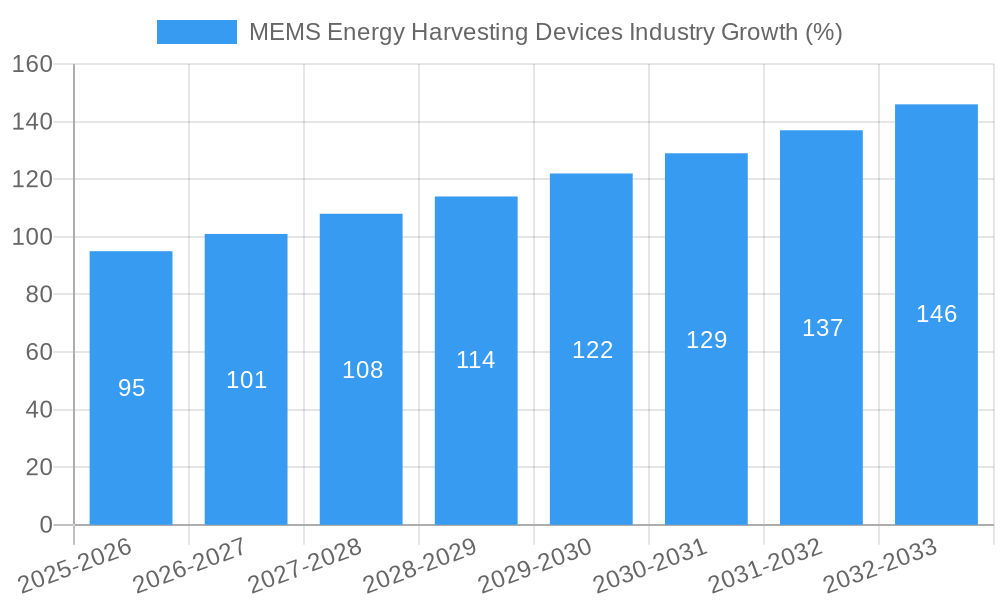
The MEMS Energy Harvesting Devices market is experiencing robust growth, projected to reach a significant value by 2033, driven by increasing demand for self-powered and low-maintenance electronic devices across diverse sectors. The 6.37% CAGR from 2019-2024 indicates a consistent upward trend, fueled by technological advancements in energy harvesting techniques, particularly in vibration and thermal energy harvesting. Miniaturization and improved energy conversion efficiency of MEMS devices are key factors contributing to their wider adoption. The automotive industry is a primary driver, with significant opportunities in applications like tire pressure monitoring systems and engine sensors. The burgeoning Internet of Things (IoT) and the need for powering remote sensors are further boosting market growth. While challenges remain in terms of energy density and power output limitations, ongoing research and development efforts are continually overcoming these obstacles, leading to the creation of more efficient and powerful MEMS energy harvesting devices. Growth is also anticipated in the industrial sector, driven by the need for self-powered monitoring and automation systems, as well as in building and home automation, where low-power sensors are increasingly deployed for security and energy management.
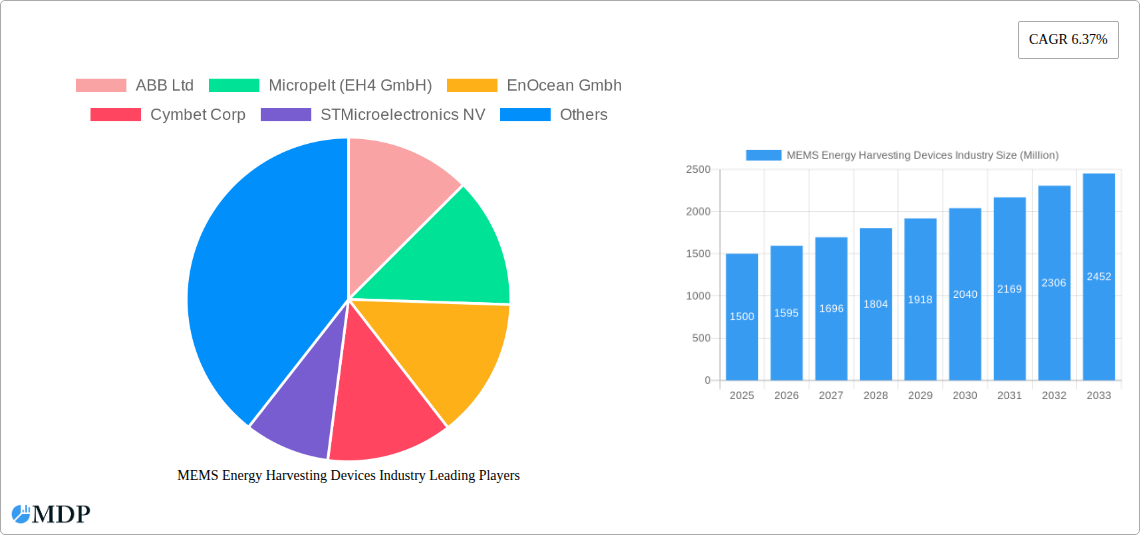
The segmentation by technology reveals a strong focus on vibration and thermal energy harvesting, with RF energy harvesting also exhibiting promising growth potential. Geographically, North America and Europe currently hold significant market shares, but the Asia-Pacific region is expected to witness substantial growth in the coming years, fueled by rapid industrialization and expanding electronics manufacturing. Established players like ABB Ltd and STMicroelectronics are driving innovation and competition, while smaller companies are contributing niche technologies and specialized applications. The forecast period (2025-2033) promises continued expansion, with advancements in material science and integration techniques paving the way for higher energy conversion efficiencies and broader application possibilities. This overall growth trajectory positions MEMS energy harvesting as a critical technology for enabling the next generation of autonomous and sustainable electronic systems.
MEMS Energy Harvesting Devices Industry Report: 2019-2033
This comprehensive report provides a detailed analysis of the MEMS Energy Harvesting Devices market, offering actionable insights for stakeholders across the value chain. With a study period spanning 2019-2033, a base year of 2025, and a forecast period of 2025-2033, this report leverages historical data (2019-2024) to project future market trends and growth potential. The market is segmented by technology (Vibration, Thermal, RF, Other) and end-user applications (Automotive, Industrial, Military & Aerospace, Building & Home Automation, Consumer Electronics, Other). Key players like ABB Ltd, Micropelt (EH4 GmbH), EnOcean GmbH, Cymbet Corp, STMicroelectronics NV, Analog Devices Inc, and Coventor Inc (Lam Research Corporation) are analyzed for their market share, strategies, and innovations. The report projects a market valuation exceeding xx Million by 2033.
MEMS Energy Harvesting Devices Industry Market Dynamics & Concentration
The MEMS energy harvesting devices market is characterized by moderate concentration, with a few major players holding significant market share. However, the market is also witnessing increased competition from new entrants, particularly in niche applications. Innovation is a key driver, with companies continually developing more efficient and cost-effective energy harvesting technologies. Regulatory frameworks, particularly those related to environmental sustainability and energy efficiency, are increasingly influencing market growth. Product substitutes, such as traditional batteries, continue to pose a challenge, but the advantages of energy harvesting in terms of sustainability and reduced maintenance are driving adoption. End-user trends, such as the increasing demand for IoT devices and autonomous systems, are fueling market growth. The market has seen a moderate level of M&A activity in recent years, with xx deals recorded between 2019 and 2024, indicating consolidation and strategic expansion within the sector. Key players are focusing on partnerships and collaborations to expand their market reach and technological capabilities. Market share data for major players is detailed in section 9.
- Market Concentration: Moderately concentrated, with top 5 players holding approximately xx% market share in 2024.
- Innovation Drivers: Advancements in MEMS technology, materials science, and power management ICs.
- Regulatory Frameworks: Government incentives for energy efficiency and renewable energy technologies.
- Product Substitutes: Traditional batteries and wired power supplies.
- End-User Trends: Growing demand for IoT devices, wireless sensors, and autonomous systems.
- M&A Activity: xx M&A deals recorded between 2019 and 2024.
MEMS Energy Harvesting Devices Industry Industry Trends & Analysis
The MEMS energy harvesting devices market is experiencing robust growth, driven by several key factors. The global market is projected to reach xx Million by 2033, with a CAGR of xx% during the forecast period (2025-2033). Technological advancements, particularly in miniaturization and efficiency, are enabling wider adoption across various applications. Consumer preferences are shifting towards sustainable and low-maintenance solutions, further boosting the market. Competitive dynamics are intensifying, with companies investing heavily in R&D to develop innovative products and expand their market share. Market penetration is highest in the automotive and industrial sectors, but significant growth is anticipated in consumer electronics and building automation.
Leading Markets & Segments in MEMS Energy Harvesting Devices Industry
The dominant region for MEMS energy harvesting devices is North America, followed by Europe and Asia-Pacific. Within these regions, specific countries like the US, Germany, and Japan are key markets due to robust industrial sectors and government support for renewable energy technologies.
By Technology:
- Vibration Energy Harvesting: This segment holds the largest market share due to its suitability for various applications, including automotive and industrial. Key drivers include advancements in piezoelectric and electromagnetic materials, enabling higher energy conversion efficiency.
- Thermal Energy Harvesting: This segment shows significant growth potential driven by the increasing adoption of waste heat recovery systems.
- RF Energy Harvesting: Growing demand for wireless sensors and IoT devices fuels the growth of this segment. Challenges include limited range and power output.
- Other Types of Energy Harvesting: This segment comprises emerging technologies, such as solar and light energy harvesting.
By End-user Applications:
- Automotive: High market share driven by the demand for battery-free sensors and actuators in vehicles. Key drivers include increased fuel efficiency regulations and advancements in autonomous driving technology.
- Industrial: Significant market share due to the need for remote monitoring and maintenance of industrial equipment.
- Military and Aerospace: High growth potential driven by the need for self-powered sensors and communication devices in harsh environments.
- Building and Home Automation: Growing demand for smart homes and energy-efficient buildings is driving market growth.
- Consumer Electronics: Increasing adoption of wearable devices and other battery-free consumer electronics products boosts market share.
MEMS Energy Harvesting Devices Industry Product Developments
Recent product innovations focus on increasing efficiency, miniaturization, and expanding applications. Companies are developing more robust and reliable devices, capable of operating in harsh environments. The integration of advanced power management ICs is improving energy conversion efficiency and extending battery life. The development of multi-source energy harvesting devices is gaining traction, allowing for energy harvesting from multiple sources simultaneously. This improves overall reliability and extends operational life in resource-scarce environments.
Key Drivers of MEMS Energy Harvesting Devices Industry Growth
The MEMS energy harvesting devices market is experiencing rapid growth due to several factors: The increasing demand for wireless sensor networks and IoT devices requires low-power, self-powered solutions, making energy harvesting a crucial technology. Government regulations promoting energy efficiency and environmental sustainability are providing further impetus to the market. Technological advancements, such as improvements in MEMS fabrication techniques and materials science, are driving efficiency and cost reductions. The growing adoption of electric and hybrid vehicles is fueling the demand for energy harvesting devices in the automotive industry.
Challenges in the MEMS Energy Harvesting Devices Industry Market
Despite the growth potential, challenges remain. The relatively low power output of MEMS energy harvesting devices compared to traditional batteries is a limiting factor. Supply chain disruptions can impact the availability of critical components, affecting production and delivery times. High initial costs and complexities in integration can hinder adoption, especially in price-sensitive markets. Competition from traditional power sources and emerging technologies also poses a challenge. These factors contribute to market growth restrictions and need thorough evaluation to develop impactful solutions.
Emerging Opportunities in MEMS Energy Harvesting Devices Industry
The long-term growth of the MEMS energy harvesting devices market is promising. Technological breakthroughs, such as the development of novel materials with enhanced energy conversion efficiencies, will continue to expand applications. Strategic partnerships between MEMS device manufacturers and system integrators are crucial to accelerating market adoption. Market expansion into new applications, such as medical implants and environmental monitoring, presents substantial opportunities. The continuous improvement in energy conversion efficiency and reduction of production costs will make energy harvesting a more attractive option across diverse industries.
Leading Players in the MEMS Energy Harvesting Devices Industry Sector
- ABB Ltd
- Micropelt (EH4 GmbH)
- EnOcean GmbH
- Cymbet Corp
- STMicroelectronics NV
- Analog Devices Inc
- Coventor Inc (Lam Research Corporation)
Key Milestones in MEMS Energy Harvesting Devices Industry Industry
- February 2023: Asahi Kasei Microdevices (AKM) launched a new DC-DC step-up converter for efficient energy harvesting applications, enabling remote and battery-free operation for IoT devices.
- January 2023: WePower Technologies launched the Gemns Energy Harvesting Generator (EHG) product line, offering scalable kinetic energy harvesting solutions for wireless IoT sensors.
Strategic Outlook for MEMS Energy Harvesting Devices Industry Market
The MEMS energy harvesting devices market is poised for significant growth over the next decade. Continued technological advancements, increasing demand for wireless and autonomous systems, and supportive government policies will drive market expansion. Strategic partnerships, focusing on integration and application development, will be essential for success. Companies that can effectively address the challenges of low power output and high initial costs will capture significant market share. The market presents significant opportunities for companies capable of innovation and strategic adaptation in this growing sector.
MEMS Energy Harvesting Devices Industry Segmentation
-
1. Technology
- 1.1. Vibration Energy Harvesting
- 1.2. Thermal Energy Harvesting
- 1.3. RF Energy Harvesting
- 1.4. Other Types of Energy Harvesting
-
2. End-user Applications
- 2.1. Automotive
- 2.2. Industrial
- 2.3. Military and Aerospace
- 2.4. Building and Home Automation
- 2.5. Consumer Electronics
- 2.6. Other End-user Applications
MEMS Energy Harvesting Devices Industry Segmentation By Geography
- 1. North America
- 2. Europe
- 3. Asia Pacific
- 4. Rest of the World

MEMS Energy Harvesting Devices Industry REPORT HIGHLIGHTS
| Aspects | Details |
|---|---|
| Study Period | 2019-2033 |
| Base Year | 2024 |
| Estimated Year | 2025 |
| Forecast Period | 2025-2033 |
| Historical Period | 2019-2024 |
| Growth Rate | CAGR of 6.37% from 2019-2033 |
| Segmentation |
|
Table of Contents
- 1. Introduction
- 1.1. Research Scope
- 1.2. Market Segmentation
- 1.3. Research Methodology
- 1.4. Definitions and Assumptions
- 2. Executive Summary
- 2.1. Introduction
- 3. Market Dynamics
- 3.1. Introduction
- 3.2. Market Drivers
- 3.2.1. Growth of Smart Cities; Commercial Applications are Slowly Getting into the Market for Industrial Applications and Home Automation Appliances
- 3.3. Market Restrains
- 3.3.1. Ultra Low Power Electronics; Wireless Data Transmissions Rates and Standards
- 3.4. Market Trends
- 3.4.1. Building and Home Automation to Hold Major Share
- 4. Market Factor Analysis
- 4.1. Porters Five Forces
- 4.2. Supply/Value Chain
- 4.3. PESTEL analysis
- 4.4. Market Entropy
- 4.5. Patent/Trademark Analysis
- 5. MEMS Energy Harvesting Devices Industry Analysis, Insights and Forecast, 2019-2031
- 5.1. Market Analysis, Insights and Forecast - by Technology
- 5.1.1. Vibration Energy Harvesting
- 5.1.2. Thermal Energy Harvesting
- 5.1.3. RF Energy Harvesting
- 5.1.4. Other Types of Energy Harvesting
- 5.2. Market Analysis, Insights and Forecast - by End-user Applications
- 5.2.1. Automotive
- 5.2.2. Industrial
- 5.2.3. Military and Aerospace
- 5.2.4. Building and Home Automation
- 5.2.5. Consumer Electronics
- 5.2.6. Other End-user Applications
- 5.3. Market Analysis, Insights and Forecast - by Region
- 5.3.1. North America
- 5.3.2. Europe
- 5.3.3. Asia Pacific
- 5.3.4. Rest of the World
- 5.1. Market Analysis, Insights and Forecast - by Technology
- 6. North America MEMS Energy Harvesting Devices Industry Analysis, Insights and Forecast, 2019-2031
- 6.1. Market Analysis, Insights and Forecast - by Technology
- 6.1.1. Vibration Energy Harvesting
- 6.1.2. Thermal Energy Harvesting
- 6.1.3. RF Energy Harvesting
- 6.1.4. Other Types of Energy Harvesting
- 6.2. Market Analysis, Insights and Forecast - by End-user Applications
- 6.2.1. Automotive
- 6.2.2. Industrial
- 6.2.3. Military and Aerospace
- 6.2.4. Building and Home Automation
- 6.2.5. Consumer Electronics
- 6.2.6. Other End-user Applications
- 6.1. Market Analysis, Insights and Forecast - by Technology
- 7. Europe MEMS Energy Harvesting Devices Industry Analysis, Insights and Forecast, 2019-2031
- 7.1. Market Analysis, Insights and Forecast - by Technology
- 7.1.1. Vibration Energy Harvesting
- 7.1.2. Thermal Energy Harvesting
- 7.1.3. RF Energy Harvesting
- 7.1.4. Other Types of Energy Harvesting
- 7.2. Market Analysis, Insights and Forecast - by End-user Applications
- 7.2.1. Automotive
- 7.2.2. Industrial
- 7.2.3. Military and Aerospace
- 7.2.4. Building and Home Automation
- 7.2.5. Consumer Electronics
- 7.2.6. Other End-user Applications
- 7.1. Market Analysis, Insights and Forecast - by Technology
- 8. Asia Pacific MEMS Energy Harvesting Devices Industry Analysis, Insights and Forecast, 2019-2031
- 8.1. Market Analysis, Insights and Forecast - by Technology
- 8.1.1. Vibration Energy Harvesting
- 8.1.2. Thermal Energy Harvesting
- 8.1.3. RF Energy Harvesting
- 8.1.4. Other Types of Energy Harvesting
- 8.2. Market Analysis, Insights and Forecast - by End-user Applications
- 8.2.1. Automotive
- 8.2.2. Industrial
- 8.2.3. Military and Aerospace
- 8.2.4. Building and Home Automation
- 8.2.5. Consumer Electronics
- 8.2.6. Other End-user Applications
- 8.1. Market Analysis, Insights and Forecast - by Technology
- 9. Rest of the World MEMS Energy Harvesting Devices Industry Analysis, Insights and Forecast, 2019-2031
- 9.1. Market Analysis, Insights and Forecast - by Technology
- 9.1.1. Vibration Energy Harvesting
- 9.1.2. Thermal Energy Harvesting
- 9.1.3. RF Energy Harvesting
- 9.1.4. Other Types of Energy Harvesting
- 9.2. Market Analysis, Insights and Forecast - by End-user Applications
- 9.2.1. Automotive
- 9.2.2. Industrial
- 9.2.3. Military and Aerospace
- 9.2.4. Building and Home Automation
- 9.2.5. Consumer Electronics
- 9.2.6. Other End-user Applications
- 9.1. Market Analysis, Insights and Forecast - by Technology
- 10. North America MEMS Energy Harvesting Devices Industry Analysis, Insights and Forecast, 2019-2031
- 10.1. Market Analysis, Insights and Forecast - By Country/Sub-region
- 10.1.1 United States
- 10.1.2 Canada
- 10.1.3 Mexico
- 11. Europe MEMS Energy Harvesting Devices Industry Analysis, Insights and Forecast, 2019-2031
- 11.1. Market Analysis, Insights and Forecast - By Country/Sub-region
- 11.1.1 Germany
- 11.1.2 United Kingdom
- 11.1.3 France
- 11.1.4 Spain
- 11.1.5 Italy
- 11.1.6 Spain
- 11.1.7 Belgium
- 11.1.8 Netherland
- 11.1.9 Nordics
- 11.1.10 Rest of Europe
- 12. Asia Pacific MEMS Energy Harvesting Devices Industry Analysis, Insights and Forecast, 2019-2031
- 12.1. Market Analysis, Insights and Forecast - By Country/Sub-region
- 12.1.1 China
- 12.1.2 Japan
- 12.1.3 India
- 12.1.4 South Korea
- 12.1.5 Southeast Asia
- 12.1.6 Australia
- 12.1.7 Indonesia
- 12.1.8 Phillipes
- 12.1.9 Singapore
- 12.1.10 Thailandc
- 12.1.11 Rest of Asia Pacific
- 13. South America MEMS Energy Harvesting Devices Industry Analysis, Insights and Forecast, 2019-2031
- 13.1. Market Analysis, Insights and Forecast - By Country/Sub-region
- 13.1.1 Brazil
- 13.1.2 Argentina
- 13.1.3 Peru
- 13.1.4 Chile
- 13.1.5 Colombia
- 13.1.6 Ecuador
- 13.1.7 Venezuela
- 13.1.8 Rest of South America
- 14. North America MEMS Energy Harvesting Devices Industry Analysis, Insights and Forecast, 2019-2031
- 14.1. Market Analysis, Insights and Forecast - By Country/Sub-region
- 14.1.1 United States
- 14.1.2 Canada
- 14.1.3 Mexico
- 15. MEA MEMS Energy Harvesting Devices Industry Analysis, Insights and Forecast, 2019-2031
- 15.1. Market Analysis, Insights and Forecast - By Country/Sub-region
- 15.1.1 United Arab Emirates
- 15.1.2 Saudi Arabia
- 15.1.3 South Africa
- 15.1.4 Rest of Middle East and Africa
- 16. Competitive Analysis
- 16.1. Market Share Analysis 2024
- 16.2. Company Profiles
- 16.2.1 ABB Ltd
- 16.2.1.1. Overview
- 16.2.1.2. Products
- 16.2.1.3. SWOT Analysis
- 16.2.1.4. Recent Developments
- 16.2.1.5. Financials (Based on Availability)
- 16.2.2 Micropelt (EH4 GmbH)
- 16.2.2.1. Overview
- 16.2.2.2. Products
- 16.2.2.3. SWOT Analysis
- 16.2.2.4. Recent Developments
- 16.2.2.5. Financials (Based on Availability)
- 16.2.3 EnOcean Gmbh
- 16.2.3.1. Overview
- 16.2.3.2. Products
- 16.2.3.3. SWOT Analysis
- 16.2.3.4. Recent Developments
- 16.2.3.5. Financials (Based on Availability)
- 16.2.4 Cymbet Corp
- 16.2.4.1. Overview
- 16.2.4.2. Products
- 16.2.4.3. SWOT Analysis
- 16.2.4.4. Recent Developments
- 16.2.4.5. Financials (Based on Availability)
- 16.2.5 STMicroelectronics NV
- 16.2.5.1. Overview
- 16.2.5.2. Products
- 16.2.5.3. SWOT Analysis
- 16.2.5.4. Recent Developments
- 16.2.5.5. Financials (Based on Availability)
- 16.2.6 Analog Devices Inc
- 16.2.6.1. Overview
- 16.2.6.2. Products
- 16.2.6.3. SWOT Analysis
- 16.2.6.4. Recent Developments
- 16.2.6.5. Financials (Based on Availability)
- 16.2.7 Coventor Inc (Lam Research Corporation)
- 16.2.7.1. Overview
- 16.2.7.2. Products
- 16.2.7.3. SWOT Analysis
- 16.2.7.4. Recent Developments
- 16.2.7.5. Financials (Based on Availability)
- 16.2.1 ABB Ltd
List of Figures
- Figure 1: MEMS Energy Harvesting Devices Industry Revenue Breakdown (Million, %) by Product 2024 & 2032
- Figure 2: MEMS Energy Harvesting Devices Industry Share (%) by Company 2024
List of Tables
- Table 1: MEMS Energy Harvesting Devices Industry Revenue Million Forecast, by Region 2019 & 2032
- Table 2: MEMS Energy Harvesting Devices Industry Volume K Unit Forecast, by Region 2019 & 2032
- Table 3: MEMS Energy Harvesting Devices Industry Revenue Million Forecast, by Technology 2019 & 2032
- Table 4: MEMS Energy Harvesting Devices Industry Volume K Unit Forecast, by Technology 2019 & 2032
- Table 5: MEMS Energy Harvesting Devices Industry Revenue Million Forecast, by End-user Applications 2019 & 2032
- Table 6: MEMS Energy Harvesting Devices Industry Volume K Unit Forecast, by End-user Applications 2019 & 2032
- Table 7: MEMS Energy Harvesting Devices Industry Revenue Million Forecast, by Region 2019 & 2032
- Table 8: MEMS Energy Harvesting Devices Industry Volume K Unit Forecast, by Region 2019 & 2032
- Table 9: MEMS Energy Harvesting Devices Industry Revenue Million Forecast, by Country 2019 & 2032
- Table 10: MEMS Energy Harvesting Devices Industry Volume K Unit Forecast, by Country 2019 & 2032
- Table 11: United States MEMS Energy Harvesting Devices Industry Revenue (Million) Forecast, by Application 2019 & 2032
- Table 12: United States MEMS Energy Harvesting Devices Industry Volume (K Unit) Forecast, by Application 2019 & 2032
- Table 13: Canada MEMS Energy Harvesting Devices Industry Revenue (Million) Forecast, by Application 2019 & 2032
- Table 14: Canada MEMS Energy Harvesting Devices Industry Volume (K Unit) Forecast, by Application 2019 & 2032
- Table 15: Mexico MEMS Energy Harvesting Devices Industry Revenue (Million) Forecast, by Application 2019 & 2032
- Table 16: Mexico MEMS Energy Harvesting Devices Industry Volume (K Unit) Forecast, by Application 2019 & 2032
- Table 17: MEMS Energy Harvesting Devices Industry Revenue Million Forecast, by Country 2019 & 2032
- Table 18: MEMS Energy Harvesting Devices Industry Volume K Unit Forecast, by Country 2019 & 2032
- Table 19: Germany MEMS Energy Harvesting Devices Industry Revenue (Million) Forecast, by Application 2019 & 2032
- Table 20: Germany MEMS Energy Harvesting Devices Industry Volume (K Unit) Forecast, by Application 2019 & 2032
- Table 21: United Kingdom MEMS Energy Harvesting Devices Industry Revenue (Million) Forecast, by Application 2019 & 2032
- Table 22: United Kingdom MEMS Energy Harvesting Devices Industry Volume (K Unit) Forecast, by Application 2019 & 2032
- Table 23: France MEMS Energy Harvesting Devices Industry Revenue (Million) Forecast, by Application 2019 & 2032
- Table 24: France MEMS Energy Harvesting Devices Industry Volume (K Unit) Forecast, by Application 2019 & 2032
- Table 25: Spain MEMS Energy Harvesting Devices Industry Revenue (Million) Forecast, by Application 2019 & 2032
- Table 26: Spain MEMS Energy Harvesting Devices Industry Volume (K Unit) Forecast, by Application 2019 & 2032
- Table 27: Italy MEMS Energy Harvesting Devices Industry Revenue (Million) Forecast, by Application 2019 & 2032
- Table 28: Italy MEMS Energy Harvesting Devices Industry Volume (K Unit) Forecast, by Application 2019 & 2032
- Table 29: Spain MEMS Energy Harvesting Devices Industry Revenue (Million) Forecast, by Application 2019 & 2032
- Table 30: Spain MEMS Energy Harvesting Devices Industry Volume (K Unit) Forecast, by Application 2019 & 2032
- Table 31: Belgium MEMS Energy Harvesting Devices Industry Revenue (Million) Forecast, by Application 2019 & 2032
- Table 32: Belgium MEMS Energy Harvesting Devices Industry Volume (K Unit) Forecast, by Application 2019 & 2032
- Table 33: Netherland MEMS Energy Harvesting Devices Industry Revenue (Million) Forecast, by Application 2019 & 2032
- Table 34: Netherland MEMS Energy Harvesting Devices Industry Volume (K Unit) Forecast, by Application 2019 & 2032
- Table 35: Nordics MEMS Energy Harvesting Devices Industry Revenue (Million) Forecast, by Application 2019 & 2032
- Table 36: Nordics MEMS Energy Harvesting Devices Industry Volume (K Unit) Forecast, by Application 2019 & 2032
- Table 37: Rest of Europe MEMS Energy Harvesting Devices Industry Revenue (Million) Forecast, by Application 2019 & 2032
- Table 38: Rest of Europe MEMS Energy Harvesting Devices Industry Volume (K Unit) Forecast, by Application 2019 & 2032
- Table 39: MEMS Energy Harvesting Devices Industry Revenue Million Forecast, by Country 2019 & 2032
- Table 40: MEMS Energy Harvesting Devices Industry Volume K Unit Forecast, by Country 2019 & 2032
- Table 41: China MEMS Energy Harvesting Devices Industry Revenue (Million) Forecast, by Application 2019 & 2032
- Table 42: China MEMS Energy Harvesting Devices Industry Volume (K Unit) Forecast, by Application 2019 & 2032
- Table 43: Japan MEMS Energy Harvesting Devices Industry Revenue (Million) Forecast, by Application 2019 & 2032
- Table 44: Japan MEMS Energy Harvesting Devices Industry Volume (K Unit) Forecast, by Application 2019 & 2032
- Table 45: India MEMS Energy Harvesting Devices Industry Revenue (Million) Forecast, by Application 2019 & 2032
- Table 46: India MEMS Energy Harvesting Devices Industry Volume (K Unit) Forecast, by Application 2019 & 2032
- Table 47: South Korea MEMS Energy Harvesting Devices Industry Revenue (Million) Forecast, by Application 2019 & 2032
- Table 48: South Korea MEMS Energy Harvesting Devices Industry Volume (K Unit) Forecast, by Application 2019 & 2032
- Table 49: Southeast Asia MEMS Energy Harvesting Devices Industry Revenue (Million) Forecast, by Application 2019 & 2032
- Table 50: Southeast Asia MEMS Energy Harvesting Devices Industry Volume (K Unit) Forecast, by Application 2019 & 2032
- Table 51: Australia MEMS Energy Harvesting Devices Industry Revenue (Million) Forecast, by Application 2019 & 2032
- Table 52: Australia MEMS Energy Harvesting Devices Industry Volume (K Unit) Forecast, by Application 2019 & 2032
- Table 53: Indonesia MEMS Energy Harvesting Devices Industry Revenue (Million) Forecast, by Application 2019 & 2032
- Table 54: Indonesia MEMS Energy Harvesting Devices Industry Volume (K Unit) Forecast, by Application 2019 & 2032
- Table 55: Phillipes MEMS Energy Harvesting Devices Industry Revenue (Million) Forecast, by Application 2019 & 2032
- Table 56: Phillipes MEMS Energy Harvesting Devices Industry Volume (K Unit) Forecast, by Application 2019 & 2032
- Table 57: Singapore MEMS Energy Harvesting Devices Industry Revenue (Million) Forecast, by Application 2019 & 2032
- Table 58: Singapore MEMS Energy Harvesting Devices Industry Volume (K Unit) Forecast, by Application 2019 & 2032
- Table 59: Thailandc MEMS Energy Harvesting Devices Industry Revenue (Million) Forecast, by Application 2019 & 2032
- Table 60: Thailandc MEMS Energy Harvesting Devices Industry Volume (K Unit) Forecast, by Application 2019 & 2032
- Table 61: Rest of Asia Pacific MEMS Energy Harvesting Devices Industry Revenue (Million) Forecast, by Application 2019 & 2032
- Table 62: Rest of Asia Pacific MEMS Energy Harvesting Devices Industry Volume (K Unit) Forecast, by Application 2019 & 2032
- Table 63: MEMS Energy Harvesting Devices Industry Revenue Million Forecast, by Country 2019 & 2032
- Table 64: MEMS Energy Harvesting Devices Industry Volume K Unit Forecast, by Country 2019 & 2032
- Table 65: Brazil MEMS Energy Harvesting Devices Industry Revenue (Million) Forecast, by Application 2019 & 2032
- Table 66: Brazil MEMS Energy Harvesting Devices Industry Volume (K Unit) Forecast, by Application 2019 & 2032
- Table 67: Argentina MEMS Energy Harvesting Devices Industry Revenue (Million) Forecast, by Application 2019 & 2032
- Table 68: Argentina MEMS Energy Harvesting Devices Industry Volume (K Unit) Forecast, by Application 2019 & 2032
- Table 69: Peru MEMS Energy Harvesting Devices Industry Revenue (Million) Forecast, by Application 2019 & 2032
- Table 70: Peru MEMS Energy Harvesting Devices Industry Volume (K Unit) Forecast, by Application 2019 & 2032
- Table 71: Chile MEMS Energy Harvesting Devices Industry Revenue (Million) Forecast, by Application 2019 & 2032
- Table 72: Chile MEMS Energy Harvesting Devices Industry Volume (K Unit) Forecast, by Application 2019 & 2032
- Table 73: Colombia MEMS Energy Harvesting Devices Industry Revenue (Million) Forecast, by Application 2019 & 2032
- Table 74: Colombia MEMS Energy Harvesting Devices Industry Volume (K Unit) Forecast, by Application 2019 & 2032
- Table 75: Ecuador MEMS Energy Harvesting Devices Industry Revenue (Million) Forecast, by Application 2019 & 2032
- Table 76: Ecuador MEMS Energy Harvesting Devices Industry Volume (K Unit) Forecast, by Application 2019 & 2032
- Table 77: Venezuela MEMS Energy Harvesting Devices Industry Revenue (Million) Forecast, by Application 2019 & 2032
- Table 78: Venezuela MEMS Energy Harvesting Devices Industry Volume (K Unit) Forecast, by Application 2019 & 2032
- Table 79: Rest of South America MEMS Energy Harvesting Devices Industry Revenue (Million) Forecast, by Application 2019 & 2032
- Table 80: Rest of South America MEMS Energy Harvesting Devices Industry Volume (K Unit) Forecast, by Application 2019 & 2032
- Table 81: MEMS Energy Harvesting Devices Industry Revenue Million Forecast, by Country 2019 & 2032
- Table 82: MEMS Energy Harvesting Devices Industry Volume K Unit Forecast, by Country 2019 & 2032
- Table 83: United States MEMS Energy Harvesting Devices Industry Revenue (Million) Forecast, by Application 2019 & 2032
- Table 84: United States MEMS Energy Harvesting Devices Industry Volume (K Unit) Forecast, by Application 2019 & 2032
- Table 85: Canada MEMS Energy Harvesting Devices Industry Revenue (Million) Forecast, by Application 2019 & 2032
- Table 86: Canada MEMS Energy Harvesting Devices Industry Volume (K Unit) Forecast, by Application 2019 & 2032
- Table 87: Mexico MEMS Energy Harvesting Devices Industry Revenue (Million) Forecast, by Application 2019 & 2032
- Table 88: Mexico MEMS Energy Harvesting Devices Industry Volume (K Unit) Forecast, by Application 2019 & 2032
- Table 89: MEMS Energy Harvesting Devices Industry Revenue Million Forecast, by Country 2019 & 2032
- Table 90: MEMS Energy Harvesting Devices Industry Volume K Unit Forecast, by Country 2019 & 2032
- Table 91: United Arab Emirates MEMS Energy Harvesting Devices Industry Revenue (Million) Forecast, by Application 2019 & 2032
- Table 92: United Arab Emirates MEMS Energy Harvesting Devices Industry Volume (K Unit) Forecast, by Application 2019 & 2032
- Table 93: Saudi Arabia MEMS Energy Harvesting Devices Industry Revenue (Million) Forecast, by Application 2019 & 2032
- Table 94: Saudi Arabia MEMS Energy Harvesting Devices Industry Volume (K Unit) Forecast, by Application 2019 & 2032
- Table 95: South Africa MEMS Energy Harvesting Devices Industry Revenue (Million) Forecast, by Application 2019 & 2032
- Table 96: South Africa MEMS Energy Harvesting Devices Industry Volume (K Unit) Forecast, by Application 2019 & 2032
- Table 97: Rest of Middle East and Africa MEMS Energy Harvesting Devices Industry Revenue (Million) Forecast, by Application 2019 & 2032
- Table 98: Rest of Middle East and Africa MEMS Energy Harvesting Devices Industry Volume (K Unit) Forecast, by Application 2019 & 2032
- Table 99: MEMS Energy Harvesting Devices Industry Revenue Million Forecast, by Technology 2019 & 2032
- Table 100: MEMS Energy Harvesting Devices Industry Volume K Unit Forecast, by Technology 2019 & 2032
- Table 101: MEMS Energy Harvesting Devices Industry Revenue Million Forecast, by End-user Applications 2019 & 2032
- Table 102: MEMS Energy Harvesting Devices Industry Volume K Unit Forecast, by End-user Applications 2019 & 2032
- Table 103: MEMS Energy Harvesting Devices Industry Revenue Million Forecast, by Country 2019 & 2032
- Table 104: MEMS Energy Harvesting Devices Industry Volume K Unit Forecast, by Country 2019 & 2032
- Table 105: MEMS Energy Harvesting Devices Industry Revenue Million Forecast, by Technology 2019 & 2032
- Table 106: MEMS Energy Harvesting Devices Industry Volume K Unit Forecast, by Technology 2019 & 2032
- Table 107: MEMS Energy Harvesting Devices Industry Revenue Million Forecast, by End-user Applications 2019 & 2032
- Table 108: MEMS Energy Harvesting Devices Industry Volume K Unit Forecast, by End-user Applications 2019 & 2032
- Table 109: MEMS Energy Harvesting Devices Industry Revenue Million Forecast, by Country 2019 & 2032
- Table 110: MEMS Energy Harvesting Devices Industry Volume K Unit Forecast, by Country 2019 & 2032
- Table 111: MEMS Energy Harvesting Devices Industry Revenue Million Forecast, by Technology 2019 & 2032
- Table 112: MEMS Energy Harvesting Devices Industry Volume K Unit Forecast, by Technology 2019 & 2032
- Table 113: MEMS Energy Harvesting Devices Industry Revenue Million Forecast, by End-user Applications 2019 & 2032
- Table 114: MEMS Energy Harvesting Devices Industry Volume K Unit Forecast, by End-user Applications 2019 & 2032
- Table 115: MEMS Energy Harvesting Devices Industry Revenue Million Forecast, by Country 2019 & 2032
- Table 116: MEMS Energy Harvesting Devices Industry Volume K Unit Forecast, by Country 2019 & 2032
- Table 117: MEMS Energy Harvesting Devices Industry Revenue Million Forecast, by Technology 2019 & 2032
- Table 118: MEMS Energy Harvesting Devices Industry Volume K Unit Forecast, by Technology 2019 & 2032
- Table 119: MEMS Energy Harvesting Devices Industry Revenue Million Forecast, by End-user Applications 2019 & 2032
- Table 120: MEMS Energy Harvesting Devices Industry Volume K Unit Forecast, by End-user Applications 2019 & 2032
- Table 121: MEMS Energy Harvesting Devices Industry Revenue Million Forecast, by Country 2019 & 2032
- Table 122: MEMS Energy Harvesting Devices Industry Volume K Unit Forecast, by Country 2019 & 2032
Frequently Asked Questions
1. What is the projected Compound Annual Growth Rate (CAGR) of the MEMS Energy Harvesting Devices Industry?
The projected CAGR is approximately 6.37%.
2. Which companies are prominent players in the MEMS Energy Harvesting Devices Industry?
Key companies in the market include ABB Ltd, Micropelt (EH4 GmbH), EnOcean Gmbh, Cymbet Corp, STMicroelectronics NV, Analog Devices Inc, Coventor Inc (Lam Research Corporation).
3. What are the main segments of the MEMS Energy Harvesting Devices Industry?
The market segments include Technology, End-user Applications.
4. Can you provide details about the market size?
The market size is estimated to be USD XX Million as of 2022.
5. What are some drivers contributing to market growth?
Growth of Smart Cities; Commercial Applications are Slowly Getting into the Market for Industrial Applications and Home Automation Appliances.
6. What are the notable trends driving market growth?
Building and Home Automation to Hold Major Share.
7. Are there any restraints impacting market growth?
Ultra Low Power Electronics; Wireless Data Transmissions Rates and Standards.
8. Can you provide examples of recent developments in the market?
February 2023: Asahi Kasei Microdevices (AKM) launched a new DC-DC step-up converter for efficient energy harvesting applications. It can boost low voltages, offering remote and battery-free operation solutions and low-maintenance asset monitoring and IoT applications.
9. What pricing options are available for accessing the report?
Pricing options include single-user, multi-user, and enterprise licenses priced at USD 4750, USD 5250, and USD 8750 respectively.
10. Is the market size provided in terms of value or volume?
The market size is provided in terms of value, measured in Million and volume, measured in K Unit.
11. Are there any specific market keywords associated with the report?
Yes, the market keyword associated with the report is "MEMS Energy Harvesting Devices Industry," which aids in identifying and referencing the specific market segment covered.
12. How do I determine which pricing option suits my needs best?
The pricing options vary based on user requirements and access needs. Individual users may opt for single-user licenses, while businesses requiring broader access may choose multi-user or enterprise licenses for cost-effective access to the report.
13. Are there any additional resources or data provided in the MEMS Energy Harvesting Devices Industry report?
While the report offers comprehensive insights, it's advisable to review the specific contents or supplementary materials provided to ascertain if additional resources or data are available.
14. How can I stay updated on further developments or reports in the MEMS Energy Harvesting Devices Industry?
To stay informed about further developments, trends, and reports in the MEMS Energy Harvesting Devices Industry, consider subscribing to industry newsletters, following relevant companies and organizations, or regularly checking reputable industry news sources and publications.
Methodology
Step 1 - Identification of Relevant Samples Size from Population Database


Step 2 - Approaches for Defining Global Market Size (Value, Volume* & Price*)

Note*: In applicable scenarios
Step 3 - Data Sources
Primary Research
- Web Analytics
- Survey Reports
- Research Institute
- Latest Research Reports
- Opinion Leaders
Secondary Research
- Annual Reports
- White Paper
- Latest Press Release
- Industry Association
- Paid Database
- Investor Presentations

Step 4 - Data Triangulation
Involves using different sources of information in order to increase the validity of a study
These sources are likely to be stakeholders in a program - participants, other researchers, program staff, other community members, and so on.
Then we put all data in single framework & apply various statistical tools to find out the dynamic on the market.
During the analysis stage, feedback from the stakeholder groups would be compared to determine areas of agreement as well as areas of divergence
