

Key Insights
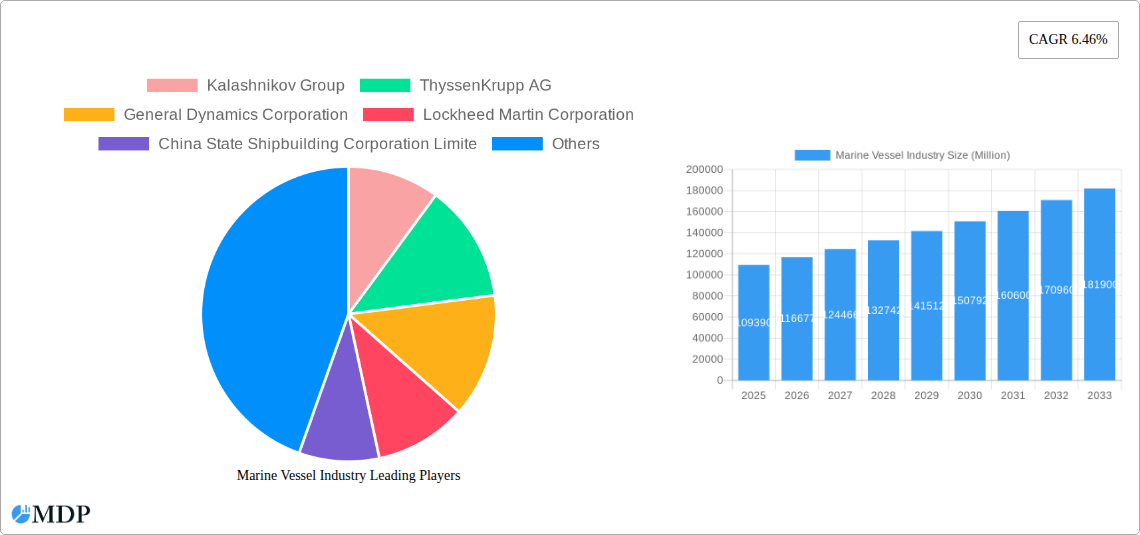
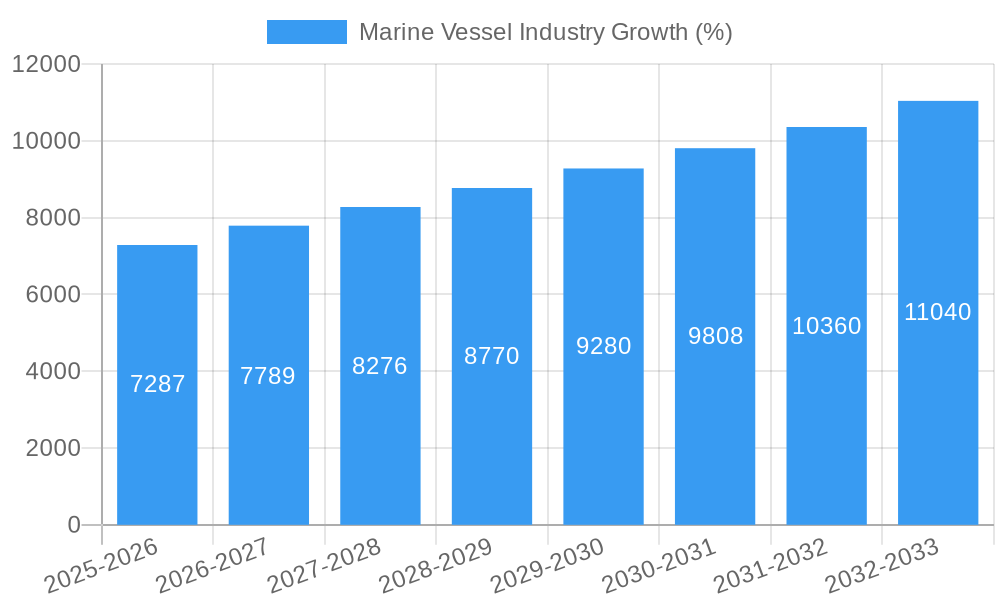
The global marine vessel industry, currently valued at $109.39 billion (2025), is projected to experience robust growth, exhibiting a compound annual growth rate (CAGR) of 6.46% from 2025 to 2033. This expansion is driven by several key factors. Increased global naval spending, particularly from nations seeking to modernize their fleets and enhance maritime security, is a significant contributor. Furthermore, the growing demand for specialized vessels, such as those used in offshore energy exploration and the burgeoning cruise industry, fuels market growth. Technological advancements, including the integration of autonomous systems and improved propulsion technologies, further enhance efficiency and operational capabilities, stimulating industry expansion. However, fluctuating commodity prices, particularly steel, and potential geopolitical instability can pose challenges to consistent growth. The industry is highly segmented by vessel type, with destroyers, frigates, submarines, and aircraft carriers representing significant market segments. Competition is fierce, with established players like Lockheed Martin, General Dynamics, and BAE Systems vying with emerging players from Asia and the Middle East, leading to continuous innovation and price competitiveness.
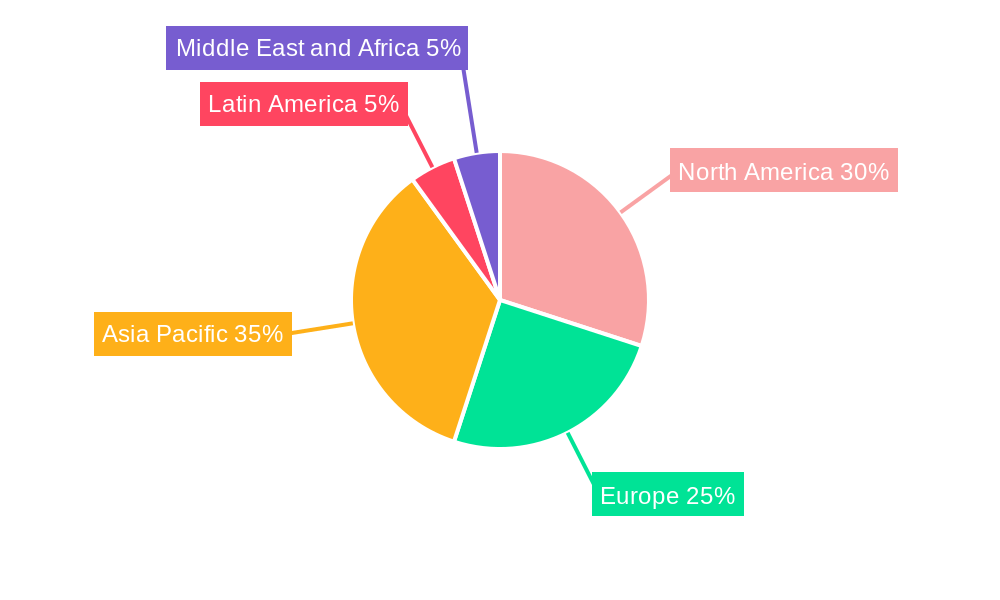
Regional market dynamics vary considerably. North America and Europe currently hold significant market shares due to established defense industries and robust maritime economies. However, the Asia-Pacific region is expected to demonstrate considerable growth, driven by rising defense budgets and expanding maritime trade. The Middle East and Africa are also showing promising growth prospects, fueled by investment in naval capabilities and offshore energy projects. The competitive landscape is defined by a mix of large multinational corporations with extensive expertise and smaller, specialized shipyards catering to niche requirements. The ongoing trend toward collaboration and mergers & acquisitions is likely to reshape the market structure in the coming years, further intensifying competition and potentially leading to consolidation.
Marine Vessel Industry Market Report: 2019-2033 Forecast
This comprehensive report provides an in-depth analysis of the global marine vessel industry, offering invaluable insights for stakeholders seeking to navigate this dynamic sector. With a study period spanning 2019-2033, a base year of 2025, and a forecast period of 2025-2033, this report leverages historical data (2019-2024) to predict future trends and opportunities. The report covers key market segments, leading players, and emerging technologies, equipping you with the knowledge needed to make informed strategic decisions. Expect detailed analysis of market size (in millions of USD), CAGR, and market share for key players.
Marine Vessel Industry Market Dynamics & Concentration
The global marine vessel industry is characterized by a moderately concentrated market structure, with a few major players commanding significant market share. The top 15 players, including Kalashnikov Group, ThyssenKrupp AG, General Dynamics Corporation, Lockheed Martin Corporation, China State Shipbuilding Corporation Limited, Fr Lurssen Werft GmbH & Co KG, Naval Group SA, BAE Systems PLC, Austal Limited, Huntington Ingalls Industries Inc, EDGE Group PJSC, HD Korea Shipbuilding & Offshore Engineering Co Ltd, Navantia SA SME, Hanwha Ocean (Hanwha Group), and FINCANTIERI SpA, collectively hold an estimated xx% of the market share in 2025. Smaller players like Damen Shipyards Group, LARSEN & TOUBRO LIMITED, PT PAL Indonesia, and others contribute to the remaining market share.
Innovation is a key driver, with companies continually investing in advanced technologies such as autonomous navigation systems, improved propulsion systems, and enhanced cybersecurity measures. Stringent regulatory frameworks, particularly concerning environmental regulations and safety standards, influence market dynamics. The industry faces competition from alternative transportation methods, such as air freight and pipelines, which present a challenge to market growth. End-user trends, driven by rising global trade and defense spending, are key growth catalysts. The industry has seen xx M&A deals in the last five years, signaling consolidation and strategic expansion.
- Market Concentration: xx% held by top 15 players in 2025.
- M&A Activity: xx deals over the past 5 years.
- Innovation Drivers: Autonomous navigation, improved propulsion, cybersecurity enhancements.
- Regulatory Frameworks: Environmental regulations and safety standards.
- Product Substitutes: Air freight, pipelines.
- End-User Trends: Growing global trade and defense expenditure.
Marine Vessel Industry Industry Trends & Analysis
The marine vessel industry is projected to witness a CAGR of xx% during the forecast period (2025-2033), driven primarily by increasing global trade volume, rising demand for naval vessels, and the adoption of advanced technologies. Market penetration of autonomous vessels is expected to reach xx% by 2033, while the market for specialized vessels is anticipated to grow at a faster rate compared to the overall market. Consumer preferences are shifting towards more sustainable and technologically advanced vessels, impacting design and production processes. Intense competition among major players fuels innovation and drives down prices. The market is witnessing significant technological disruptions, with the integration of AI, IoT, and big data analytics reshaping operational efficiency and vessel management.
Leading Markets & Segments in Marine Vessel Industry
The Asia-Pacific region is expected to dominate the marine vessel market throughout the forecast period, driven by robust economic growth, substantial investments in maritime infrastructure, and strong defense budgets. China is a key driver within this region, followed by India. Within vessel types, the demand for destroyers, frigates, and submarines remains high, particularly in defense-focused markets.
- Key Drivers in Asia-Pacific:
- Robust economic growth and increased trade.
- Significant investment in port and shipbuilding infrastructure.
- Growing defense budgets and modernization initiatives.
- Dominant Vessel Types:
- Destroyers: Driven by naval modernization programs and geopolitical factors.
- Frigates: High demand for multi-role capabilities and cost-effectiveness.
- Submarines: Strategic importance for national security.
Marine Vessel Industry Product Developments
Recent product innovations focus on enhanced fuel efficiency, improved maneuverability, and greater operational endurance. These advancements reflect a shift towards sustainable and technologically advanced vessels. The integration of AI and automation is also a key focus, with autonomous navigation systems and predictive maintenance technologies gaining traction. These innovations provide manufacturers with competitive advantages in the marketplace.
Key Drivers of Marine Vessel Industry Growth
Technological advancements (AI, automation, and advanced materials), rising global trade, increasing defense spending, and supportive government policies are the key growth drivers. For instance, the implementation of autonomous systems is expected to significantly improve efficiency and reduce operational costs, while investments in naval modernization programs fuel demand for sophisticated warships.
Challenges in the Marine Vessel Industry Market
Fluctuations in raw material prices, supply chain disruptions, stringent environmental regulations, and intense competition pose significant challenges. These factors can lead to increased production costs, delayed project timelines, and reduced profit margins. Geopolitical instability also impacts market dynamics, particularly in regions with high defense spending. For instance, the impact of supply chain disruptions in 2022–2023 resulted in an estimated xx million USD loss in revenue for the industry.
Emerging Opportunities in Marine Vessel Industry
The growing demand for offshore wind energy installations, expanding tourism, and increased exploration activities present significant opportunities. Strategic partnerships, technological breakthroughs in sustainable propulsion systems, and expansion into new geographic markets will shape future growth.
Leading Players in the Marine Vessel Industry Sector
- Kalashnikov Group
- ThyssenKrupp AG
- General Dynamics Corporation
- Lockheed Martin Corporation
- China State Shipbuilding Corporation Limited
- Fr Lurssen Werft GmbH & Co KG
- Naval Group SA
- BAE Systems PLC
- Austal Limited
- Huntington Ingalls Industries Inc
- EDGE Group PJSC
- HD Korea Shipbuilding & Offshore Engineering Co Ltd
- Navantia SA SME
- Hanwha Ocean (Hanwha Group)
- FINCANTIERI SpA
- Damen Shipyards Group
- LARSEN & TOUBRO LIMITED
- PT PAL Indonesia
Key Milestones in Marine Vessel Industry Industry
- April 2023: The UK Ministry of Defence awarded a USD 57 million contract to BAE Systems plc for C4I services for surface vessels, enhancing the company's position in the market.
- March 2023: The Indian Navy contracted Goa Shipyard (GSL) and Garden Reach Shipbuilders & Engineers (GRSE) to produce 11 offshore patrol vessels and six next-generation missile vessels, boosting domestic shipbuilding capabilities.
Strategic Outlook for Marine Vessel Industry Market
The marine vessel industry is poised for significant growth, driven by technological advancements, increasing global trade, and rising defense budgets. Strategic partnerships and investments in sustainable technologies will be key to success. The focus on autonomous vessels, improved cybersecurity, and sustainable solutions will shape the future landscape, creating opportunities for both established players and new entrants.
Marine Vessel Industry Segmentation
-
1. Vessel Type
- 1.1. Destroyers
- 1.2. Frigates
- 1.3. Submarines
- 1.4. Corvettes
- 1.5. Aircraft Carriers
- 1.6. Other Vessel Types
Marine Vessel Industry Segmentation By Geography
-
1. North America
- 1.1. United States
- 1.2. Canada
-
2. Europe
- 2.1. Germany
- 2.2. United Kingdom
- 2.3. France
- 2.4. Russia
- 2.5. Spain
- 2.6. Rest of Europe
-
3. Asia Pacific
- 3.1. China
- 3.2. India
- 3.3. Japan
- 3.4. South Korea
- 3.5. Australia
- 3.6. Singapore
- 3.7. Rest of Asia Pacific
-
4. Latin America
- 4.1. Brazil
- 4.2. Mexico
- 4.3. Rest of Latin America
-
5. Middle East and Africa
- 5.1. United Arab Emirates
- 5.2. Saudi Arabia
- 5.3. South Africa
- 5.4. Rest of Middle East and Africa
Marine Vessel Industry REPORT HIGHLIGHTS
| Aspects | Details |
|---|---|
| Study Period | 2019-2033 |
| Base Year | 2024 |
| Estimated Year | 2025 |
| Forecast Period | 2025-2033 |
| Historical Period | 2019-2024 |
| Growth Rate | CAGR of 6.46% from 2019-2033 |
| Segmentation |
|
Table of Contents
- 1. Introduction
- 1.1. Research Scope
- 1.2. Market Segmentation
- 1.3. Research Methodology
- 1.4. Definitions and Assumptions
- 2. Executive Summary
- 2.1. Introduction
- 3. Market Dynamics
- 3.1. Introduction
- 3.2. Market Drivers
- 3.3. Market Restrains
- 3.4. Market Trends
- 3.4.1. Submarines Segment is Expected to Witness Significant Growth During the Forecast Period
- 4. Market Factor Analysis
- 4.1. Porters Five Forces
- 4.2. Supply/Value Chain
- 4.3. PESTEL analysis
- 4.4. Market Entropy
- 4.5. Patent/Trademark Analysis
- 5. Global Marine Vessel Industry Analysis, Insights and Forecast, 2019-2031
- 5.1. Market Analysis, Insights and Forecast - by Vessel Type
- 5.1.1. Destroyers
- 5.1.2. Frigates
- 5.1.3. Submarines
- 5.1.4. Corvettes
- 5.1.5. Aircraft Carriers
- 5.1.6. Other Vessel Types
- 5.2. Market Analysis, Insights and Forecast - by Region
- 5.2.1. North America
- 5.2.2. Europe
- 5.2.3. Asia Pacific
- 5.2.4. Latin America
- 5.2.5. Middle East and Africa
- 5.1. Market Analysis, Insights and Forecast - by Vessel Type
- 6. North America Marine Vessel Industry Analysis, Insights and Forecast, 2019-2031
- 6.1. Market Analysis, Insights and Forecast - by Vessel Type
- 6.1.1. Destroyers
- 6.1.2. Frigates
- 6.1.3. Submarines
- 6.1.4. Corvettes
- 6.1.5. Aircraft Carriers
- 6.1.6. Other Vessel Types
- 6.1. Market Analysis, Insights and Forecast - by Vessel Type
- 7. Europe Marine Vessel Industry Analysis, Insights and Forecast, 2019-2031
- 7.1. Market Analysis, Insights and Forecast - by Vessel Type
- 7.1.1. Destroyers
- 7.1.2. Frigates
- 7.1.3. Submarines
- 7.1.4. Corvettes
- 7.1.5. Aircraft Carriers
- 7.1.6. Other Vessel Types
- 7.1. Market Analysis, Insights and Forecast - by Vessel Type
- 8. Asia Pacific Marine Vessel Industry Analysis, Insights and Forecast, 2019-2031
- 8.1. Market Analysis, Insights and Forecast - by Vessel Type
- 8.1.1. Destroyers
- 8.1.2. Frigates
- 8.1.3. Submarines
- 8.1.4. Corvettes
- 8.1.5. Aircraft Carriers
- 8.1.6. Other Vessel Types
- 8.1. Market Analysis, Insights and Forecast - by Vessel Type
- 9. Latin America Marine Vessel Industry Analysis, Insights and Forecast, 2019-2031
- 9.1. Market Analysis, Insights and Forecast - by Vessel Type
- 9.1.1. Destroyers
- 9.1.2. Frigates
- 9.1.3. Submarines
- 9.1.4. Corvettes
- 9.1.5. Aircraft Carriers
- 9.1.6. Other Vessel Types
- 9.1. Market Analysis, Insights and Forecast - by Vessel Type
- 10. Middle East and Africa Marine Vessel Industry Analysis, Insights and Forecast, 2019-2031
- 10.1. Market Analysis, Insights and Forecast - by Vessel Type
- 10.1.1. Destroyers
- 10.1.2. Frigates
- 10.1.3. Submarines
- 10.1.4. Corvettes
- 10.1.5. Aircraft Carriers
- 10.1.6. Other Vessel Types
- 10.1. Market Analysis, Insights and Forecast - by Vessel Type
- 11. North America Marine Vessel Industry Analysis, Insights and Forecast, 2019-2031
- 11.1. Market Analysis, Insights and Forecast - By Country/Sub-region
- 11.1.1 United States
- 11.1.2 Canada
- 12. Europe Marine Vessel Industry Analysis, Insights and Forecast, 2019-2031
- 12.1. Market Analysis, Insights and Forecast - By Country/Sub-region
- 12.1.1 Germany
- 12.1.2 United Kingdom
- 12.1.3 France
- 12.1.4 Russia
- 12.1.5 Spain
- 12.1.6 Rest of Europe
- 13. Asia Pacific Marine Vessel Industry Analysis, Insights and Forecast, 2019-2031
- 13.1. Market Analysis, Insights and Forecast - By Country/Sub-region
- 13.1.1 China
- 13.1.2 India
- 13.1.3 Japan
- 13.1.4 South Korea
- 13.1.5 Australia
- 13.1.6 Singapore
- 13.1.7 Rest of Asia Pacific
- 14. Latin America Marine Vessel Industry Analysis, Insights and Forecast, 2019-2031
- 14.1. Market Analysis, Insights and Forecast - By Country/Sub-region
- 14.1.1 Brazil
- 14.1.2 Mexico
- 14.1.3 Rest of Latin America
- 15. Middle East and Africa Marine Vessel Industry Analysis, Insights and Forecast, 2019-2031
- 15.1. Market Analysis, Insights and Forecast - By Country/Sub-region
- 15.1.1 United Arab Emirates
- 15.1.2 Saudi Arabia
- 15.1.3 South Africa
- 15.1.4 Rest of Middle East and Africa
- 16. Competitive Analysis
- 16.1. Global Market Share Analysis 2024
- 16.2. Company Profiles
- 16.2.1 Kalashnikov Group
- 16.2.1.1. Overview
- 16.2.1.2. Products
- 16.2.1.3. SWOT Analysis
- 16.2.1.4. Recent Developments
- 16.2.1.5. Financials (Based on Availability)
- 16.2.2 ThyssenKrupp AG
- 16.2.2.1. Overview
- 16.2.2.2. Products
- 16.2.2.3. SWOT Analysis
- 16.2.2.4. Recent Developments
- 16.2.2.5. Financials (Based on Availability)
- 16.2.3 General Dynamics Corporation
- 16.2.3.1. Overview
- 16.2.3.2. Products
- 16.2.3.3. SWOT Analysis
- 16.2.3.4. Recent Developments
- 16.2.3.5. Financials (Based on Availability)
- 16.2.4 Lockheed Martin Corporation
- 16.2.4.1. Overview
- 16.2.4.2. Products
- 16.2.4.3. SWOT Analysis
- 16.2.4.4. Recent Developments
- 16.2.4.5. Financials (Based on Availability)
- 16.2.5 China State Shipbuilding Corporation Limite
- 16.2.5.1. Overview
- 16.2.5.2. Products
- 16.2.5.3. SWOT Analysis
- 16.2.5.4. Recent Developments
- 16.2.5.5. Financials (Based on Availability)
- 16.2.6 Fr Lurssen Werft Gmbh & Co KG
- 16.2.6.1. Overview
- 16.2.6.2. Products
- 16.2.6.3. SWOT Analysis
- 16.2.6.4. Recent Developments
- 16.2.6.5. Financials (Based on Availability)
- 16.2.7 Naval Group SA
- 16.2.7.1. Overview
- 16.2.7.2. Products
- 16.2.7.3. SWOT Analysis
- 16.2.7.4. Recent Developments
- 16.2.7.5. Financials (Based on Availability)
- 16.2.8 BAE Systems PLC
- 16.2.8.1. Overview
- 16.2.8.2. Products
- 16.2.8.3. SWOT Analysis
- 16.2.8.4. Recent Developments
- 16.2.8.5. Financials (Based on Availability)
- 16.2.9 Austal Limited
- 16.2.9.1. Overview
- 16.2.9.2. Products
- 16.2.9.3. SWOT Analysis
- 16.2.9.4. Recent Developments
- 16.2.9.5. Financials (Based on Availability)
- 16.2.10 Huntington Ingalls Industries Inc
- 16.2.10.1. Overview
- 16.2.10.2. Products
- 16.2.10.3. SWOT Analysis
- 16.2.10.4. Recent Developments
- 16.2.10.5. Financials (Based on Availability)
- 16.2.11 EDGE Group PJSC
- 16.2.11.1. Overview
- 16.2.11.2. Products
- 16.2.11.3. SWOT Analysis
- 16.2.11.4. Recent Developments
- 16.2.11.5. Financials (Based on Availability)
- 16.2.12 HD Korea Shipbuilding & Offshore Engineering Co Ltd
- 16.2.12.1. Overview
- 16.2.12.2. Products
- 16.2.12.3. SWOT Analysis
- 16.2.12.4. Recent Developments
- 16.2.12.5. Financials (Based on Availability)
- 16.2.13 Navantia SA SME
- 16.2.13.1. Overview
- 16.2.13.2. Products
- 16.2.13.3. SWOT Analysis
- 16.2.13.4. Recent Developments
- 16.2.13.5. Financials (Based on Availability)
- 16.2.14 Hanwha Ocean (Hanwha Group)
- 16.2.14.1. Overview
- 16.2.14.2. Products
- 16.2.14.3. SWOT Analysis
- 16.2.14.4. Recent Developments
- 16.2.14.5. Financials (Based on Availability)
- 16.2.15 FINCANTIERI SpA
- 16.2.15.1. Overview
- 16.2.15.2. Products
- 16.2.15.3. SWOT Analysis
- 16.2.15.4. Recent Developments
- 16.2.15.5. Financials (Based on Availability)
- 16.2.16 Damen Shipyards Group
- 16.2.16.1. Overview
- 16.2.16.2. Products
- 16.2.16.3. SWOT Analysis
- 16.2.16.4. Recent Developments
- 16.2.16.5. Financials (Based on Availability)
- 16.2.17 LARSEN & TOUBRO LIMITED6 3 Other Players
- 16.2.17.1. Overview
- 16.2.17.2. Products
- 16.2.17.3. SWOT Analysis
- 16.2.17.4. Recent Developments
- 16.2.17.5. Financials (Based on Availability)
- 16.2.18 PT PAL Indonesia
- 16.2.18.1. Overview
- 16.2.18.2. Products
- 16.2.18.3. SWOT Analysis
- 16.2.18.4. Recent Developments
- 16.2.18.5. Financials (Based on Availability)
- 16.2.1 Kalashnikov Group
List of Figures
- Figure 1: Global Marine Vessel Industry Revenue Breakdown (Million, %) by Region 2024 & 2032
- Figure 2: North America Marine Vessel Industry Revenue (Million), by Country 2024 & 2032
- Figure 3: North America Marine Vessel Industry Revenue Share (%), by Country 2024 & 2032
- Figure 4: Europe Marine Vessel Industry Revenue (Million), by Country 2024 & 2032
- Figure 5: Europe Marine Vessel Industry Revenue Share (%), by Country 2024 & 2032
- Figure 6: Asia Pacific Marine Vessel Industry Revenue (Million), by Country 2024 & 2032
- Figure 7: Asia Pacific Marine Vessel Industry Revenue Share (%), by Country 2024 & 2032
- Figure 8: Latin America Marine Vessel Industry Revenue (Million), by Country 2024 & 2032
- Figure 9: Latin America Marine Vessel Industry Revenue Share (%), by Country 2024 & 2032
- Figure 10: Middle East and Africa Marine Vessel Industry Revenue (Million), by Country 2024 & 2032
- Figure 11: Middle East and Africa Marine Vessel Industry Revenue Share (%), by Country 2024 & 2032
- Figure 12: North America Marine Vessel Industry Revenue (Million), by Vessel Type 2024 & 2032
- Figure 13: North America Marine Vessel Industry Revenue Share (%), by Vessel Type 2024 & 2032
- Figure 14: North America Marine Vessel Industry Revenue (Million), by Country 2024 & 2032
- Figure 15: North America Marine Vessel Industry Revenue Share (%), by Country 2024 & 2032
- Figure 16: Europe Marine Vessel Industry Revenue (Million), by Vessel Type 2024 & 2032
- Figure 17: Europe Marine Vessel Industry Revenue Share (%), by Vessel Type 2024 & 2032
- Figure 18: Europe Marine Vessel Industry Revenue (Million), by Country 2024 & 2032
- Figure 19: Europe Marine Vessel Industry Revenue Share (%), by Country 2024 & 2032
- Figure 20: Asia Pacific Marine Vessel Industry Revenue (Million), by Vessel Type 2024 & 2032
- Figure 21: Asia Pacific Marine Vessel Industry Revenue Share (%), by Vessel Type 2024 & 2032
- Figure 22: Asia Pacific Marine Vessel Industry Revenue (Million), by Country 2024 & 2032
- Figure 23: Asia Pacific Marine Vessel Industry Revenue Share (%), by Country 2024 & 2032
- Figure 24: Latin America Marine Vessel Industry Revenue (Million), by Vessel Type 2024 & 2032
- Figure 25: Latin America Marine Vessel Industry Revenue Share (%), by Vessel Type 2024 & 2032
- Figure 26: Latin America Marine Vessel Industry Revenue (Million), by Country 2024 & 2032
- Figure 27: Latin America Marine Vessel Industry Revenue Share (%), by Country 2024 & 2032
- Figure 28: Middle East and Africa Marine Vessel Industry Revenue (Million), by Vessel Type 2024 & 2032
- Figure 29: Middle East and Africa Marine Vessel Industry Revenue Share (%), by Vessel Type 2024 & 2032
- Figure 30: Middle East and Africa Marine Vessel Industry Revenue (Million), by Country 2024 & 2032
- Figure 31: Middle East and Africa Marine Vessel Industry Revenue Share (%), by Country 2024 & 2032
List of Tables
- Table 1: Global Marine Vessel Industry Revenue Million Forecast, by Region 2019 & 2032
- Table 2: Global Marine Vessel Industry Revenue Million Forecast, by Vessel Type 2019 & 2032
- Table 3: Global Marine Vessel Industry Revenue Million Forecast, by Region 2019 & 2032
- Table 4: Global Marine Vessel Industry Revenue Million Forecast, by Country 2019 & 2032
- Table 5: United States Marine Vessel Industry Revenue (Million) Forecast, by Application 2019 & 2032
- Table 6: Canada Marine Vessel Industry Revenue (Million) Forecast, by Application 2019 & 2032
- Table 7: Global Marine Vessel Industry Revenue Million Forecast, by Country 2019 & 2032
- Table 8: Germany Marine Vessel Industry Revenue (Million) Forecast, by Application 2019 & 2032
- Table 9: United Kingdom Marine Vessel Industry Revenue (Million) Forecast, by Application 2019 & 2032
- Table 10: France Marine Vessel Industry Revenue (Million) Forecast, by Application 2019 & 2032
- Table 11: Russia Marine Vessel Industry Revenue (Million) Forecast, by Application 2019 & 2032
- Table 12: Spain Marine Vessel Industry Revenue (Million) Forecast, by Application 2019 & 2032
- Table 13: Rest of Europe Marine Vessel Industry Revenue (Million) Forecast, by Application 2019 & 2032
- Table 14: Global Marine Vessel Industry Revenue Million Forecast, by Country 2019 & 2032
- Table 15: China Marine Vessel Industry Revenue (Million) Forecast, by Application 2019 & 2032
- Table 16: India Marine Vessel Industry Revenue (Million) Forecast, by Application 2019 & 2032
- Table 17: Japan Marine Vessel Industry Revenue (Million) Forecast, by Application 2019 & 2032
- Table 18: South Korea Marine Vessel Industry Revenue (Million) Forecast, by Application 2019 & 2032
- Table 19: Australia Marine Vessel Industry Revenue (Million) Forecast, by Application 2019 & 2032
- Table 20: Singapore Marine Vessel Industry Revenue (Million) Forecast, by Application 2019 & 2032
- Table 21: Rest of Asia Pacific Marine Vessel Industry Revenue (Million) Forecast, by Application 2019 & 2032
- Table 22: Global Marine Vessel Industry Revenue Million Forecast, by Country 2019 & 2032
- Table 23: Brazil Marine Vessel Industry Revenue (Million) Forecast, by Application 2019 & 2032
- Table 24: Mexico Marine Vessel Industry Revenue (Million) Forecast, by Application 2019 & 2032
- Table 25: Rest of Latin America Marine Vessel Industry Revenue (Million) Forecast, by Application 2019 & 2032
- Table 26: Global Marine Vessel Industry Revenue Million Forecast, by Country 2019 & 2032
- Table 27: United Arab Emirates Marine Vessel Industry Revenue (Million) Forecast, by Application 2019 & 2032
- Table 28: Saudi Arabia Marine Vessel Industry Revenue (Million) Forecast, by Application 2019 & 2032
- Table 29: South Africa Marine Vessel Industry Revenue (Million) Forecast, by Application 2019 & 2032
- Table 30: Rest of Middle East and Africa Marine Vessel Industry Revenue (Million) Forecast, by Application 2019 & 2032
- Table 31: Global Marine Vessel Industry Revenue Million Forecast, by Vessel Type 2019 & 2032
- Table 32: Global Marine Vessel Industry Revenue Million Forecast, by Country 2019 & 2032
- Table 33: United States Marine Vessel Industry Revenue (Million) Forecast, by Application 2019 & 2032
- Table 34: Canada Marine Vessel Industry Revenue (Million) Forecast, by Application 2019 & 2032
- Table 35: Global Marine Vessel Industry Revenue Million Forecast, by Vessel Type 2019 & 2032
- Table 36: Global Marine Vessel Industry Revenue Million Forecast, by Country 2019 & 2032
- Table 37: Germany Marine Vessel Industry Revenue (Million) Forecast, by Application 2019 & 2032
- Table 38: United Kingdom Marine Vessel Industry Revenue (Million) Forecast, by Application 2019 & 2032
- Table 39: France Marine Vessel Industry Revenue (Million) Forecast, by Application 2019 & 2032
- Table 40: Russia Marine Vessel Industry Revenue (Million) Forecast, by Application 2019 & 2032
- Table 41: Spain Marine Vessel Industry Revenue (Million) Forecast, by Application 2019 & 2032
- Table 42: Rest of Europe Marine Vessel Industry Revenue (Million) Forecast, by Application 2019 & 2032
- Table 43: Global Marine Vessel Industry Revenue Million Forecast, by Vessel Type 2019 & 2032
- Table 44: Global Marine Vessel Industry Revenue Million Forecast, by Country 2019 & 2032
- Table 45: China Marine Vessel Industry Revenue (Million) Forecast, by Application 2019 & 2032
- Table 46: India Marine Vessel Industry Revenue (Million) Forecast, by Application 2019 & 2032
- Table 47: Japan Marine Vessel Industry Revenue (Million) Forecast, by Application 2019 & 2032
- Table 48: South Korea Marine Vessel Industry Revenue (Million) Forecast, by Application 2019 & 2032
- Table 49: Australia Marine Vessel Industry Revenue (Million) Forecast, by Application 2019 & 2032
- Table 50: Singapore Marine Vessel Industry Revenue (Million) Forecast, by Application 2019 & 2032
- Table 51: Rest of Asia Pacific Marine Vessel Industry Revenue (Million) Forecast, by Application 2019 & 2032
- Table 52: Global Marine Vessel Industry Revenue Million Forecast, by Vessel Type 2019 & 2032
- Table 53: Global Marine Vessel Industry Revenue Million Forecast, by Country 2019 & 2032
- Table 54: Brazil Marine Vessel Industry Revenue (Million) Forecast, by Application 2019 & 2032
- Table 55: Mexico Marine Vessel Industry Revenue (Million) Forecast, by Application 2019 & 2032
- Table 56: Rest of Latin America Marine Vessel Industry Revenue (Million) Forecast, by Application 2019 & 2032
- Table 57: Global Marine Vessel Industry Revenue Million Forecast, by Vessel Type 2019 & 2032
- Table 58: Global Marine Vessel Industry Revenue Million Forecast, by Country 2019 & 2032
- Table 59: United Arab Emirates Marine Vessel Industry Revenue (Million) Forecast, by Application 2019 & 2032
- Table 60: Saudi Arabia Marine Vessel Industry Revenue (Million) Forecast, by Application 2019 & 2032
- Table 61: South Africa Marine Vessel Industry Revenue (Million) Forecast, by Application 2019 & 2032
- Table 62: Rest of Middle East and Africa Marine Vessel Industry Revenue (Million) Forecast, by Application 2019 & 2032
Frequently Asked Questions
1. What is the projected Compound Annual Growth Rate (CAGR) of the Marine Vessel Industry?
The projected CAGR is approximately 6.46%.
2. Which companies are prominent players in the Marine Vessel Industry?
Key companies in the market include Kalashnikov Group, ThyssenKrupp AG, General Dynamics Corporation, Lockheed Martin Corporation, China State Shipbuilding Corporation Limite, Fr Lurssen Werft Gmbh & Co KG, Naval Group SA, BAE Systems PLC, Austal Limited, Huntington Ingalls Industries Inc, EDGE Group PJSC, HD Korea Shipbuilding & Offshore Engineering Co Ltd, Navantia SA SME, Hanwha Ocean (Hanwha Group), FINCANTIERI SpA, Damen Shipyards Group, LARSEN & TOUBRO LIMITED6 3 Other Players, PT PAL Indonesia.
3. What are the main segments of the Marine Vessel Industry?
The market segments include Vessel Type.
4. Can you provide details about the market size?
The market size is estimated to be USD 109.39 Million as of 2022.
5. What are some drivers contributing to market growth?
N/A
6. What are the notable trends driving market growth?
Submarines Segment is Expected to Witness Significant Growth During the Forecast Period.
7. Are there any restraints impacting market growth?
N/A
8. Can you provide examples of recent developments in the market?
April 2023: The UK Ministry of Defence awarded a USD 57 million contract to BAE Systems plc to support communication, command, control, computer, and intelligence (C4I) services for surface vessels. According to the contract, BAE Systems will likely be able to help with C4I services and data deliverables throughout the five phases of shipboard integration.
9. What pricing options are available for accessing the report?
Pricing options include single-user, multi-user, and enterprise licenses priced at USD 4750, USD 5250, and USD 8750 respectively.
10. Is the market size provided in terms of value or volume?
The market size is provided in terms of value, measured in Million.
11. Are there any specific market keywords associated with the report?
Yes, the market keyword associated with the report is "Marine Vessel Industry," which aids in identifying and referencing the specific market segment covered.
12. How do I determine which pricing option suits my needs best?
The pricing options vary based on user requirements and access needs. Individual users may opt for single-user licenses, while businesses requiring broader access may choose multi-user or enterprise licenses for cost-effective access to the report.
13. Are there any additional resources or data provided in the Marine Vessel Industry report?
While the report offers comprehensive insights, it's advisable to review the specific contents or supplementary materials provided to ascertain if additional resources or data are available.
14. How can I stay updated on further developments or reports in the Marine Vessel Industry?
To stay informed about further developments, trends, and reports in the Marine Vessel Industry, consider subscribing to industry newsletters, following relevant companies and organizations, or regularly checking reputable industry news sources and publications.
Methodology
Step 1 - Identification of Relevant Samples Size from Population Database


Step 2 - Approaches for Defining Global Market Size (Value, Volume* & Price*)

Note*: In applicable scenarios
Step 3 - Data Sources
Primary Research
- Web Analytics
- Survey Reports
- Research Institute
- Latest Research Reports
- Opinion Leaders
Secondary Research
- Annual Reports
- White Paper
- Latest Press Release
- Industry Association
- Paid Database
- Investor Presentations

Step 4 - Data Triangulation
Involves using different sources of information in order to increase the validity of a study
These sources are likely to be stakeholders in a program - participants, other researchers, program staff, other community members, and so on.
Then we put all data in single framework & apply various statistical tools to find out the dynamic on the market.
During the analysis stage, feedback from the stakeholder groups would be compared to determine areas of agreement as well as areas of divergence
