

Key Insights
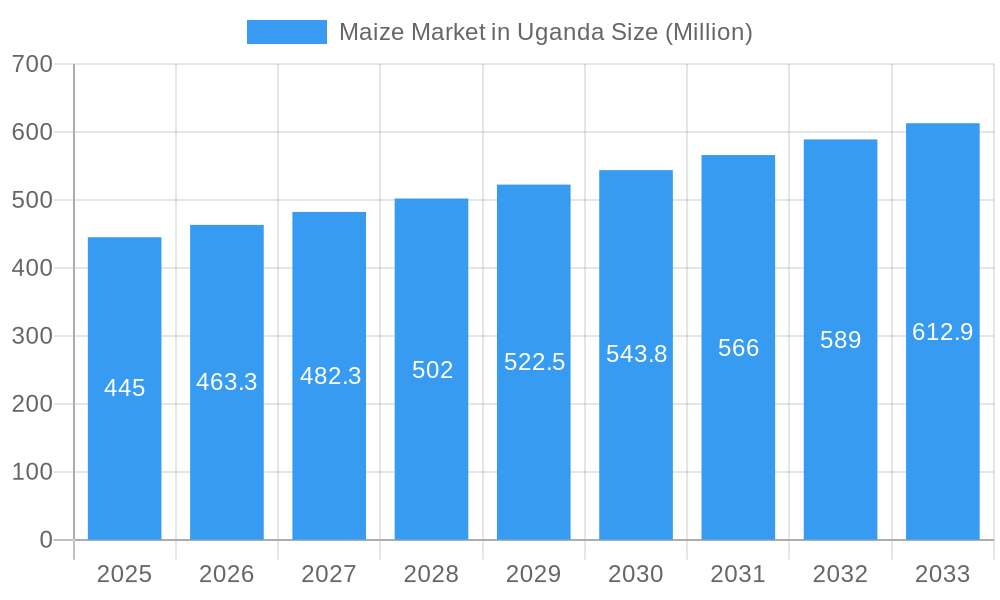
The Ugandan maize market, valued at approximately $445 million in 2025, exhibits robust growth potential, projected to expand at a compound annual growth rate (CAGR) of 4.10% from 2025 to 2033. This growth is fueled by several key drivers. Increasing population and rising disposable incomes are driving higher demand for maize-based food products. Government initiatives promoting agricultural modernization, including improved seed varieties and farming techniques, are enhancing productivity. Furthermore, the growing processing industry, encompassing companies like Kampala Grain Milling Company and Unga Group, is creating opportunities for value-added maize products, stimulating market expansion. However, challenges remain. Climate change, leading to unpredictable weather patterns and reduced yields, poses a significant threat. Limited access to credit and modern farming technologies for smallholder farmers also hinders growth. Effective strategies to mitigate these challenges, such as investing in drought-resistant maize varieties and strengthening farmer support programs, are crucial for sustaining market growth. The market segmentation reveals a significant focus on production, consumption, import, and export analysis of maize, along with detailed price trend analysis, providing valuable insight into market dynamics. Key players like National Seed Company (NSC) and Simplot play vital roles in shaping the market landscape through seed production and distribution.
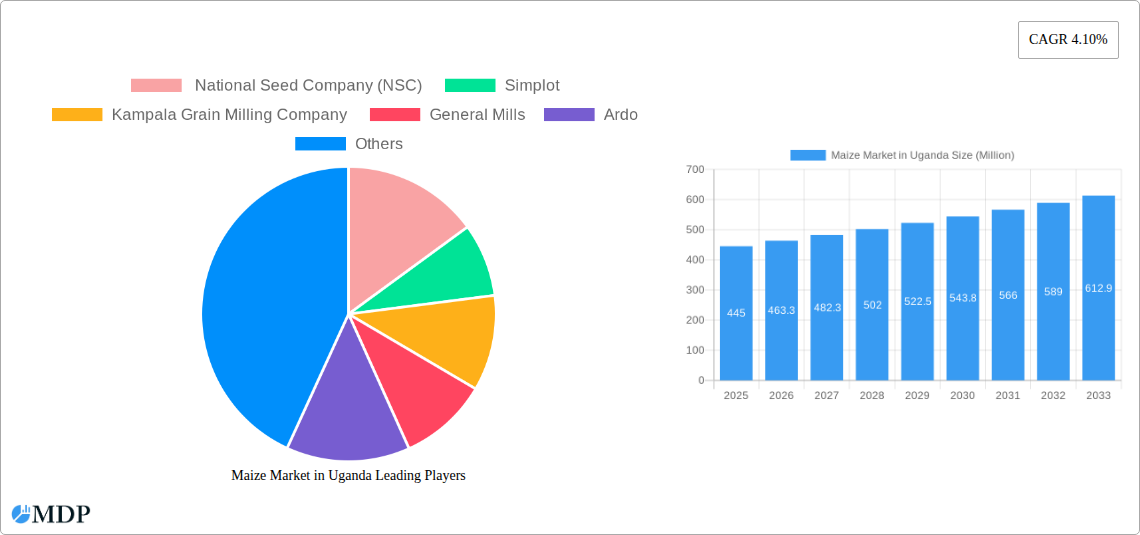
Maize Market in Uganda Market Size (In Million)
The competitive landscape is moderately concentrated, with both local and multinational companies competing. National Seed Company (NSC) and Seedco Uganda, along with international players like General Mills and McCain Foods, cater to diverse market segments. Growth opportunities lie in expanding value-added maize products, leveraging technological advancements in agriculture, and fostering greater collaboration between stakeholders across the value chain. Analyzing historical data from 2019 to 2024 reveals a consistent upward trend, suggesting a strong foundation for the projected growth trajectory. Further research into specific consumer preferences and regional variations in consumption patterns would offer a more granular understanding of this dynamic market.
Maize Market in Uganda Company Market Share
This in-depth report provides a comprehensive analysis of the Maize Market in Uganda, covering the period 2019-2033. With a focus on market dynamics, industry trends, leading players, and future opportunities, this report is an essential resource for industry stakeholders, investors, and researchers seeking to understand and capitalize on the growth potential within the Ugandan maize sector. The report leverages data from the base year 2025 and provides estimations for 2025 and forecasts for 2025-2033. The historical period covered is 2019-2024. High-impact keywords included: Uganda maize market, Maize production Uganda, Uganda grain market, Maize consumption Uganda, Uganda food processing, Aflatoxin in Uganda maize, Maize import export Uganda.
Maize Market in Uganda Market Dynamics & Concentration
The Ugandan maize market exhibits a moderately concentrated structure, with a few dominant players alongside numerous smaller-scale farmers and processors. Market share data reveals that NSC and Unga Group together hold approximately xx% of the market, indicating the presence of significant players. Innovation in the sector is driven by increasing demand for high-yielding hybrid maize varieties, improved post-harvest technologies, and value-added maize products. The regulatory framework, while undergoing reforms, often presents challenges related to seed quality control and aflatoxin management. Key product substitutes include millet, sorghum, and rice, which exert competitive pressure depending on price fluctuations and consumer preferences. End-user trends showcase a growing demand for processed maize products like flour and meal, driving growth in the milling and processing sub-sector. Mergers and acquisitions (M&A) activity remains relatively low, with only xx M&A deals recorded in the past five years, mainly involving smaller players consolidating their operations.
- Market Concentration: Moderately concentrated, with NSC and Unga Group holding a combined xx% market share (estimated).
- Innovation Drivers: High-yielding hybrid seeds, improved post-harvest technologies, value-added products.
- Regulatory Framework: Undergoing reforms; challenges in seed quality control and aflatoxin management persist.
- Product Substitutes: Millet, sorghum, and rice.
- End-User Trends: Growing demand for processed maize products.
- M&A Activity: Low; xx deals recorded in the past five years.
Maize Market in Uganda Industry Trends & Analysis
The Ugandan maize market exhibits a compound annual growth rate (CAGR) of xx% during the forecast period (2025-2033), driven by increasing population and rising per capita income. Market penetration of improved maize varieties is gradually increasing, albeit slowly, due to factors such as limited access to quality seeds and appropriate agricultural inputs in certain regions. Technological disruptions, such as the adoption of precision agriculture techniques and improved storage solutions, are slowly changing market dynamics, enhancing productivity and reducing post-harvest losses. Consumer preferences are shifting towards value-added products, leading to significant investment in maize processing facilities. Competitive dynamics are shaped by price competition, product differentiation, and access to markets. The market penetration of processed maize products is currently at xx% (estimated) and is projected to reach xx% by 2033.
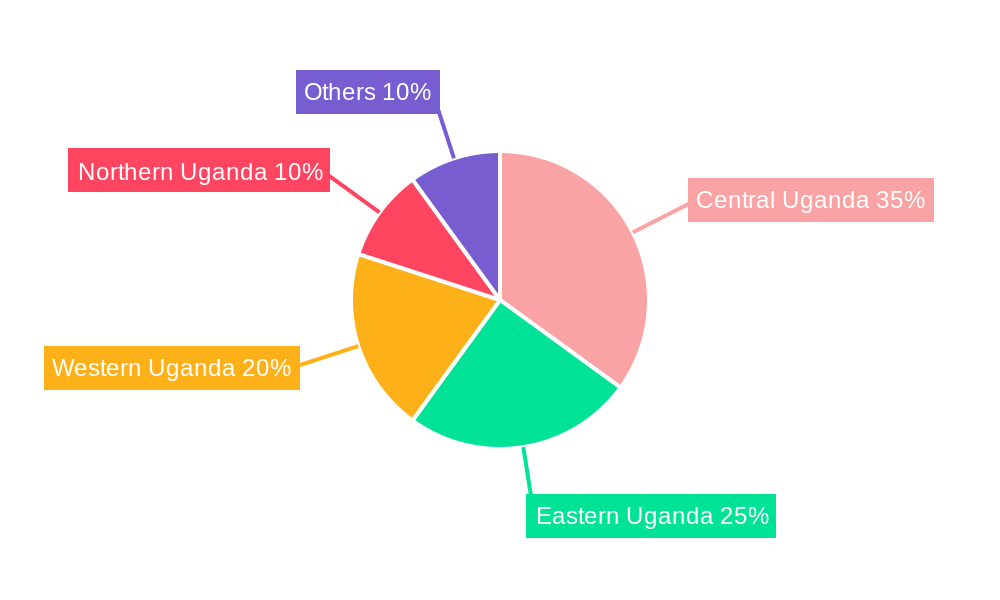
Leading Markets & Segments in Maize Market in Uganda
Maize dominates the grain market in Uganda, both in terms of production and consumption. The central and eastern regions are the leading maize-producing areas due to favorable climatic conditions and land availability.
- Key Drivers of Maize Dominance:
- Favorable climatic conditions in central and eastern regions.
- Extensive land availability for maize cultivation.
- Government support for maize production through subsidies and extension services.
- Strong demand for maize as a staple food.
- Millet, Sorghum, and Rice: These crops are secondary in terms of production and consumption, primarily concentrated in specific geographic regions depending on climate suitability. Import and export volumes for all crops are significant, but the trade balance is largely determined by maize market dynamics, with xx Million tons imported and xx Million tons exported annually. Price trend analysis shows maize prices exhibiting significant seasonal fluctuations.
Maize Market in Uganda Product Developments
Recent product innovations focus on improving maize quality and yield through the development of drought-resistant and disease-resistant hybrid varieties. Value-added maize products such as instant maize porridge and high-protein maize flour are gaining popularity. These innovations target specific market needs, such as increasing nutritional value and enhancing convenience for consumers. The improved processing technology helps reduce post-harvest losses and increases shelf life of processed products.
Key Drivers of Maize Market in Uganda Growth
The Ugandan maize market's growth is propelled by a combination of factors:
- Population Growth: Uganda's rapidly growing population fuels the demand for maize as a staple food.
- Rising Incomes: Increased disposable income enhances purchasing power, leading to higher consumption of processed maize products.
- Government Support: Initiatives focused on improving agricultural infrastructure, providing farmer training, and promoting value addition are fostering growth.
- Technological Advancements: The adoption of improved farming practices and processing technologies boosts productivity and efficiency.
Challenges in the Maize Market in Uganda Market
Several challenges hinder the growth of the maize market in Uganda:
- Aflatoxin Contamination: Aflatoxin contamination remains a significant concern, impacting both quality and safety of maize products.
- Post-Harvest Losses: Inefficient post-harvest handling and storage lead to significant losses, reducing overall market supply.
- Climate Change: Variable weather patterns, including droughts and floods, pose risks to maize production and yields.
- Limited Access to Credit: Smallholder farmers face challenges accessing credit, restricting their access to improved inputs and technologies.
Emerging Opportunities in Maize Market in Uganda
The Ugandan maize market presents several promising opportunities:
- Value Addition: Increased investment in value-added maize processing can unlock new market segments and generate higher returns.
- Export Market Expansion: Improving the quality and consistency of maize production can facilitate exports to regional markets.
- Strategic Partnerships: Collaborations between farmers, processors, and exporters can strengthen the entire value chain.
- Technological Innovation: Adoption of precision agriculture, improved storage, and processing technologies can significantly improve efficiency and sustainability.
Leading Players in the Maize Market in Uganda Sector
- National Seed Company (NSC)
- Simplot
- Kampala Grain Milling Company
- General Mills
- Ardo
- Kalangala Agro Processing Industries Ltd.
- Unga Group
- Seedco Uganda
- McCain Foods
- Bonduelle
Key Milestones in Maize Market in Uganda Industry
- December 2020: Launch of the Climate Information for Grains (Ci4G) tool by the Eastern Africa Grain Council and CDKN, enhancing climate resilience in the grain sector.
- August 2022: Improved maize quality confirmed by the Eastern Africa Grain Council (EAGC) due to increased training on post-harvest management.
Strategic Outlook for Maize Market in Uganda Market
The future of the Ugandan maize market is promising, with significant potential for growth driven by rising demand, increased value addition, and strategic partnerships. Addressing challenges related to aflatoxin contamination, post-harvest losses, and climate change will be crucial for unlocking the full potential of this sector. Investing in research and development, promoting sustainable farming practices, and strengthening the value chain will be key to ensuring the long-term success of the Ugandan maize market.
Maize Market in Uganda Segmentation
-
1. Type (P
- 1.1. Maize
- 1.2. Millet
- 1.3. Sorghum
- 1.4. Rice
-
2. Type (P
- 2.1. Maize
- 2.2. Millet
- 2.3. Sorghum
- 2.4. Rice
Maize Market in Uganda Segmentation By Geography
-
1. North America
- 1.1. United States
- 1.2. Canada
- 1.3. Mexico
-
2. South America
- 2.1. Brazil
- 2.2. Argentina
- 2.3. Rest of South America
-
3. Europe
- 3.1. United Kingdom
- 3.2. Germany
- 3.3. France
- 3.4. Italy
- 3.5. Spain
- 3.6. Russia
- 3.7. Benelux
- 3.8. Nordics
- 3.9. Rest of Europe
-
4. Middle East & Africa
- 4.1. Turkey
- 4.2. Israel
- 4.3. GCC
- 4.4. North Africa
- 4.5. South Africa
- 4.6. Rest of Middle East & Africa
-
5. Asia Pacific
- 5.1. China
- 5.2. India
- 5.3. Japan
- 5.4. South Korea
- 5.5. ASEAN
- 5.6. Oceania
- 5.7. Rest of Asia Pacific
Maize Market in Uganda Regional Market Share
Geographic Coverage of Maize Market in Uganda
Maize Market in Uganda REPORT HIGHLIGHTS
| Aspects | Details |
|---|---|
| Study Period | 2020-2034 |
| Base Year | 2025 |
| Estimated Year | 2026 |
| Forecast Period | 2026-2034 |
| Historical Period | 2020-2025 |
| Growth Rate | CAGR of 4.10% from 2020-2034 |
| Segmentation |
|
Table of Contents
- 1. Introduction
- 1.1. Research Scope
- 1.2. Market Segmentation
- 1.3. Research Objective
- 1.4. Definitions and Assumptions
- 2. Executive Summary
- 2.1. Market Snapshot
- 3. Market Dynamics
- 3.1. Market Drivers
- 3.2. Market Restrains
- 3.3. Market Trends
- 3.4. Market Opportunities
- 4. Market Factor Analysis
- 4.1. Porters Five Forces
- 4.1.1. Bargaining Power of Suppliers
- 4.1.2. Bargaining Power of Buyers
- 4.1.3. Threat of New Entrants
- 4.1.4. Threat of Substitutes
- 4.1.5. Competitive Rivalry
- 4.2. PESTEL analysis
- 4.3. BCG Analysis
- 4.3.1. Stars (High Growth, High Market Share)
- 4.3.2. Cash Cows (Low Growth, High Market Share)
- 4.3.3. Question Mark (High Growth, Low Market Share)
- 4.3.4. Dogs (Low Growth, Low Market Share)
- 4.4. Ansoff Matrix Analysis
- 4.5. Supply Chain Analysis
- 4.6. Regulatory Landscape
- 4.7. Current Market Potential and Opportunity Assessment (TAM–SAM–SOM Framework)
- 4.8. MDP Analyst Note
- 4.1. Porters Five Forces
- 5. Market Analysis, Insights and Forecast 2021-2033
- 5.1. Market Analysis, Insights and Forecast - by Type (P
- 5.1.1. Maize
- 5.1.2. Millet
- 5.1.3. Sorghum
- 5.1.4. Rice
- 5.2. Market Analysis, Insights and Forecast - by Type (P
- 5.2.1. Maize
- 5.2.2. Millet
- 5.2.3. Sorghum
- 5.2.4. Rice
- 5.3. Market Analysis, Insights and Forecast - by Region
- 5.3.1. North America
- 5.3.2. South America
- 5.3.3. Europe
- 5.3.4. Middle East & Africa
- 5.3.5. Asia Pacific
- 5.1. Market Analysis, Insights and Forecast - by Type (P
- 6. Global Maize Market in Uganda Analysis, Insights and Forecast, 2021-2033
- 6.1. Market Analysis, Insights and Forecast - by Type (P
- 6.1.1. Maize
- 6.1.2. Millet
- 6.1.3. Sorghum
- 6.1.4. Rice
- 6.2. Market Analysis, Insights and Forecast - by Type (P
- 6.2.1. Maize
- 6.2.2. Millet
- 6.2.3. Sorghum
- 6.2.4. Rice
- 6.1. Market Analysis, Insights and Forecast - by Type (P
- 7. North America Maize Market in Uganda Analysis, Insights and Forecast, 2020-2032
- 7.1. Market Analysis, Insights and Forecast - by Type (P
- 7.1.1. Maize
- 7.1.2. Millet
- 7.1.3. Sorghum
- 7.1.4. Rice
- 7.2. Market Analysis, Insights and Forecast - by Type (P
- 7.2.1. Maize
- 7.2.2. Millet
- 7.2.3. Sorghum
- 7.2.4. Rice
- 7.1. Market Analysis, Insights and Forecast - by Type (P
- 8. South America Maize Market in Uganda Analysis, Insights and Forecast, 2020-2032
- 8.1. Market Analysis, Insights and Forecast - by Type (P
- 8.1.1. Maize
- 8.1.2. Millet
- 8.1.3. Sorghum
- 8.1.4. Rice
- 8.2. Market Analysis, Insights and Forecast - by Type (P
- 8.2.1. Maize
- 8.2.2. Millet
- 8.2.3. Sorghum
- 8.2.4. Rice
- 8.1. Market Analysis, Insights and Forecast - by Type (P
- 9. Europe Maize Market in Uganda Analysis, Insights and Forecast, 2020-2032
- 9.1. Market Analysis, Insights and Forecast - by Type (P
- 9.1.1. Maize
- 9.1.2. Millet
- 9.1.3. Sorghum
- 9.1.4. Rice
- 9.2. Market Analysis, Insights and Forecast - by Type (P
- 9.2.1. Maize
- 9.2.2. Millet
- 9.2.3. Sorghum
- 9.2.4. Rice
- 9.1. Market Analysis, Insights and Forecast - by Type (P
- 10. Middle East & Africa Maize Market in Uganda Analysis, Insights and Forecast, 2020-2032
- 10.1. Market Analysis, Insights and Forecast - by Type (P
- 10.1.1. Maize
- 10.1.2. Millet
- 10.1.3. Sorghum
- 10.1.4. Rice
- 10.2. Market Analysis, Insights and Forecast - by Type (P
- 10.2.1. Maize
- 10.2.2. Millet
- 10.2.3. Sorghum
- 10.2.4. Rice
- 10.1. Market Analysis, Insights and Forecast - by Type (P
- 11. Asia Pacific Maize Market in Uganda Analysis, Insights and Forecast, 2020-2032
- 11.1. Market Analysis, Insights and Forecast - by Type (P
- 11.1.1. Maize
- 11.1.2. Millet
- 11.1.3. Sorghum
- 11.1.4. Rice
- 11.2. Market Analysis, Insights and Forecast - by Type (P
- 11.2.1. Maize
- 11.2.2. Millet
- 11.2.3. Sorghum
- 11.2.4. Rice
- 11.1. Market Analysis, Insights and Forecast - by Type (P
- 12. Competitive Analysis
- 12.1. Company Profiles
- 12.1.1 National Seed Company (NSC)
- 12.1.1.1. Company Overview
- 12.1.1.2. Products
- 12.1.1.3. Company Financials
- 12.1.1.4. SWOT Analysis
- 12.1.2 Simplot
- 12.1.2.1. Company Overview
- 12.1.2.2. Products
- 12.1.2.3. Company Financials
- 12.1.2.4. SWOT Analysis
- 12.1.3 Kampala Grain Milling Company
- 12.1.3.1. Company Overview
- 12.1.3.2. Products
- 12.1.3.3. Company Financials
- 12.1.3.4. SWOT Analysis
- 12.1.4 General Mills
- 12.1.4.1. Company Overview
- 12.1.4.2. Products
- 12.1.4.3. Company Financials
- 12.1.4.4. SWOT Analysis
- 12.1.5 Ardo
- 12.1.5.1. Company Overview
- 12.1.5.2. Products
- 12.1.5.3. Company Financials
- 12.1.5.4. SWOT Analysis
- 12.1.6 Kalangala Agro Processing Industries Ltd.
- 12.1.6.1. Company Overview
- 12.1.6.2. Products
- 12.1.6.3. Company Financials
- 12.1.6.4. SWOT Analysis
- 12.1.7 Unga Group
- 12.1.7.1. Company Overview
- 12.1.7.2. Products
- 12.1.7.3. Company Financials
- 12.1.7.4. SWOT Analysis
- 12.1.8 Seedco Uganda
- 12.1.8.1. Company Overview
- 12.1.8.2. Products
- 12.1.8.3. Company Financials
- 12.1.8.4. SWOT Analysis
- 12.1.9 McCain Foods
- 12.1.9.1. Company Overview
- 12.1.9.2. Products
- 12.1.9.3. Company Financials
- 12.1.9.4. SWOT Analysis
- 12.1.10 Bonduelle
- 12.1.10.1. Company Overview
- 12.1.10.2. Products
- 12.1.10.3. Company Financials
- 12.1.10.4. SWOT Analysis
- 12.1.1 National Seed Company (NSC)
- 12.2. Market Entropy
- 12.2.1 Company's Key Areas Served
- 12.2.2 Recent Developments
- 12.3. Company Market Share Analysis 2025
- 12.3.1 Top 5 Companies Market Share Analysis
- 12.3.2 Top 3 Companies Market Share Analysis
- 12.4. List of Potential Customers
- 13. Research Methodology
List of Figures
- Figure 1: Global Maize Market in Uganda Revenue Breakdown (Million, %) by Region 2025 & 2033
- Figure 2: Global Maize Market in Uganda Volume Breakdown (k Tons, %) by Region 2025 & 2033
- Figure 3: North America Maize Market in Uganda Revenue (Million), by Type (P 2025 & 2033
- Figure 4: North America Maize Market in Uganda Volume (k Tons), by Type (P 2025 & 2033
- Figure 5: North America Maize Market in Uganda Revenue Share (%), by Type (P 2025 & 2033
- Figure 6: North America Maize Market in Uganda Volume Share (%), by Type (P 2025 & 2033
- Figure 7: North America Maize Market in Uganda Revenue (Million), by Type (P 2025 & 2033
- Figure 8: North America Maize Market in Uganda Volume (k Tons), by Type (P 2025 & 2033
- Figure 9: North America Maize Market in Uganda Revenue Share (%), by Type (P 2025 & 2033
- Figure 10: North America Maize Market in Uganda Volume Share (%), by Type (P 2025 & 2033
- Figure 11: North America Maize Market in Uganda Revenue (Million), by Country 2025 & 2033
- Figure 12: North America Maize Market in Uganda Volume (k Tons), by Country 2025 & 2033
- Figure 13: North America Maize Market in Uganda Revenue Share (%), by Country 2025 & 2033
- Figure 14: North America Maize Market in Uganda Volume Share (%), by Country 2025 & 2033
- Figure 15: South America Maize Market in Uganda Revenue (Million), by Type (P 2025 & 2033
- Figure 16: South America Maize Market in Uganda Volume (k Tons), by Type (P 2025 & 2033
- Figure 17: South America Maize Market in Uganda Revenue Share (%), by Type (P 2025 & 2033
- Figure 18: South America Maize Market in Uganda Volume Share (%), by Type (P 2025 & 2033
- Figure 19: South America Maize Market in Uganda Revenue (Million), by Type (P 2025 & 2033
- Figure 20: South America Maize Market in Uganda Volume (k Tons), by Type (P 2025 & 2033
- Figure 21: South America Maize Market in Uganda Revenue Share (%), by Type (P 2025 & 2033
- Figure 22: South America Maize Market in Uganda Volume Share (%), by Type (P 2025 & 2033
- Figure 23: South America Maize Market in Uganda Revenue (Million), by Country 2025 & 2033
- Figure 24: South America Maize Market in Uganda Volume (k Tons), by Country 2025 & 2033
- Figure 25: South America Maize Market in Uganda Revenue Share (%), by Country 2025 & 2033
- Figure 26: South America Maize Market in Uganda Volume Share (%), by Country 2025 & 2033
- Figure 27: Europe Maize Market in Uganda Revenue (Million), by Type (P 2025 & 2033
- Figure 28: Europe Maize Market in Uganda Volume (k Tons), by Type (P 2025 & 2033
- Figure 29: Europe Maize Market in Uganda Revenue Share (%), by Type (P 2025 & 2033
- Figure 30: Europe Maize Market in Uganda Volume Share (%), by Type (P 2025 & 2033
- Figure 31: Europe Maize Market in Uganda Revenue (Million), by Type (P 2025 & 2033
- Figure 32: Europe Maize Market in Uganda Volume (k Tons), by Type (P 2025 & 2033
- Figure 33: Europe Maize Market in Uganda Revenue Share (%), by Type (P 2025 & 2033
- Figure 34: Europe Maize Market in Uganda Volume Share (%), by Type (P 2025 & 2033
- Figure 35: Europe Maize Market in Uganda Revenue (Million), by Country 2025 & 2033
- Figure 36: Europe Maize Market in Uganda Volume (k Tons), by Country 2025 & 2033
- Figure 37: Europe Maize Market in Uganda Revenue Share (%), by Country 2025 & 2033
- Figure 38: Europe Maize Market in Uganda Volume Share (%), by Country 2025 & 2033
- Figure 39: Middle East & Africa Maize Market in Uganda Revenue (Million), by Type (P 2025 & 2033
- Figure 40: Middle East & Africa Maize Market in Uganda Volume (k Tons), by Type (P 2025 & 2033
- Figure 41: Middle East & Africa Maize Market in Uganda Revenue Share (%), by Type (P 2025 & 2033
- Figure 42: Middle East & Africa Maize Market in Uganda Volume Share (%), by Type (P 2025 & 2033
- Figure 43: Middle East & Africa Maize Market in Uganda Revenue (Million), by Type (P 2025 & 2033
- Figure 44: Middle East & Africa Maize Market in Uganda Volume (k Tons), by Type (P 2025 & 2033
- Figure 45: Middle East & Africa Maize Market in Uganda Revenue Share (%), by Type (P 2025 & 2033
- Figure 46: Middle East & Africa Maize Market in Uganda Volume Share (%), by Type (P 2025 & 2033
- Figure 47: Middle East & Africa Maize Market in Uganda Revenue (Million), by Country 2025 & 2033
- Figure 48: Middle East & Africa Maize Market in Uganda Volume (k Tons), by Country 2025 & 2033
- Figure 49: Middle East & Africa Maize Market in Uganda Revenue Share (%), by Country 2025 & 2033
- Figure 50: Middle East & Africa Maize Market in Uganda Volume Share (%), by Country 2025 & 2033
- Figure 51: Asia Pacific Maize Market in Uganda Revenue (Million), by Type (P 2025 & 2033
- Figure 52: Asia Pacific Maize Market in Uganda Volume (k Tons), by Type (P 2025 & 2033
- Figure 53: Asia Pacific Maize Market in Uganda Revenue Share (%), by Type (P 2025 & 2033
- Figure 54: Asia Pacific Maize Market in Uganda Volume Share (%), by Type (P 2025 & 2033
- Figure 55: Asia Pacific Maize Market in Uganda Revenue (Million), by Type (P 2025 & 2033
- Figure 56: Asia Pacific Maize Market in Uganda Volume (k Tons), by Type (P 2025 & 2033
- Figure 57: Asia Pacific Maize Market in Uganda Revenue Share (%), by Type (P 2025 & 2033
- Figure 58: Asia Pacific Maize Market in Uganda Volume Share (%), by Type (P 2025 & 2033
- Figure 59: Asia Pacific Maize Market in Uganda Revenue (Million), by Country 2025 & 2033
- Figure 60: Asia Pacific Maize Market in Uganda Volume (k Tons), by Country 2025 & 2033
- Figure 61: Asia Pacific Maize Market in Uganda Revenue Share (%), by Country 2025 & 2033
- Figure 62: Asia Pacific Maize Market in Uganda Volume Share (%), by Country 2025 & 2033
List of Tables
- Table 1: Global Maize Market in Uganda Revenue Million Forecast, by Type (P 2020 & 2033
- Table 2: Global Maize Market in Uganda Volume k Tons Forecast, by Type (P 2020 & 2033
- Table 3: Global Maize Market in Uganda Revenue Million Forecast, by Type (P 2020 & 2033
- Table 4: Global Maize Market in Uganda Volume k Tons Forecast, by Type (P 2020 & 2033
- Table 5: Global Maize Market in Uganda Revenue Million Forecast, by Region 2020 & 2033
- Table 6: Global Maize Market in Uganda Volume k Tons Forecast, by Region 2020 & 2033
- Table 7: Global Maize Market in Uganda Revenue Million Forecast, by Type (P 2020 & 2033
- Table 8: Global Maize Market in Uganda Volume k Tons Forecast, by Type (P 2020 & 2033
- Table 9: Global Maize Market in Uganda Revenue Million Forecast, by Type (P 2020 & 2033
- Table 10: Global Maize Market in Uganda Volume k Tons Forecast, by Type (P 2020 & 2033
- Table 11: Global Maize Market in Uganda Revenue Million Forecast, by Country 2020 & 2033
- Table 12: Global Maize Market in Uganda Volume k Tons Forecast, by Country 2020 & 2033
- Table 13: United States Maize Market in Uganda Revenue (Million) Forecast, by Application 2020 & 2033
- Table 14: United States Maize Market in Uganda Volume (k Tons) Forecast, by Application 2020 & 2033
- Table 15: Canada Maize Market in Uganda Revenue (Million) Forecast, by Application 2020 & 2033
- Table 16: Canada Maize Market in Uganda Volume (k Tons) Forecast, by Application 2020 & 2033
- Table 17: Mexico Maize Market in Uganda Revenue (Million) Forecast, by Application 2020 & 2033
- Table 18: Mexico Maize Market in Uganda Volume (k Tons) Forecast, by Application 2020 & 2033
- Table 19: Global Maize Market in Uganda Revenue Million Forecast, by Type (P 2020 & 2033
- Table 20: Global Maize Market in Uganda Volume k Tons Forecast, by Type (P 2020 & 2033
- Table 21: Global Maize Market in Uganda Revenue Million Forecast, by Type (P 2020 & 2033
- Table 22: Global Maize Market in Uganda Volume k Tons Forecast, by Type (P 2020 & 2033
- Table 23: Global Maize Market in Uganda Revenue Million Forecast, by Country 2020 & 2033
- Table 24: Global Maize Market in Uganda Volume k Tons Forecast, by Country 2020 & 2033
- Table 25: Brazil Maize Market in Uganda Revenue (Million) Forecast, by Application 2020 & 2033
- Table 26: Brazil Maize Market in Uganda Volume (k Tons) Forecast, by Application 2020 & 2033
- Table 27: Argentina Maize Market in Uganda Revenue (Million) Forecast, by Application 2020 & 2033
- Table 28: Argentina Maize Market in Uganda Volume (k Tons) Forecast, by Application 2020 & 2033
- Table 29: Rest of South America Maize Market in Uganda Revenue (Million) Forecast, by Application 2020 & 2033
- Table 30: Rest of South America Maize Market in Uganda Volume (k Tons) Forecast, by Application 2020 & 2033
- Table 31: Global Maize Market in Uganda Revenue Million Forecast, by Type (P 2020 & 2033
- Table 32: Global Maize Market in Uganda Volume k Tons Forecast, by Type (P 2020 & 2033
- Table 33: Global Maize Market in Uganda Revenue Million Forecast, by Type (P 2020 & 2033
- Table 34: Global Maize Market in Uganda Volume k Tons Forecast, by Type (P 2020 & 2033
- Table 35: Global Maize Market in Uganda Revenue Million Forecast, by Country 2020 & 2033
- Table 36: Global Maize Market in Uganda Volume k Tons Forecast, by Country 2020 & 2033
- Table 37: United Kingdom Maize Market in Uganda Revenue (Million) Forecast, by Application 2020 & 2033
- Table 38: United Kingdom Maize Market in Uganda Volume (k Tons) Forecast, by Application 2020 & 2033
- Table 39: Germany Maize Market in Uganda Revenue (Million) Forecast, by Application 2020 & 2033
- Table 40: Germany Maize Market in Uganda Volume (k Tons) Forecast, by Application 2020 & 2033
- Table 41: France Maize Market in Uganda Revenue (Million) Forecast, by Application 2020 & 2033
- Table 42: France Maize Market in Uganda Volume (k Tons) Forecast, by Application 2020 & 2033
- Table 43: Italy Maize Market in Uganda Revenue (Million) Forecast, by Application 2020 & 2033
- Table 44: Italy Maize Market in Uganda Volume (k Tons) Forecast, by Application 2020 & 2033
- Table 45: Spain Maize Market in Uganda Revenue (Million) Forecast, by Application 2020 & 2033
- Table 46: Spain Maize Market in Uganda Volume (k Tons) Forecast, by Application 2020 & 2033
- Table 47: Russia Maize Market in Uganda Revenue (Million) Forecast, by Application 2020 & 2033
- Table 48: Russia Maize Market in Uganda Volume (k Tons) Forecast, by Application 2020 & 2033
- Table 49: Benelux Maize Market in Uganda Revenue (Million) Forecast, by Application 2020 & 2033
- Table 50: Benelux Maize Market in Uganda Volume (k Tons) Forecast, by Application 2020 & 2033
- Table 51: Nordics Maize Market in Uganda Revenue (Million) Forecast, by Application 2020 & 2033
- Table 52: Nordics Maize Market in Uganda Volume (k Tons) Forecast, by Application 2020 & 2033
- Table 53: Rest of Europe Maize Market in Uganda Revenue (Million) Forecast, by Application 2020 & 2033
- Table 54: Rest of Europe Maize Market in Uganda Volume (k Tons) Forecast, by Application 2020 & 2033
- Table 55: Global Maize Market in Uganda Revenue Million Forecast, by Type (P 2020 & 2033
- Table 56: Global Maize Market in Uganda Volume k Tons Forecast, by Type (P 2020 & 2033
- Table 57: Global Maize Market in Uganda Revenue Million Forecast, by Type (P 2020 & 2033
- Table 58: Global Maize Market in Uganda Volume k Tons Forecast, by Type (P 2020 & 2033
- Table 59: Global Maize Market in Uganda Revenue Million Forecast, by Country 2020 & 2033
- Table 60: Global Maize Market in Uganda Volume k Tons Forecast, by Country 2020 & 2033
- Table 61: Turkey Maize Market in Uganda Revenue (Million) Forecast, by Application 2020 & 2033
- Table 62: Turkey Maize Market in Uganda Volume (k Tons) Forecast, by Application 2020 & 2033
- Table 63: Israel Maize Market in Uganda Revenue (Million) Forecast, by Application 2020 & 2033
- Table 64: Israel Maize Market in Uganda Volume (k Tons) Forecast, by Application 2020 & 2033
- Table 65: GCC Maize Market in Uganda Revenue (Million) Forecast, by Application 2020 & 2033
- Table 66: GCC Maize Market in Uganda Volume (k Tons) Forecast, by Application 2020 & 2033
- Table 67: North Africa Maize Market in Uganda Revenue (Million) Forecast, by Application 2020 & 2033
- Table 68: North Africa Maize Market in Uganda Volume (k Tons) Forecast, by Application 2020 & 2033
- Table 69: South Africa Maize Market in Uganda Revenue (Million) Forecast, by Application 2020 & 2033
- Table 70: South Africa Maize Market in Uganda Volume (k Tons) Forecast, by Application 2020 & 2033
- Table 71: Rest of Middle East & Africa Maize Market in Uganda Revenue (Million) Forecast, by Application 2020 & 2033
- Table 72: Rest of Middle East & Africa Maize Market in Uganda Volume (k Tons) Forecast, by Application 2020 & 2033
- Table 73: Global Maize Market in Uganda Revenue Million Forecast, by Type (P 2020 & 2033
- Table 74: Global Maize Market in Uganda Volume k Tons Forecast, by Type (P 2020 & 2033
- Table 75: Global Maize Market in Uganda Revenue Million Forecast, by Type (P 2020 & 2033
- Table 76: Global Maize Market in Uganda Volume k Tons Forecast, by Type (P 2020 & 2033
- Table 77: Global Maize Market in Uganda Revenue Million Forecast, by Country 2020 & 2033
- Table 78: Global Maize Market in Uganda Volume k Tons Forecast, by Country 2020 & 2033
- Table 79: China Maize Market in Uganda Revenue (Million) Forecast, by Application 2020 & 2033
- Table 80: China Maize Market in Uganda Volume (k Tons) Forecast, by Application 2020 & 2033
- Table 81: India Maize Market in Uganda Revenue (Million) Forecast, by Application 2020 & 2033
- Table 82: India Maize Market in Uganda Volume (k Tons) Forecast, by Application 2020 & 2033
- Table 83: Japan Maize Market in Uganda Revenue (Million) Forecast, by Application 2020 & 2033
- Table 84: Japan Maize Market in Uganda Volume (k Tons) Forecast, by Application 2020 & 2033
- Table 85: South Korea Maize Market in Uganda Revenue (Million) Forecast, by Application 2020 & 2033
- Table 86: South Korea Maize Market in Uganda Volume (k Tons) Forecast, by Application 2020 & 2033
- Table 87: ASEAN Maize Market in Uganda Revenue (Million) Forecast, by Application 2020 & 2033
- Table 88: ASEAN Maize Market in Uganda Volume (k Tons) Forecast, by Application 2020 & 2033
- Table 89: Oceania Maize Market in Uganda Revenue (Million) Forecast, by Application 2020 & 2033
- Table 90: Oceania Maize Market in Uganda Volume (k Tons) Forecast, by Application 2020 & 2033
- Table 91: Rest of Asia Pacific Maize Market in Uganda Revenue (Million) Forecast, by Application 2020 & 2033
- Table 92: Rest of Asia Pacific Maize Market in Uganda Volume (k Tons) Forecast, by Application 2020 & 2033
Frequently Asked Questions
1. What is the projected Compound Annual Growth Rate (CAGR) of the Maize Market in Uganda?
The projected CAGR is approximately 4.10%.
2. Which companies are prominent players in the Maize Market in Uganda?
Key companies in the market include National Seed Company (NSC) , Simplot , Kampala Grain Milling Company , General Mills , Ardo , Kalangala Agro Processing Industries Ltd. , Unga Group , Seedco Uganda , McCain Foods , Bonduelle.
3. What are the main segments of the Maize Market in Uganda?
The market segments include Type (P, Type (P.
4. Can you provide details about the market size?
The market size is estimated to be USD 4.45 Million as of 2022.
5. What are some drivers contributing to market growth?
Favorable Climatic Conditions; Blooming Export Opportunities.
6. What are the notable trends driving market growth?
Increase in Regional Maize Exports is Driving the Market.
7. Are there any restraints impacting market growth?
High Adoption Cost of Modern Technology; Increasing Insect Infestations.
8. Can you provide examples of recent developments in the market?
August 2022: The Eastern Africa Grain Council (EAGC) has confirmed that the quality of maize in Uganda has improved by bringing farmers, traders, and processors together to fight against the prevalence of aflatoxin, which can be attributed to increased training of farmers, traders and processors on post-harvest management and storage practices by the government and private sector players.
9. What pricing options are available for accessing the report?
Pricing options include single-user, multi-user, and enterprise licenses priced at USD 3800, USD 4500, and USD 5800 respectively.
10. Is the market size provided in terms of value or volume?
The market size is provided in terms of value, measured in Million and volume, measured in k Tons.
11. Are there any specific market keywords associated with the report?
Yes, the market keyword associated with the report is "Maize Market in Uganda," which aids in identifying and referencing the specific market segment covered.
12. How do I determine which pricing option suits my needs best?
The pricing options vary based on user requirements and access needs. Individual users may opt for single-user licenses, while businesses requiring broader access may choose multi-user or enterprise licenses for cost-effective access to the report.
13. Are there any additional resources or data provided in the Maize Market in Uganda report?
While the report offers comprehensive insights, it's advisable to review the specific contents or supplementary materials provided to ascertain if additional resources or data are available.
14. How can I stay updated on further developments or reports in the Maize Market in Uganda?
To stay informed about further developments, trends, and reports in the Maize Market in Uganda, consider subscribing to industry newsletters, following relevant companies and organizations, or regularly checking reputable industry news sources and publications.
Methodology
Step 1 - Identification of Relevant Samples Size from Population Database


Step 2 - Approaches for Defining Global Market Size (Value, Volume* & Price*)

Note*: In applicable scenarios
Step 3 - Data Sources
Primary Research
- Web Analytics
- Survey Reports
- Research Institute
- Latest Research Reports
- Opinion Leaders
Secondary Research
- Annual Reports
- White Paper
- Latest Press Release
- Industry Association
- Paid Database
- Investor Presentations

Step 4 - Data Triangulation
Involves using different sources of information in order to increase the validity of a study
These sources are likely to be stakeholders in a program - participants, other researchers, program staff, other community members, and so on.
Then we put all data in single framework & apply various statistical tools to find out the dynamic on the market.
During the analysis stage, feedback from the stakeholder groups would be compared to determine areas of agreement as well as areas of divergence