

Key Insights
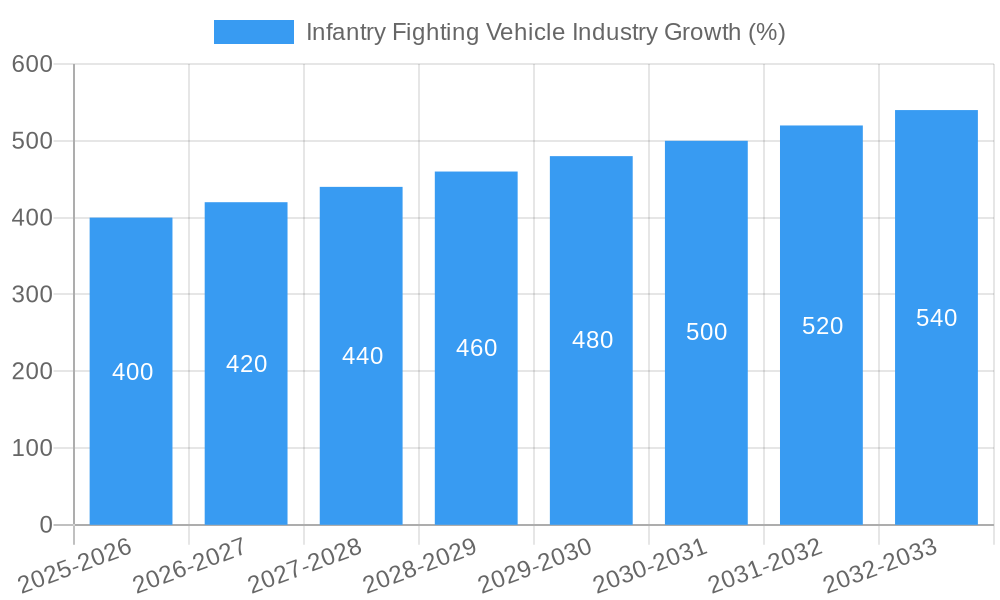
The global Infantry Fighting Vehicle (IFV) market, a crucial segment within the broader armored vehicle industry, is projected to experience robust growth over the forecast period (2025-2033). The market's current size, estimated at approximately $8 billion in 2025, is driven by escalating geopolitical instability, modernization efforts by armed forces globally, and the ongoing demand for technologically advanced, highly mobile combat vehicles. Key growth drivers include the increasing adoption of advanced technologies such as improved fire control systems, enhanced survivability features (like active protection systems), and network-centric warfare capabilities. Furthermore, the rising focus on asymmetric warfare and counter-insurgency operations fuels demand for IFVs capable of operating in diverse and challenging terrains. Competition among major players like General Dynamics, BAE Systems, and Rheinmetall is intense, prompting continuous innovation and the development of more sophisticated IFV platforms.
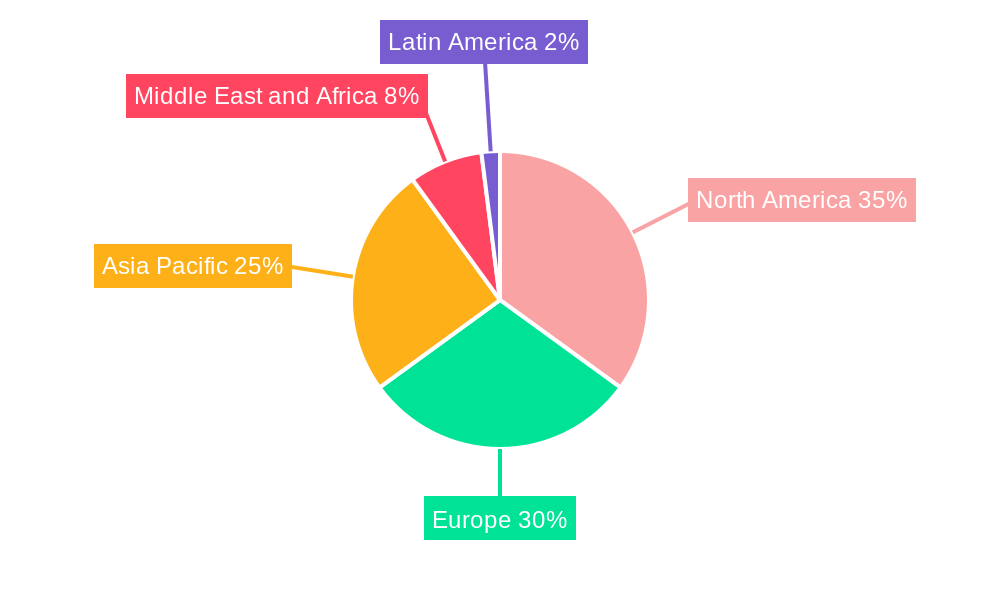
Significant regional variations exist. North America and Europe, historically dominant markets, are expected to maintain substantial market share, driven by robust defense budgets and ongoing military modernization programs. However, the Asia-Pacific region, particularly countries like India and China, is poised for significant growth, fueled by substantial defense investments and the need to upgrade aging equipment. The Middle East and Africa are also expected to contribute to market expansion, driven by regional conflicts and modernization initiatives. Despite the overall positive outlook, market growth may be constrained by budgetary limitations in certain regions and the increasing costs associated with developing and deploying advanced IFV technologies. This necessitates a careful balance between technological advancement and affordability for many nations.

Infantry Fighting Vehicle (IFV) Industry Market Report: 2019-2033
Uncover the Dynamics of the $XX Billion Infantry Fighting Vehicle Market with this comprehensive report covering the period 2019-2033. This in-depth analysis provides a detailed overview of the global Infantry Fighting Vehicle (IFV) industry, offering valuable insights for stakeholders, investors, and industry professionals. From market size and growth projections to key players and emerging trends, this report equips you with the knowledge to navigate the complexities of this dynamic sector.
Infantry Fighting Vehicle Industry Market Dynamics & Concentration
The global Infantry Fighting Vehicle (IFV) market, valued at $XX Billion in 2025, is characterized by a moderately concentrated landscape with several key players holding significant market share. Market concentration is influenced by factors such as high barriers to entry (substantial R&D investments, stringent regulatory approvals), economies of scale, and technological advancements. Innovation is a crucial driver, with ongoing research into advanced materials, improved protection systems, and enhanced weapon integration. Stringent regulatory frameworks concerning export controls and arms trade treaties further shape market dynamics. The industry experiences substitution effects to varying degrees, with advancements in unmanned ground vehicles (UGVs) and alternative combat platforms potentially impacting the demand for conventional IFVs. End-user trends, particularly evolving military modernization strategies and evolving geopolitical scenarios, heavily influence procurement patterns. Mergers and acquisitions (M&A) activity has been moderate, with key players focusing on strategic partnerships and collaborations to expand their market reach and technological capabilities.
- Market Share: The top 5 players collectively hold approximately XX% of the global market share in 2025.
- M&A Deal Count: An average of XX M&A deals were recorded annually in the historical period (2019-2024).
Infantry Fighting Vehicle Industry Industry Trends & Analysis
The global IFV market is projected to experience a Compound Annual Growth Rate (CAGR) of XX% during the forecast period (2025-2033), reaching a value of $XX Billion by 2033. This growth is driven by several factors including increasing defense budgets in key regions, modernization of existing fleets, and the adoption of advanced technologies like AI and autonomous systems. The market penetration of advanced IFV systems equipped with sophisticated sensors, communication systems, and lethality enhancements is steadily increasing. Technological disruptions, such as the development of lighter, more agile, and better protected vehicles, are transforming the industry landscape. The preferences of end-users are evolving toward multi-role platforms with enhanced situational awareness and adaptability to diverse operational environments. The competitive dynamics are characterized by fierce rivalry among leading players, marked by continuous innovation, cost optimization strategies, and strategic partnerships.
Leading Markets & Segments in Infantry Fighting Vehicle Industry
The Asia-Pacific region is expected to be the dominant market for IFVs during the forecast period, driven by substantial defense spending growth and modernization efforts in countries like India, China, and Japan. North America and Europe also remain significant markets.
Dominant Segments:
- Infantry Fighting Vehicle (IFV): This segment accounts for the largest market share due to their crucial role in modern warfare. Key drivers include ongoing modernization initiatives by major armies worldwide and the need for superior firepower and protection.
- Armored Personnel Carrier (APC): This segment exhibits steady growth, driven by the demand for troop transport and protection in various operational scenarios.
- Mine-resistant Ambush Protected (MRAP): Demand for MRAPs is relatively stable, influenced by ongoing counter-insurgency operations and peacekeeping missions.
Key Drivers (Regional variations):
- Asia-Pacific: Growing geopolitical tensions, rising defense budgets, and modernization drives.
- North America: Continued demand from the US military and modernization programs.
- Europe: Investment in collaborative defense programs and fleet upgrades.
Infantry Fighting Vehicle Industry Product Developments
Recent innovations in the IFV sector focus on enhancing survivability, mobility, and lethality. This includes the integration of advanced active protection systems, improved armor designs, and the incorporation of remotely controlled weapon stations. Modular designs are gaining prominence, allowing for easier customization and adaptability to specific mission requirements. These developments reflect the industry's continuous strive to meet the evolving needs of modern warfare, offering improved performance and operational effectiveness.
Key Drivers of Infantry Fighting Vehicle Industry Growth
The growth of the IFV industry is propelled by several factors: increasing geopolitical instability globally leading to a heightened need for military modernization, significant investments in defense technology by many nations, the introduction of more advanced and sophisticated IFVs such as those with AI integration, and the adoption of modular designs enabling customization. Governmental policies supportive of domestic defense industries and increased collaborations between nations for defense projects also contribute to market expansion.
Challenges in the Infantry Fighting Vehicle Industry Market
The IFV industry faces challenges including the high cost of research, development, and production, supply chain disruptions impacting manufacturing and procurement timelines, and intense competition among major manufacturers leading to price pressures and reduced profit margins. Stringent export regulations and trade restrictions add complexity to international sales, potentially hindering market growth.
Emerging Opportunities in Infantry Fighting Vehicle Industry
Significant growth opportunities exist in the integration of autonomous features, artificial intelligence, and improved network connectivity in IFVs. Strategic partnerships and joint ventures for technology sharing and co-development hold immense potential. Expanding into new markets with unmet defense needs, particularly in the developing world, promises substantial future growth.
Leading Players in the Infantry Fighting Vehicle Industry Sector
- Textron Inc
- FNSS Savunma Sistemleri A Ş
- Oshkosh Corporation
- General Dynamics Corporation
- Rheinmetall AG
- Elbit Systems Ltd
- Patria Group
- Denel SOC Ltd
- Saudi Arabian Military Industries (SAMI)
- Nexter Group
- BMC Otomotiv Sanayi ve Ticarest AS
- BAE Systems plc
- Hanwha Corporation
- Mitsubishi Heavy Industries Ltd
Key Milestones in Infantry Fighting Vehicle Industry Industry
- December 2022: Japan selected Patria-built armored modular vehicles (AMV) to replace the Type-96 8X8 wheeled armored personnel carriers of the Japan Ground Self-Defense Force. This significantly boosted Patria's market position in the Asia-Pacific region.
- March 2023: Australian and German officials signed an agreement to cooperate on the procurement of new combat reconnaissance vehicles based on the Boxer family of armored fighting vehicles. This signifies a strengthening of international collaboration in IFV procurement and highlights the Boxer platform's success.
Strategic Outlook for Infantry Fighting Vehicle Industry Market
The future of the IFV market is bright, driven by ongoing technological advancements, increasing defense budgets, and geopolitical instability. Companies focusing on innovation, strategic partnerships, and the development of adaptable, technologically advanced vehicles are poised to gain a significant competitive advantage. The market presents significant opportunities for growth and investment in the coming years, particularly in regions with high defense spending and modernization programs.
Infantry Fighting Vehicle Industry Segmentation
-
1. Type
- 1.1. Armored Personnel Carrier (APC)
- 1.2. Infantry Fighting Vehicle (IFV)
- 1.3. Mine-resistant Ambush Protected (MRAP)
- 1.4. Main Battle Tank (MBT)
- 1.5. Other Types
Infantry Fighting Vehicle Industry Segmentation By Geography
-
1. North America
- 1.1. United States
- 1.2. Canada
-
2. Europe
- 2.1. United Kingdom
- 2.2. France
- 2.3. Germany
- 2.4. Russia
- 2.5. Rest of Europe
-
3. Asia Pacific
- 3.1. China
- 3.2. India
- 3.3. Japan
- 3.4. South Korea
- 3.5. Rest of Asia Pacific
-
4. Latin America
- 4.1. Brazil
- 4.2. Rest of Latin America
-
5. Middle East and Africa
- 5.1. Saudi Arabia
- 5.2. United Arab Emirates
- 5.3. Turkey
- 5.4. Rest of Middle East and Africa
Infantry Fighting Vehicle Industry REPORT HIGHLIGHTS
| Aspects | Details |
|---|---|
| Study Period | 2019-2033 |
| Base Year | 2024 |
| Estimated Year | 2025 |
| Forecast Period | 2025-2033 |
| Historical Period | 2019-2024 |
| Growth Rate | CAGR of 4.99% from 2019-2033 |
| Segmentation |
|
Table of Contents
- 1. Introduction
- 1.1. Research Scope
- 1.2. Market Segmentation
- 1.3. Research Methodology
- 1.4. Definitions and Assumptions
- 2. Executive Summary
- 2.1. Introduction
- 3. Market Dynamics
- 3.1. Introduction
- 3.2. Market Drivers
- 3.3. Market Restrains
- 3.4. Market Trends
- 3.4.1. Infantry Fighting Vehicle (IFV) to Dominate Market Share
- 4. Market Factor Analysis
- 4.1. Porters Five Forces
- 4.2. Supply/Value Chain
- 4.3. PESTEL analysis
- 4.4. Market Entropy
- 4.5. Patent/Trademark Analysis
- 5. Global Infantry Fighting Vehicle Industry Analysis, Insights and Forecast, 2019-2031
- 5.1. Market Analysis, Insights and Forecast - by Type
- 5.1.1. Armored Personnel Carrier (APC)
- 5.1.2. Infantry Fighting Vehicle (IFV)
- 5.1.3. Mine-resistant Ambush Protected (MRAP)
- 5.1.4. Main Battle Tank (MBT)
- 5.1.5. Other Types
- 5.2. Market Analysis, Insights and Forecast - by Region
- 5.2.1. North America
- 5.2.2. Europe
- 5.2.3. Asia Pacific
- 5.2.4. Latin America
- 5.2.5. Middle East and Africa
- 5.1. Market Analysis, Insights and Forecast - by Type
- 6. North America Infantry Fighting Vehicle Industry Analysis, Insights and Forecast, 2019-2031
- 6.1. Market Analysis, Insights and Forecast - by Type
- 6.1.1. Armored Personnel Carrier (APC)
- 6.1.2. Infantry Fighting Vehicle (IFV)
- 6.1.3. Mine-resistant Ambush Protected (MRAP)
- 6.1.4. Main Battle Tank (MBT)
- 6.1.5. Other Types
- 6.1. Market Analysis, Insights and Forecast - by Type
- 7. Europe Infantry Fighting Vehicle Industry Analysis, Insights and Forecast, 2019-2031
- 7.1. Market Analysis, Insights and Forecast - by Type
- 7.1.1. Armored Personnel Carrier (APC)
- 7.1.2. Infantry Fighting Vehicle (IFV)
- 7.1.3. Mine-resistant Ambush Protected (MRAP)
- 7.1.4. Main Battle Tank (MBT)
- 7.1.5. Other Types
- 7.1. Market Analysis, Insights and Forecast - by Type
- 8. Asia Pacific Infantry Fighting Vehicle Industry Analysis, Insights and Forecast, 2019-2031
- 8.1. Market Analysis, Insights and Forecast - by Type
- 8.1.1. Armored Personnel Carrier (APC)
- 8.1.2. Infantry Fighting Vehicle (IFV)
- 8.1.3. Mine-resistant Ambush Protected (MRAP)
- 8.1.4. Main Battle Tank (MBT)
- 8.1.5. Other Types
- 8.1. Market Analysis, Insights and Forecast - by Type
- 9. Latin America Infantry Fighting Vehicle Industry Analysis, Insights and Forecast, 2019-2031
- 9.1. Market Analysis, Insights and Forecast - by Type
- 9.1.1. Armored Personnel Carrier (APC)
- 9.1.2. Infantry Fighting Vehicle (IFV)
- 9.1.3. Mine-resistant Ambush Protected (MRAP)
- 9.1.4. Main Battle Tank (MBT)
- 9.1.5. Other Types
- 9.1. Market Analysis, Insights and Forecast - by Type
- 10. Middle East and Africa Infantry Fighting Vehicle Industry Analysis, Insights and Forecast, 2019-2031
- 10.1. Market Analysis, Insights and Forecast - by Type
- 10.1.1. Armored Personnel Carrier (APC)
- 10.1.2. Infantry Fighting Vehicle (IFV)
- 10.1.3. Mine-resistant Ambush Protected (MRAP)
- 10.1.4. Main Battle Tank (MBT)
- 10.1.5. Other Types
- 10.1. Market Analysis, Insights and Forecast - by Type
- 11. North America Infantry Fighting Vehicle Industry Analysis, Insights and Forecast, 2019-2031
- 11.1. Market Analysis, Insights and Forecast - By Country/Sub-region
- 11.1.1 United States
- 11.1.2 Canada
- 12. Europe Infantry Fighting Vehicle Industry Analysis, Insights and Forecast, 2019-2031
- 12.1. Market Analysis, Insights and Forecast - By Country/Sub-region
- 12.1.1 United Kingdom
- 12.1.2 France
- 12.1.3 Germany
- 12.1.4 Russia
- 12.1.5 Rest of Europe
- 13. Asia Pacific Infantry Fighting Vehicle Industry Analysis, Insights and Forecast, 2019-2031
- 13.1. Market Analysis, Insights and Forecast - By Country/Sub-region
- 13.1.1 China
- 13.1.2 India
- 13.1.3 Japan
- 13.1.4 South Korea
- 13.1.5 Rest of Asia Pacific
- 14. Latin America Infantry Fighting Vehicle Industry Analysis, Insights and Forecast, 2019-2031
- 14.1. Market Analysis, Insights and Forecast - By Country/Sub-region
- 14.1.1 Brazil
- 14.1.2 Rest of Latin America
- 15. Middle East and Africa Infantry Fighting Vehicle Industry Analysis, Insights and Forecast, 2019-2031
- 15.1. Market Analysis, Insights and Forecast - By Country/Sub-region
- 15.1.1 Saudi Arabia
- 15.1.2 United Arab Emirates
- 15.1.3 Turkey
- 15.1.4 Rest of Middle East and Africa
- 16. Competitive Analysis
- 16.1. Global Market Share Analysis 2024
- 16.2. Company Profiles
- 16.2.1 Textron Inc
- 16.2.1.1. Overview
- 16.2.1.2. Products
- 16.2.1.3. SWOT Analysis
- 16.2.1.4. Recent Developments
- 16.2.1.5. Financials (Based on Availability)
- 16.2.2 FNSS Savunma Sistemleri A Ş
- 16.2.2.1. Overview
- 16.2.2.2. Products
- 16.2.2.3. SWOT Analysis
- 16.2.2.4. Recent Developments
- 16.2.2.5. Financials (Based on Availability)
- 16.2.3 Oshkosh Corporation
- 16.2.3.1. Overview
- 16.2.3.2. Products
- 16.2.3.3. SWOT Analysis
- 16.2.3.4. Recent Developments
- 16.2.3.5. Financials (Based on Availability)
- 16.2.4 General Dynamics Corporation
- 16.2.4.1. Overview
- 16.2.4.2. Products
- 16.2.4.3. SWOT Analysis
- 16.2.4.4. Recent Developments
- 16.2.4.5. Financials (Based on Availability)
- 16.2.5 Rheinmetall AG
- 16.2.5.1. Overview
- 16.2.5.2. Products
- 16.2.5.3. SWOT Analysis
- 16.2.5.4. Recent Developments
- 16.2.5.5. Financials (Based on Availability)
- 16.2.6 Elbit Systems Ltd
- 16.2.6.1. Overview
- 16.2.6.2. Products
- 16.2.6.3. SWOT Analysis
- 16.2.6.4. Recent Developments
- 16.2.6.5. Financials (Based on Availability)
- 16.2.7 Patria Group
- 16.2.7.1. Overview
- 16.2.7.2. Products
- 16.2.7.3. SWOT Analysis
- 16.2.7.4. Recent Developments
- 16.2.7.5. Financials (Based on Availability)
- 16.2.8 Denel SOC Ltd
- 16.2.8.1. Overview
- 16.2.8.2. Products
- 16.2.8.3. SWOT Analysis
- 16.2.8.4. Recent Developments
- 16.2.8.5. Financials (Based on Availability)
- 16.2.9 Saudi Arabian Military Industries (SAMI)
- 16.2.9.1. Overview
- 16.2.9.2. Products
- 16.2.9.3. SWOT Analysis
- 16.2.9.4. Recent Developments
- 16.2.9.5. Financials (Based on Availability)
- 16.2.10 Nexter Group
- 16.2.10.1. Overview
- 16.2.10.2. Products
- 16.2.10.3. SWOT Analysis
- 16.2.10.4. Recent Developments
- 16.2.10.5. Financials (Based on Availability)
- 16.2.11 BMC Otomotiv Sanayi ve Ticarest AS
- 16.2.11.1. Overview
- 16.2.11.2. Products
- 16.2.11.3. SWOT Analysis
- 16.2.11.4. Recent Developments
- 16.2.11.5. Financials (Based on Availability)
- 16.2.12 BAE Systems plc
- 16.2.12.1. Overview
- 16.2.12.2. Products
- 16.2.12.3. SWOT Analysis
- 16.2.12.4. Recent Developments
- 16.2.12.5. Financials (Based on Availability)
- 16.2.13 Hanwha Corporation
- 16.2.13.1. Overview
- 16.2.13.2. Products
- 16.2.13.3. SWOT Analysis
- 16.2.13.4. Recent Developments
- 16.2.13.5. Financials (Based on Availability)
- 16.2.14 Mitsubishi Heavy Industries Ltd
- 16.2.14.1. Overview
- 16.2.14.2. Products
- 16.2.14.3. SWOT Analysis
- 16.2.14.4. Recent Developments
- 16.2.14.5. Financials (Based on Availability)
- 16.2.1 Textron Inc
List of Figures
- Figure 1: Global Infantry Fighting Vehicle Industry Revenue Breakdown (Million, %) by Region 2024 & 2032
- Figure 2: North America Infantry Fighting Vehicle Industry Revenue (Million), by Country 2024 & 2032
- Figure 3: North America Infantry Fighting Vehicle Industry Revenue Share (%), by Country 2024 & 2032
- Figure 4: Europe Infantry Fighting Vehicle Industry Revenue (Million), by Country 2024 & 2032
- Figure 5: Europe Infantry Fighting Vehicle Industry Revenue Share (%), by Country 2024 & 2032
- Figure 6: Asia Pacific Infantry Fighting Vehicle Industry Revenue (Million), by Country 2024 & 2032
- Figure 7: Asia Pacific Infantry Fighting Vehicle Industry Revenue Share (%), by Country 2024 & 2032
- Figure 8: Latin America Infantry Fighting Vehicle Industry Revenue (Million), by Country 2024 & 2032
- Figure 9: Latin America Infantry Fighting Vehicle Industry Revenue Share (%), by Country 2024 & 2032
- Figure 10: Middle East and Africa Infantry Fighting Vehicle Industry Revenue (Million), by Country 2024 & 2032
- Figure 11: Middle East and Africa Infantry Fighting Vehicle Industry Revenue Share (%), by Country 2024 & 2032
- Figure 12: North America Infantry Fighting Vehicle Industry Revenue (Million), by Type 2024 & 2032
- Figure 13: North America Infantry Fighting Vehicle Industry Revenue Share (%), by Type 2024 & 2032
- Figure 14: North America Infantry Fighting Vehicle Industry Revenue (Million), by Country 2024 & 2032
- Figure 15: North America Infantry Fighting Vehicle Industry Revenue Share (%), by Country 2024 & 2032
- Figure 16: Europe Infantry Fighting Vehicle Industry Revenue (Million), by Type 2024 & 2032
- Figure 17: Europe Infantry Fighting Vehicle Industry Revenue Share (%), by Type 2024 & 2032
- Figure 18: Europe Infantry Fighting Vehicle Industry Revenue (Million), by Country 2024 & 2032
- Figure 19: Europe Infantry Fighting Vehicle Industry Revenue Share (%), by Country 2024 & 2032
- Figure 20: Asia Pacific Infantry Fighting Vehicle Industry Revenue (Million), by Type 2024 & 2032
- Figure 21: Asia Pacific Infantry Fighting Vehicle Industry Revenue Share (%), by Type 2024 & 2032
- Figure 22: Asia Pacific Infantry Fighting Vehicle Industry Revenue (Million), by Country 2024 & 2032
- Figure 23: Asia Pacific Infantry Fighting Vehicle Industry Revenue Share (%), by Country 2024 & 2032
- Figure 24: Latin America Infantry Fighting Vehicle Industry Revenue (Million), by Type 2024 & 2032
- Figure 25: Latin America Infantry Fighting Vehicle Industry Revenue Share (%), by Type 2024 & 2032
- Figure 26: Latin America Infantry Fighting Vehicle Industry Revenue (Million), by Country 2024 & 2032
- Figure 27: Latin America Infantry Fighting Vehicle Industry Revenue Share (%), by Country 2024 & 2032
- Figure 28: Middle East and Africa Infantry Fighting Vehicle Industry Revenue (Million), by Type 2024 & 2032
- Figure 29: Middle East and Africa Infantry Fighting Vehicle Industry Revenue Share (%), by Type 2024 & 2032
- Figure 30: Middle East and Africa Infantry Fighting Vehicle Industry Revenue (Million), by Country 2024 & 2032
- Figure 31: Middle East and Africa Infantry Fighting Vehicle Industry Revenue Share (%), by Country 2024 & 2032
List of Tables
- Table 1: Global Infantry Fighting Vehicle Industry Revenue Million Forecast, by Region 2019 & 2032
- Table 2: Global Infantry Fighting Vehicle Industry Revenue Million Forecast, by Type 2019 & 2032
- Table 3: Global Infantry Fighting Vehicle Industry Revenue Million Forecast, by Region 2019 & 2032
- Table 4: Global Infantry Fighting Vehicle Industry Revenue Million Forecast, by Country 2019 & 2032
- Table 5: United States Infantry Fighting Vehicle Industry Revenue (Million) Forecast, by Application 2019 & 2032
- Table 6: Canada Infantry Fighting Vehicle Industry Revenue (Million) Forecast, by Application 2019 & 2032
- Table 7: Global Infantry Fighting Vehicle Industry Revenue Million Forecast, by Country 2019 & 2032
- Table 8: United Kingdom Infantry Fighting Vehicle Industry Revenue (Million) Forecast, by Application 2019 & 2032
- Table 9: France Infantry Fighting Vehicle Industry Revenue (Million) Forecast, by Application 2019 & 2032
- Table 10: Germany Infantry Fighting Vehicle Industry Revenue (Million) Forecast, by Application 2019 & 2032
- Table 11: Russia Infantry Fighting Vehicle Industry Revenue (Million) Forecast, by Application 2019 & 2032
- Table 12: Rest of Europe Infantry Fighting Vehicle Industry Revenue (Million) Forecast, by Application 2019 & 2032
- Table 13: Global Infantry Fighting Vehicle Industry Revenue Million Forecast, by Country 2019 & 2032
- Table 14: China Infantry Fighting Vehicle Industry Revenue (Million) Forecast, by Application 2019 & 2032
- Table 15: India Infantry Fighting Vehicle Industry Revenue (Million) Forecast, by Application 2019 & 2032
- Table 16: Japan Infantry Fighting Vehicle Industry Revenue (Million) Forecast, by Application 2019 & 2032
- Table 17: South Korea Infantry Fighting Vehicle Industry Revenue (Million) Forecast, by Application 2019 & 2032
- Table 18: Rest of Asia Pacific Infantry Fighting Vehicle Industry Revenue (Million) Forecast, by Application 2019 & 2032
- Table 19: Global Infantry Fighting Vehicle Industry Revenue Million Forecast, by Country 2019 & 2032
- Table 20: Brazil Infantry Fighting Vehicle Industry Revenue (Million) Forecast, by Application 2019 & 2032
- Table 21: Rest of Latin America Infantry Fighting Vehicle Industry Revenue (Million) Forecast, by Application 2019 & 2032
- Table 22: Global Infantry Fighting Vehicle Industry Revenue Million Forecast, by Country 2019 & 2032
- Table 23: Saudi Arabia Infantry Fighting Vehicle Industry Revenue (Million) Forecast, by Application 2019 & 2032
- Table 24: United Arab Emirates Infantry Fighting Vehicle Industry Revenue (Million) Forecast, by Application 2019 & 2032
- Table 25: Turkey Infantry Fighting Vehicle Industry Revenue (Million) Forecast, by Application 2019 & 2032
- Table 26: Rest of Middle East and Africa Infantry Fighting Vehicle Industry Revenue (Million) Forecast, by Application 2019 & 2032
- Table 27: Global Infantry Fighting Vehicle Industry Revenue Million Forecast, by Type 2019 & 2032
- Table 28: Global Infantry Fighting Vehicle Industry Revenue Million Forecast, by Country 2019 & 2032
- Table 29: United States Infantry Fighting Vehicle Industry Revenue (Million) Forecast, by Application 2019 & 2032
- Table 30: Canada Infantry Fighting Vehicle Industry Revenue (Million) Forecast, by Application 2019 & 2032
- Table 31: Global Infantry Fighting Vehicle Industry Revenue Million Forecast, by Type 2019 & 2032
- Table 32: Global Infantry Fighting Vehicle Industry Revenue Million Forecast, by Country 2019 & 2032
- Table 33: United Kingdom Infantry Fighting Vehicle Industry Revenue (Million) Forecast, by Application 2019 & 2032
- Table 34: France Infantry Fighting Vehicle Industry Revenue (Million) Forecast, by Application 2019 & 2032
- Table 35: Germany Infantry Fighting Vehicle Industry Revenue (Million) Forecast, by Application 2019 & 2032
- Table 36: Russia Infantry Fighting Vehicle Industry Revenue (Million) Forecast, by Application 2019 & 2032
- Table 37: Rest of Europe Infantry Fighting Vehicle Industry Revenue (Million) Forecast, by Application 2019 & 2032
- Table 38: Global Infantry Fighting Vehicle Industry Revenue Million Forecast, by Type 2019 & 2032
- Table 39: Global Infantry Fighting Vehicle Industry Revenue Million Forecast, by Country 2019 & 2032
- Table 40: China Infantry Fighting Vehicle Industry Revenue (Million) Forecast, by Application 2019 & 2032
- Table 41: India Infantry Fighting Vehicle Industry Revenue (Million) Forecast, by Application 2019 & 2032
- Table 42: Japan Infantry Fighting Vehicle Industry Revenue (Million) Forecast, by Application 2019 & 2032
- Table 43: South Korea Infantry Fighting Vehicle Industry Revenue (Million) Forecast, by Application 2019 & 2032
- Table 44: Rest of Asia Pacific Infantry Fighting Vehicle Industry Revenue (Million) Forecast, by Application 2019 & 2032
- Table 45: Global Infantry Fighting Vehicle Industry Revenue Million Forecast, by Type 2019 & 2032
- Table 46: Global Infantry Fighting Vehicle Industry Revenue Million Forecast, by Country 2019 & 2032
- Table 47: Brazil Infantry Fighting Vehicle Industry Revenue (Million) Forecast, by Application 2019 & 2032
- Table 48: Rest of Latin America Infantry Fighting Vehicle Industry Revenue (Million) Forecast, by Application 2019 & 2032
- Table 49: Global Infantry Fighting Vehicle Industry Revenue Million Forecast, by Type 2019 & 2032
- Table 50: Global Infantry Fighting Vehicle Industry Revenue Million Forecast, by Country 2019 & 2032
- Table 51: Saudi Arabia Infantry Fighting Vehicle Industry Revenue (Million) Forecast, by Application 2019 & 2032
- Table 52: United Arab Emirates Infantry Fighting Vehicle Industry Revenue (Million) Forecast, by Application 2019 & 2032
- Table 53: Turkey Infantry Fighting Vehicle Industry Revenue (Million) Forecast, by Application 2019 & 2032
- Table 54: Rest of Middle East and Africa Infantry Fighting Vehicle Industry Revenue (Million) Forecast, by Application 2019 & 2032
Frequently Asked Questions
1. What is the projected Compound Annual Growth Rate (CAGR) of the Infantry Fighting Vehicle Industry?
The projected CAGR is approximately 4.99%.
2. Which companies are prominent players in the Infantry Fighting Vehicle Industry?
Key companies in the market include Textron Inc, FNSS Savunma Sistemleri A Ş, Oshkosh Corporation, General Dynamics Corporation, Rheinmetall AG, Elbit Systems Ltd, Patria Group, Denel SOC Ltd, Saudi Arabian Military Industries (SAMI), Nexter Group, BMC Otomotiv Sanayi ve Ticarest AS, BAE Systems plc, Hanwha Corporation, Mitsubishi Heavy Industries Ltd.
3. What are the main segments of the Infantry Fighting Vehicle Industry?
The market segments include Type.
4. Can you provide details about the market size?
The market size is estimated to be USD 25.25 Million as of 2022.
5. What are some drivers contributing to market growth?
N/A
6. What are the notable trends driving market growth?
Infantry Fighting Vehicle (IFV) to Dominate Market Share.
7. Are there any restraints impacting market growth?
N/A
8. Can you provide examples of recent developments in the market?
March 2023: Australian and German officials signed an agreement to cooperate on the procurement of the new combat reconnaissance vehicles, based on the Boxer family of armored fighting vehicles and equipped with a 30-millimeter gun. The deliveries will start in 2025.
9. What pricing options are available for accessing the report?
Pricing options include single-user, multi-user, and enterprise licenses priced at USD 4750, USD 5250, and USD 8750 respectively.
10. Is the market size provided in terms of value or volume?
The market size is provided in terms of value, measured in Million.
11. Are there any specific market keywords associated with the report?
Yes, the market keyword associated with the report is "Infantry Fighting Vehicle Industry," which aids in identifying and referencing the specific market segment covered.
12. How do I determine which pricing option suits my needs best?
The pricing options vary based on user requirements and access needs. Individual users may opt for single-user licenses, while businesses requiring broader access may choose multi-user or enterprise licenses for cost-effective access to the report.
13. Are there any additional resources or data provided in the Infantry Fighting Vehicle Industry report?
While the report offers comprehensive insights, it's advisable to review the specific contents or supplementary materials provided to ascertain if additional resources or data are available.
14. How can I stay updated on further developments or reports in the Infantry Fighting Vehicle Industry?
To stay informed about further developments, trends, and reports in the Infantry Fighting Vehicle Industry, consider subscribing to industry newsletters, following relevant companies and organizations, or regularly checking reputable industry news sources and publications.
Methodology
Step 1 - Identification of Relevant Samples Size from Population Database


Step 2 - Approaches for Defining Global Market Size (Value, Volume* & Price*)

Note*: In applicable scenarios
Step 3 - Data Sources
Primary Research
- Web Analytics
- Survey Reports
- Research Institute
- Latest Research Reports
- Opinion Leaders
Secondary Research
- Annual Reports
- White Paper
- Latest Press Release
- Industry Association
- Paid Database
- Investor Presentations

Step 4 - Data Triangulation
Involves using different sources of information in order to increase the validity of a study
These sources are likely to be stakeholders in a program - participants, other researchers, program staff, other community members, and so on.
Then we put all data in single framework & apply various statistical tools to find out the dynamic on the market.
During the analysis stage, feedback from the stakeholder groups would be compared to determine areas of agreement as well as areas of divergence
