

Key Insights
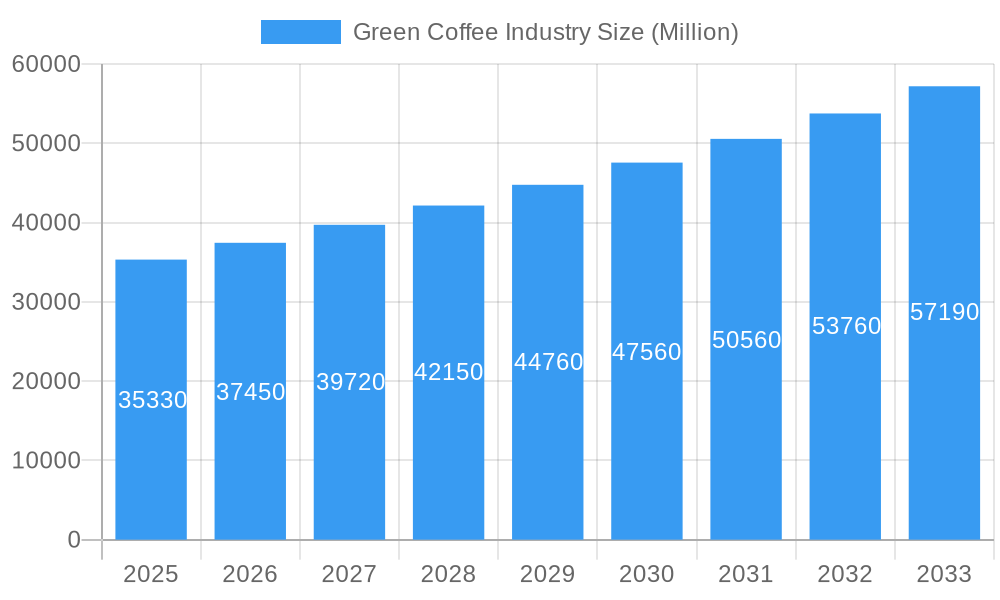
The global green coffee market, valued at $35.33 billion in 2025, is projected to experience robust growth, driven by a Compound Annual Growth Rate (CAGR) of 6.00% from 2025 to 2033. This expansion is fueled by several key factors. Increasing consumer demand for specialty coffee and ready-to-drink coffee beverages is a primary driver. Health-conscious consumers are increasingly seeking out natural and less processed options, boosting the appeal of green coffee beans. The rising popularity of coffee shops and cafes globally, along with the growth of the at-home coffee brewing market, further contribute to market expansion. Furthermore, innovative product development, such as single-serve pods and functional coffee blends with added health benefits, are driving consumption. While fluctuating coffee bean prices and potential supply chain disruptions pose challenges, the overall market outlook remains positive due to the long-term growth potential in emerging markets and expanding consumer bases in both developed and developing nations. The market segmentation reveals strong growth across all product types (Arabica, Robusta, and Others), applications (Beverage, Food, and Others), and end-users (Household and Commercial). Major players like Keurig Dr Pepper, Starbucks, Nestlé, and Olam International are strategically positioned to capitalize on this growth through expansion, product diversification, and acquisitions. Geographic growth is expected to be particularly strong in Asia-Pacific and South America, fueled by rising disposable incomes and growing coffee consumption habits in these regions.
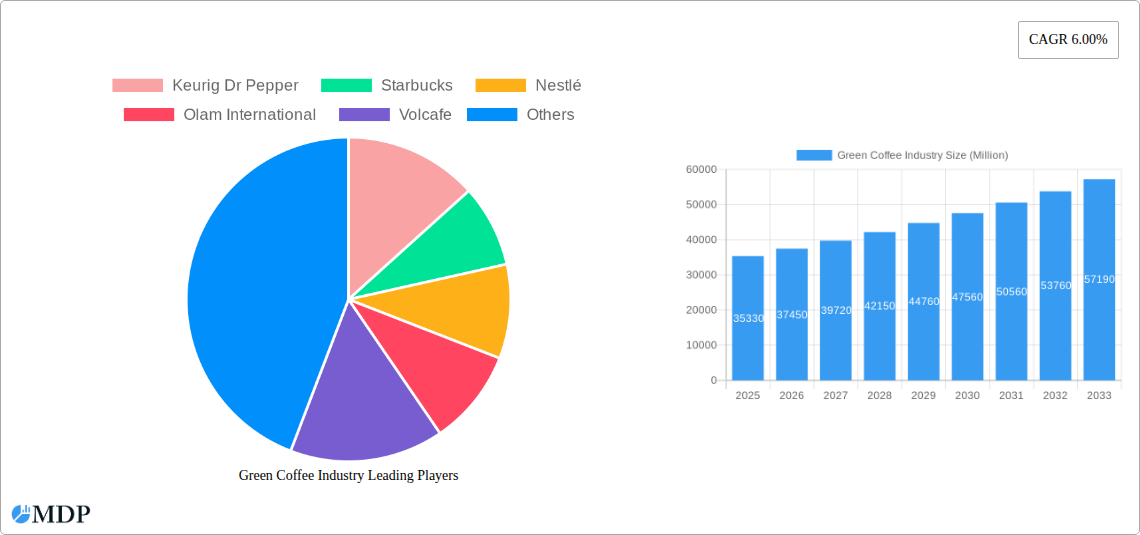
Green Coffee Industry Market Size (In Billion)
The sustained growth of the green coffee market depends on several factors, including effective supply chain management to mitigate the effects of climate change and price volatility. Sustainable farming practices and fair trade initiatives are becoming increasingly important for consumer preference and brand reputation. Companies are investing in ethical sourcing and transparency to maintain consumer trust. Technological advancements in coffee processing and roasting are also contributing to improvements in quality and efficiency, while marketing efforts focusing on the health benefits and sustainability aspects of green coffee will be crucial to maintain market momentum. The competitive landscape is dynamic, with both large multinational corporations and smaller specialty coffee roasters vying for market share. Successful players will be those who can adapt to evolving consumer preferences, embrace sustainable practices, and innovate to meet the demands of a growing and discerning market.
Green Coffee Industry Company Market Share
Green Coffee Industry Market Report: 2019-2033
This comprehensive report provides an in-depth analysis of the global green coffee industry, offering invaluable insights for stakeholders seeking to navigate this dynamic market. With a forecast period spanning 2025-2033, and a base year of 2025, this report leverages historical data (2019-2024) to project future trends and opportunities within a multi-billion-dollar market. The report covers key segments including Arabica, Robusta, and other coffee types, across beverage, food, and other applications, and encompassing household and commercial end-users. Leading players such as Keurig Dr Pepper, Starbucks, Nestlé, and Olam International are analyzed, offering a complete picture of the market landscape.
Green Coffee Industry Market Dynamics & Concentration
The global green coffee market, valued at $xx Billion in 2024, is characterized by a moderately concentrated landscape. While a few major players dominate, numerous smaller producers and regional players contribute significantly to overall production and distribution. Market concentration is primarily driven by the scale of operations and global reach of multinational companies, along with their strong brand recognition. However, innovation, particularly in sustainable farming practices and processing technologies, is driving entry by smaller, niche players focused on specialty coffee.
Market Drivers & Dynamics:
- Innovation: The market is driven by innovations in sustainable farming practices, processing techniques, and product diversification (e.g., single-origin coffees, flavored varieties).
- Regulatory Frameworks: Government regulations related to sustainability, fair trade, and product labeling influence market dynamics. Recent changes in India and Ethiopia (detailed in the Key Milestones section) will significantly reshape future production and trade.
- Product Substitutes: While coffee faces competition from tea and other beverages, its strong cultural relevance and established consumer base limit the impact of substitutes.
- End-User Trends: Growing consumer demand for ethically sourced and sustainably produced coffee fuels market growth. Premiumization, with a focus on quality and specialized products, is another significant trend.
- M&A Activities: The green coffee industry sees continuous consolidation, with larger companies acquiring smaller producers to enhance market share and vertical integration. Over the historical period (2019-2024), an estimated xx M&A deals occurred, involving companies like Nestle acquiring smaller roasters and exporters. These activities are projected to remain robust during the forecast period.
Green Coffee Industry Industry Trends & Analysis
The global green coffee market exhibits robust growth, with a projected CAGR of xx% during 2025-2033. Several key factors are driving this growth:
- Rising Disposable Incomes: Increasing disposable incomes, particularly in developing economies, are fueling higher coffee consumption globally.
- Changing Consumer Preferences: Consumers are increasingly seeking premium coffee experiences, including single-origin varieties, specialty blends, and ethically sourced beans, creating high-value opportunities.
- Technological Advancements: Innovations in roasting, brewing, and processing techniques enhance the quality and consistency of green coffee, contributing to product differentiation and market expansion.
- E-commerce Expansion: The growth of e-commerce platforms has widened the distribution channels for green coffee, enhancing accessibility and convenience for consumers.
Market penetration rates vary significantly across regions, with mature markets demonstrating stable consumption levels while emerging economies show substantial potential for future growth.
Leading Markets & Segments in Green Coffee Industry
The Arabica segment accounts for the largest market share (xx%), dominating the green coffee industry due to its superior flavor profile and widespread consumer preference. Brazil remains the leading producer, followed by Vietnam (Robusta focused). However, changing weather patterns and evolving consumer tastes are creating opportunities for other regions and varieties.
- Key Drivers by Segment:
- Arabica: Premiumization, demand for specialty coffee, and established supply chains.
- Robusta: Lower cost, high caffeine content, suitable for blends and instant coffee, growing demand from Asian markets.
- Others (Liberica, Excelsa): Niche markets, limited production.
- Beverage Application: Largest application, driven by high coffee consumption across the globe.
- Food Application: Growing use in desserts, chocolates, and other food products.
- Household End-User: The dominant segment, reflecting coffee's household staple status.
- Commercial End-User: Restaurant chains, cafes, and offices contribute significantly to coffee demand.
Green Coffee Industry Product Developments
Recent product developments focus on sustainable and ethical sourcing, single-origin coffees, and innovative processing techniques to enhance flavor profiles and reduce environmental impact. The industry is witnessing a growing demand for organic, fair-trade, and shade-grown coffee, reflecting the increasing consumer awareness of environmental and social responsibility. Technological innovations include advanced roasting techniques and precise extraction methods for better brew quality.
Key Drivers of Green Coffee Industry Growth
Growth is fueled by increasing disposable incomes worldwide, shifting consumer preference towards premium and specialty coffee, and expanding e-commerce channels. Government initiatives promoting sustainable farming practices and technological advancements in processing and roasting further contribute to industry expansion.
Challenges in the Green Coffee Industry Market
Climate change poses a significant threat, impacting coffee bean yields and quality. Supply chain disruptions, geopolitical instability, and price volatility create uncertainty for producers and traders. Competition among large and small players contributes to price pressures. The industry faces significant challenges in ensuring sustainable and ethical sourcing practices across its global supply chain.
Emerging Opportunities in Green Coffee Industry
The industry anticipates growth opportunities in sustainable farming practices, the increasing demand for premium, specialty coffees, and the expansion into new markets in developing countries. Strategic partnerships, technological innovations in processing and brewing, and diversification into related food products offer significant potential for future expansion.
Leading Players in the Green Coffee Industry Sector
Key Milestones in Green Coffee Industry Industry
- July 2021: The Rainforest Alliance launched a new sustainability certification program for coffee.
- July 2022: The Ethiopian Coffee and Tea Authority (ECTA) released a new strategy to triple coffee production in 10 years.
- July 2022: The Indian Government proposed a new Coffee Promotion and Development Bill to modernize the coffee industry.
Strategic Outlook for Green Coffee Industry Market
The green coffee industry is poised for continued growth, driven by increasing consumer demand, technological advancements, and a growing focus on sustainability. Strategic partnerships, investments in sustainable farming practices, and expansion into new markets will be key to maximizing future market potential. The market is expected to see continued consolidation, with larger players acquiring smaller companies to strengthen their market positions. Innovation and sustainability will remain crucial factors influencing market dynamics and consumer preferences.
Green Coffee Industry Segmentation
- 1. Production Analysis
- 2. Consumption Analysis
- 3. Import Market Analysis (Value & Volume)
- 4. Export Market Analysis (Value & Volume)
- 5. Price Trend Analysis
Green Coffee Industry Segmentation By Geography
-
1. North America
- 1.1. United States
- 1.2. Canada
- 1.3. Mexico
-
2. Europe
- 2.1. Germany
- 2.2. United Kingdom
- 2.3. Spain
- 2.4. France
- 2.5. Italy
- 2.6. Belgium
- 2.7. Russia
-
3. Asia Pacific
- 3.1. China
- 3.2. Vietnam
- 3.3. Indonesia
- 3.4. India
- 3.5. Japan
-
4. South America
- 4.1. Brazil
- 4.2. Colombia
-
5. Middle East and Africa
- 5.1. Uganda
- 5.2. Ethiopia
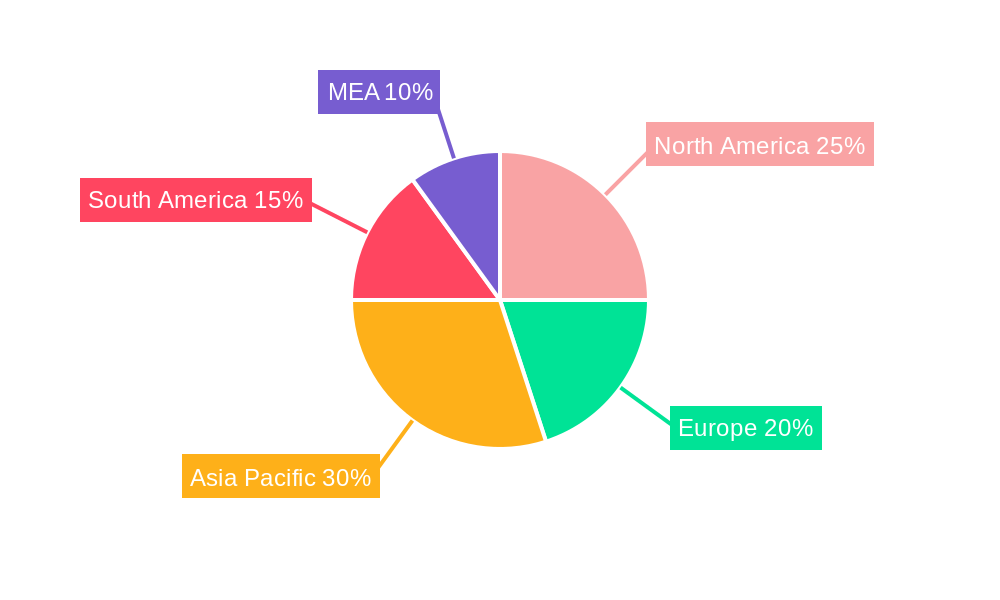
Green Coffee Industry Regional Market Share
Geographic Coverage of Green Coffee Industry
Green Coffee Industry REPORT HIGHLIGHTS
| Aspects | Details |
|---|---|
| Study Period | 2020-2034 |
| Base Year | 2025 |
| Estimated Year | 2026 |
| Forecast Period | 2026-2034 |
| Historical Period | 2020-2025 |
| Growth Rate | CAGR of 6.00% from 2020-2034 |
| Segmentation |
|
Table of Contents
- 1. Introduction
- 1.1. Research Scope
- 1.2. Market Segmentation
- 1.3. Research Objective
- 1.4. Definitions and Assumptions
- 2. Executive Summary
- 2.1. Market Snapshot
- 3. Market Dynamics
- 3.1. Market Drivers
- 3.2. Market Restrains
- 3.3. Market Trends
- 3.4. Market Opportunities
- 4. Market Factor Analysis
- 4.1. Porters Five Forces
- 4.1.1. Bargaining Power of Suppliers
- 4.1.2. Bargaining Power of Buyers
- 4.1.3. Threat of New Entrants
- 4.1.4. Threat of Substitutes
- 4.1.5. Competitive Rivalry
- 4.2. PESTEL analysis
- 4.3. BCG Analysis
- 4.3.1. Stars (High Growth, High Market Share)
- 4.3.2. Cash Cows (Low Growth, High Market Share)
- 4.3.3. Question Mark (High Growth, Low Market Share)
- 4.3.4. Dogs (Low Growth, Low Market Share)
- 4.4. Ansoff Matrix Analysis
- 4.5. Supply Chain Analysis
- 4.6. Regulatory Landscape
- 4.7. Current Market Potential and Opportunity Assessment (TAM–SAM–SOM Framework)
- 4.8. MDP Analyst Note
- 4.1. Porters Five Forces
- 5. Market Analysis, Insights and Forecast 2021-2033
- 5.1. Market Analysis, Insights and Forecast - by Production Analysis
- 5.2. Market Analysis, Insights and Forecast - by Consumption Analysis
- 5.3. Market Analysis, Insights and Forecast - by Import Market Analysis (Value & Volume)
- 5.4. Market Analysis, Insights and Forecast - by Export Market Analysis (Value & Volume)
- 5.5. Market Analysis, Insights and Forecast - by Price Trend Analysis
- 5.6. Market Analysis, Insights and Forecast - by Region
- 5.6.1. North America
- 5.6.2. Europe
- 5.6.3. Asia Pacific
- 5.6.4. South America
- 5.6.5. Middle East and Africa
- 6. Global Green Coffee Industry Analysis, Insights and Forecast, 2021-2033
- 6.1. Market Analysis, Insights and Forecast - by Production Analysis
- 6.2. Market Analysis, Insights and Forecast - by Consumption Analysis
- 6.3. Market Analysis, Insights and Forecast - by Import Market Analysis (Value & Volume)
- 6.4. Market Analysis, Insights and Forecast - by Export Market Analysis (Value & Volume)
- 6.5. Market Analysis, Insights and Forecast - by Price Trend Analysis
- 7. North America Green Coffee Industry Analysis, Insights and Forecast, 2020-2032
- 7.1. Market Analysis, Insights and Forecast - by Production Analysis
- 7.2. Market Analysis, Insights and Forecast - by Consumption Analysis
- 7.3. Market Analysis, Insights and Forecast - by Import Market Analysis (Value & Volume)
- 7.4. Market Analysis, Insights and Forecast - by Export Market Analysis (Value & Volume)
- 7.5. Market Analysis, Insights and Forecast - by Price Trend Analysis
- 8. Europe Green Coffee Industry Analysis, Insights and Forecast, 2020-2032
- 8.1. Market Analysis, Insights and Forecast - by Production Analysis
- 8.2. Market Analysis, Insights and Forecast - by Consumption Analysis
- 8.3. Market Analysis, Insights and Forecast - by Import Market Analysis (Value & Volume)
- 8.4. Market Analysis, Insights and Forecast - by Export Market Analysis (Value & Volume)
- 8.5. Market Analysis, Insights and Forecast - by Price Trend Analysis
- 9. Asia Pacific Green Coffee Industry Analysis, Insights and Forecast, 2020-2032
- 9.1. Market Analysis, Insights and Forecast - by Production Analysis
- 9.2. Market Analysis, Insights and Forecast - by Consumption Analysis
- 9.3. Market Analysis, Insights and Forecast - by Import Market Analysis (Value & Volume)
- 9.4. Market Analysis, Insights and Forecast - by Export Market Analysis (Value & Volume)
- 9.5. Market Analysis, Insights and Forecast - by Price Trend Analysis
- 10. South America Green Coffee Industry Analysis, Insights and Forecast, 2020-2032
- 10.1. Market Analysis, Insights and Forecast - by Production Analysis
- 10.2. Market Analysis, Insights and Forecast - by Consumption Analysis
- 10.3. Market Analysis, Insights and Forecast - by Import Market Analysis (Value & Volume)
- 10.4. Market Analysis, Insights and Forecast - by Export Market Analysis (Value & Volume)
- 10.5. Market Analysis, Insights and Forecast - by Price Trend Analysis
- 11. Middle East and Africa Green Coffee Industry Analysis, Insights and Forecast, 2020-2032
- 11.1. Market Analysis, Insights and Forecast - by Production Analysis
- 11.2. Market Analysis, Insights and Forecast - by Consumption Analysis
- 11.3. Market Analysis, Insights and Forecast - by Import Market Analysis (Value & Volume)
- 11.4. Market Analysis, Insights and Forecast - by Export Market Analysis (Value & Volume)
- 11.5. Market Analysis, Insights and Forecast - by Price Trend Analysis
- 12. Competitive Analysis
- 12.1. Company Profiles
- 12.1.1 Keurig Dr Pepper
- 12.1.1.1. Company Overview
- 12.1.1.2. Products
- 12.1.1.3. Company Financials
- 12.1.1.4. SWOT Analysis
- 12.1.2 Starbucks
- 12.1.2.1. Company Overview
- 12.1.2.2. Products
- 12.1.2.3. Company Financials
- 12.1.2.4. SWOT Analysis
- 12.1.3 Nestlé
- 12.1.3.1. Company Overview
- 12.1.3.2. Products
- 12.1.3.3. Company Financials
- 12.1.3.4. SWOT Analysis
- 12.1.4 Olam International
- 12.1.4.1. Company Overview
- 12.1.4.2. Products
- 12.1.4.3. Company Financials
- 12.1.4.4. SWOT Analysis
- 12.1.5 Volcafe
- 12.1.5.1. Company Overview
- 12.1.5.2. Products
- 12.1.5.3. Company Financials
- 12.1.5.4. SWOT Analysis
- 12.1.6 Jacobs Douwe Egberts
- 12.1.6.1. Company Overview
- 12.1.6.2. Products
- 12.1.6.3. Company Financials
- 12.1.6.4. SWOT Analysis
- 12.1.7 Lavazza illycaffè
- 12.1.7.1. Company Overview
- 12.1.7.2. Products
- 12.1.7.3. Company Financials
- 12.1.7.4. SWOT Analysis
- 12.1.8 J.M. Smucker
- 12.1.8.1. Company Overview
- 12.1.8.2. Products
- 12.1.8.3. Company Financials
- 12.1.8.4. SWOT Analysis
- 12.1.9 Kraft Heinz
- 12.1.9.1. Company Overview
- 12.1.9.2. Products
- 12.1.9.3. Company Financials
- 12.1.9.4. SWOT Analysis
- 12.1.1 Keurig Dr Pepper
- 12.2. Market Entropy
- 12.2.1 Company's Key Areas Served
- 12.2.2 Recent Developments
- 12.3. Company Market Share Analysis 2025
- 12.3.1 Top 5 Companies Market Share Analysis
- 12.3.2 Top 3 Companies Market Share Analysis
- 12.4. List of Potential Customers
- 13. Research Methodology
List of Figures
- Figure 1: Global Green Coffee Industry Revenue Breakdown (Million, %) by Region 2025 & 2033
- Figure 2: North America Green Coffee Industry Revenue (Million), by Production Analysis 2025 & 2033
- Figure 3: North America Green Coffee Industry Revenue Share (%), by Production Analysis 2025 & 2033
- Figure 4: North America Green Coffee Industry Revenue (Million), by Consumption Analysis 2025 & 2033
- Figure 5: North America Green Coffee Industry Revenue Share (%), by Consumption Analysis 2025 & 2033
- Figure 6: North America Green Coffee Industry Revenue (Million), by Import Market Analysis (Value & Volume) 2025 & 2033
- Figure 7: North America Green Coffee Industry Revenue Share (%), by Import Market Analysis (Value & Volume) 2025 & 2033
- Figure 8: North America Green Coffee Industry Revenue (Million), by Export Market Analysis (Value & Volume) 2025 & 2033
- Figure 9: North America Green Coffee Industry Revenue Share (%), by Export Market Analysis (Value & Volume) 2025 & 2033
- Figure 10: North America Green Coffee Industry Revenue (Million), by Price Trend Analysis 2025 & 2033
- Figure 11: North America Green Coffee Industry Revenue Share (%), by Price Trend Analysis 2025 & 2033
- Figure 12: North America Green Coffee Industry Revenue (Million), by Country 2025 & 2033
- Figure 13: North America Green Coffee Industry Revenue Share (%), by Country 2025 & 2033
- Figure 14: Europe Green Coffee Industry Revenue (Million), by Production Analysis 2025 & 2033
- Figure 15: Europe Green Coffee Industry Revenue Share (%), by Production Analysis 2025 & 2033
- Figure 16: Europe Green Coffee Industry Revenue (Million), by Consumption Analysis 2025 & 2033
- Figure 17: Europe Green Coffee Industry Revenue Share (%), by Consumption Analysis 2025 & 2033
- Figure 18: Europe Green Coffee Industry Revenue (Million), by Import Market Analysis (Value & Volume) 2025 & 2033
- Figure 19: Europe Green Coffee Industry Revenue Share (%), by Import Market Analysis (Value & Volume) 2025 & 2033
- Figure 20: Europe Green Coffee Industry Revenue (Million), by Export Market Analysis (Value & Volume) 2025 & 2033
- Figure 21: Europe Green Coffee Industry Revenue Share (%), by Export Market Analysis (Value & Volume) 2025 & 2033
- Figure 22: Europe Green Coffee Industry Revenue (Million), by Price Trend Analysis 2025 & 2033
- Figure 23: Europe Green Coffee Industry Revenue Share (%), by Price Trend Analysis 2025 & 2033
- Figure 24: Europe Green Coffee Industry Revenue (Million), by Country 2025 & 2033
- Figure 25: Europe Green Coffee Industry Revenue Share (%), by Country 2025 & 2033
- Figure 26: Asia Pacific Green Coffee Industry Revenue (Million), by Production Analysis 2025 & 2033
- Figure 27: Asia Pacific Green Coffee Industry Revenue Share (%), by Production Analysis 2025 & 2033
- Figure 28: Asia Pacific Green Coffee Industry Revenue (Million), by Consumption Analysis 2025 & 2033
- Figure 29: Asia Pacific Green Coffee Industry Revenue Share (%), by Consumption Analysis 2025 & 2033
- Figure 30: Asia Pacific Green Coffee Industry Revenue (Million), by Import Market Analysis (Value & Volume) 2025 & 2033
- Figure 31: Asia Pacific Green Coffee Industry Revenue Share (%), by Import Market Analysis (Value & Volume) 2025 & 2033
- Figure 32: Asia Pacific Green Coffee Industry Revenue (Million), by Export Market Analysis (Value & Volume) 2025 & 2033
- Figure 33: Asia Pacific Green Coffee Industry Revenue Share (%), by Export Market Analysis (Value & Volume) 2025 & 2033
- Figure 34: Asia Pacific Green Coffee Industry Revenue (Million), by Price Trend Analysis 2025 & 2033
- Figure 35: Asia Pacific Green Coffee Industry Revenue Share (%), by Price Trend Analysis 2025 & 2033
- Figure 36: Asia Pacific Green Coffee Industry Revenue (Million), by Country 2025 & 2033
- Figure 37: Asia Pacific Green Coffee Industry Revenue Share (%), by Country 2025 & 2033
- Figure 38: South America Green Coffee Industry Revenue (Million), by Production Analysis 2025 & 2033
- Figure 39: South America Green Coffee Industry Revenue Share (%), by Production Analysis 2025 & 2033
- Figure 40: South America Green Coffee Industry Revenue (Million), by Consumption Analysis 2025 & 2033
- Figure 41: South America Green Coffee Industry Revenue Share (%), by Consumption Analysis 2025 & 2033
- Figure 42: South America Green Coffee Industry Revenue (Million), by Import Market Analysis (Value & Volume) 2025 & 2033
- Figure 43: South America Green Coffee Industry Revenue Share (%), by Import Market Analysis (Value & Volume) 2025 & 2033
- Figure 44: South America Green Coffee Industry Revenue (Million), by Export Market Analysis (Value & Volume) 2025 & 2033
- Figure 45: South America Green Coffee Industry Revenue Share (%), by Export Market Analysis (Value & Volume) 2025 & 2033
- Figure 46: South America Green Coffee Industry Revenue (Million), by Price Trend Analysis 2025 & 2033
- Figure 47: South America Green Coffee Industry Revenue Share (%), by Price Trend Analysis 2025 & 2033
- Figure 48: South America Green Coffee Industry Revenue (Million), by Country 2025 & 2033
- Figure 49: South America Green Coffee Industry Revenue Share (%), by Country 2025 & 2033
- Figure 50: Middle East and Africa Green Coffee Industry Revenue (Million), by Production Analysis 2025 & 2033
- Figure 51: Middle East and Africa Green Coffee Industry Revenue Share (%), by Production Analysis 2025 & 2033
- Figure 52: Middle East and Africa Green Coffee Industry Revenue (Million), by Consumption Analysis 2025 & 2033
- Figure 53: Middle East and Africa Green Coffee Industry Revenue Share (%), by Consumption Analysis 2025 & 2033
- Figure 54: Middle East and Africa Green Coffee Industry Revenue (Million), by Import Market Analysis (Value & Volume) 2025 & 2033
- Figure 55: Middle East and Africa Green Coffee Industry Revenue Share (%), by Import Market Analysis (Value & Volume) 2025 & 2033
- Figure 56: Middle East and Africa Green Coffee Industry Revenue (Million), by Export Market Analysis (Value & Volume) 2025 & 2033
- Figure 57: Middle East and Africa Green Coffee Industry Revenue Share (%), by Export Market Analysis (Value & Volume) 2025 & 2033
- Figure 58: Middle East and Africa Green Coffee Industry Revenue (Million), by Price Trend Analysis 2025 & 2033
- Figure 59: Middle East and Africa Green Coffee Industry Revenue Share (%), by Price Trend Analysis 2025 & 2033
- Figure 60: Middle East and Africa Green Coffee Industry Revenue (Million), by Country 2025 & 2033
- Figure 61: Middle East and Africa Green Coffee Industry Revenue Share (%), by Country 2025 & 2033
List of Tables
- Table 1: Global Green Coffee Industry Revenue Million Forecast, by Production Analysis 2020 & 2033
- Table 2: Global Green Coffee Industry Revenue Million Forecast, by Consumption Analysis 2020 & 2033
- Table 3: Global Green Coffee Industry Revenue Million Forecast, by Import Market Analysis (Value & Volume) 2020 & 2033
- Table 4: Global Green Coffee Industry Revenue Million Forecast, by Export Market Analysis (Value & Volume) 2020 & 2033
- Table 5: Global Green Coffee Industry Revenue Million Forecast, by Price Trend Analysis 2020 & 2033
- Table 6: Global Green Coffee Industry Revenue Million Forecast, by Region 2020 & 2033
- Table 7: Global Green Coffee Industry Revenue Million Forecast, by Production Analysis 2020 & 2033
- Table 8: Global Green Coffee Industry Revenue Million Forecast, by Consumption Analysis 2020 & 2033
- Table 9: Global Green Coffee Industry Revenue Million Forecast, by Import Market Analysis (Value & Volume) 2020 & 2033
- Table 10: Global Green Coffee Industry Revenue Million Forecast, by Export Market Analysis (Value & Volume) 2020 & 2033
- Table 11: Global Green Coffee Industry Revenue Million Forecast, by Price Trend Analysis 2020 & 2033
- Table 12: Global Green Coffee Industry Revenue Million Forecast, by Country 2020 & 2033
- Table 13: United States Green Coffee Industry Revenue (Million) Forecast, by Application 2020 & 2033
- Table 14: Canada Green Coffee Industry Revenue (Million) Forecast, by Application 2020 & 2033
- Table 15: Mexico Green Coffee Industry Revenue (Million) Forecast, by Application 2020 & 2033
- Table 16: Global Green Coffee Industry Revenue Million Forecast, by Production Analysis 2020 & 2033
- Table 17: Global Green Coffee Industry Revenue Million Forecast, by Consumption Analysis 2020 & 2033
- Table 18: Global Green Coffee Industry Revenue Million Forecast, by Import Market Analysis (Value & Volume) 2020 & 2033
- Table 19: Global Green Coffee Industry Revenue Million Forecast, by Export Market Analysis (Value & Volume) 2020 & 2033
- Table 20: Global Green Coffee Industry Revenue Million Forecast, by Price Trend Analysis 2020 & 2033
- Table 21: Global Green Coffee Industry Revenue Million Forecast, by Country 2020 & 2033
- Table 22: Germany Green Coffee Industry Revenue (Million) Forecast, by Application 2020 & 2033
- Table 23: United Kingdom Green Coffee Industry Revenue (Million) Forecast, by Application 2020 & 2033
- Table 24: Spain Green Coffee Industry Revenue (Million) Forecast, by Application 2020 & 2033
- Table 25: France Green Coffee Industry Revenue (Million) Forecast, by Application 2020 & 2033
- Table 26: Italy Green Coffee Industry Revenue (Million) Forecast, by Application 2020 & 2033
- Table 27: Belgium Green Coffee Industry Revenue (Million) Forecast, by Application 2020 & 2033
- Table 28: Russia Green Coffee Industry Revenue (Million) Forecast, by Application 2020 & 2033
- Table 29: Global Green Coffee Industry Revenue Million Forecast, by Production Analysis 2020 & 2033
- Table 30: Global Green Coffee Industry Revenue Million Forecast, by Consumption Analysis 2020 & 2033
- Table 31: Global Green Coffee Industry Revenue Million Forecast, by Import Market Analysis (Value & Volume) 2020 & 2033
- Table 32: Global Green Coffee Industry Revenue Million Forecast, by Export Market Analysis (Value & Volume) 2020 & 2033
- Table 33: Global Green Coffee Industry Revenue Million Forecast, by Price Trend Analysis 2020 & 2033
- Table 34: Global Green Coffee Industry Revenue Million Forecast, by Country 2020 & 2033
- Table 35: China Green Coffee Industry Revenue (Million) Forecast, by Application 2020 & 2033
- Table 36: Vietnam Green Coffee Industry Revenue (Million) Forecast, by Application 2020 & 2033
- Table 37: Indonesia Green Coffee Industry Revenue (Million) Forecast, by Application 2020 & 2033
- Table 38: India Green Coffee Industry Revenue (Million) Forecast, by Application 2020 & 2033
- Table 39: Japan Green Coffee Industry Revenue (Million) Forecast, by Application 2020 & 2033
- Table 40: Global Green Coffee Industry Revenue Million Forecast, by Production Analysis 2020 & 2033
- Table 41: Global Green Coffee Industry Revenue Million Forecast, by Consumption Analysis 2020 & 2033
- Table 42: Global Green Coffee Industry Revenue Million Forecast, by Import Market Analysis (Value & Volume) 2020 & 2033
- Table 43: Global Green Coffee Industry Revenue Million Forecast, by Export Market Analysis (Value & Volume) 2020 & 2033
- Table 44: Global Green Coffee Industry Revenue Million Forecast, by Price Trend Analysis 2020 & 2033
- Table 45: Global Green Coffee Industry Revenue Million Forecast, by Country 2020 & 2033
- Table 46: Brazil Green Coffee Industry Revenue (Million) Forecast, by Application 2020 & 2033
- Table 47: Colombia Green Coffee Industry Revenue (Million) Forecast, by Application 2020 & 2033
- Table 48: Global Green Coffee Industry Revenue Million Forecast, by Production Analysis 2020 & 2033
- Table 49: Global Green Coffee Industry Revenue Million Forecast, by Consumption Analysis 2020 & 2033
- Table 50: Global Green Coffee Industry Revenue Million Forecast, by Import Market Analysis (Value & Volume) 2020 & 2033
- Table 51: Global Green Coffee Industry Revenue Million Forecast, by Export Market Analysis (Value & Volume) 2020 & 2033
- Table 52: Global Green Coffee Industry Revenue Million Forecast, by Price Trend Analysis 2020 & 2033
- Table 53: Global Green Coffee Industry Revenue Million Forecast, by Country 2020 & 2033
- Table 54: Uganda Green Coffee Industry Revenue (Million) Forecast, by Application 2020 & 2033
- Table 55: Ethiopia Green Coffee Industry Revenue (Million) Forecast, by Application 2020 & 2033
Frequently Asked Questions
1. What is the projected Compound Annual Growth Rate (CAGR) of the Green Coffee Industry?
The projected CAGR is approximately 6.00%.
2. Which companies are prominent players in the Green Coffee Industry?
Key companies in the market include Keurig Dr Pepper , Starbucks , Nestlé , Olam International , Volcafe, Jacobs Douwe Egberts , Lavazza illycaffè , J.M. Smucker , Kraft Heinz .
3. What are the main segments of the Green Coffee Industry?
The market segments include Production Analysis, Consumption Analysis, Import Market Analysis (Value & Volume), Export Market Analysis (Value & Volume), Price Trend Analysis.
4. Can you provide details about the market size?
The market size is estimated to be USD 35.33 Million as of 2022.
5. What are some drivers contributing to market growth?
Increasing Berry Consumption for Health Benefits; Increasing Adoption of High-Technology Farm Practices; Growing Usage of Berries in the Food and Beverage Industries.
6. What are the notable trends driving market growth?
Increasing Demand for Certified Coffee.
7. Are there any restraints impacting market growth?
High Production Cost Involved in Berry Production; Increasing Disease and Pest Infestations.
8. Can you provide examples of recent developments in the market?
July 2022: The Ethiopian Coffee and Tea Authority (ECTA) released a new, comprehensive strategy for the country's coffee sector, which was developed in collaboration with the Ethiopian Institute of Agriculture Research (EIAR) and international nonprofit TechnoServe to increase coffee production by three times within next 10 years.
9. What pricing options are available for accessing the report?
Pricing options include single-user, multi-user, and enterprise licenses priced at USD 4750, USD 5250, and USD 8750 respectively.
10. Is the market size provided in terms of value or volume?
The market size is provided in terms of value, measured in Million.
11. Are there any specific market keywords associated with the report?
Yes, the market keyword associated with the report is "Green Coffee Industry," which aids in identifying and referencing the specific market segment covered.
12. How do I determine which pricing option suits my needs best?
The pricing options vary based on user requirements and access needs. Individual users may opt for single-user licenses, while businesses requiring broader access may choose multi-user or enterprise licenses for cost-effective access to the report.
13. Are there any additional resources or data provided in the Green Coffee Industry report?
While the report offers comprehensive insights, it's advisable to review the specific contents or supplementary materials provided to ascertain if additional resources or data are available.
14. How can I stay updated on further developments or reports in the Green Coffee Industry?
To stay informed about further developments, trends, and reports in the Green Coffee Industry, consider subscribing to industry newsletters, following relevant companies and organizations, or regularly checking reputable industry news sources and publications.
Methodology
Step 1 - Identification of Relevant Samples Size from Population Database


Step 2 - Approaches for Defining Global Market Size (Value, Volume* & Price*)

Note*: In applicable scenarios
Step 3 - Data Sources
Primary Research
- Web Analytics
- Survey Reports
- Research Institute
- Latest Research Reports
- Opinion Leaders
Secondary Research
- Annual Reports
- White Paper
- Latest Press Release
- Industry Association
- Paid Database
- Investor Presentations

Step 4 - Data Triangulation
Involves using different sources of information in order to increase the validity of a study
These sources are likely to be stakeholders in a program - participants, other researchers, program staff, other community members, and so on.
Then we put all data in single framework & apply various statistical tools to find out the dynamic on the market.
During the analysis stage, feedback from the stakeholder groups would be compared to determine areas of agreement as well as areas of divergence