

Key Insights
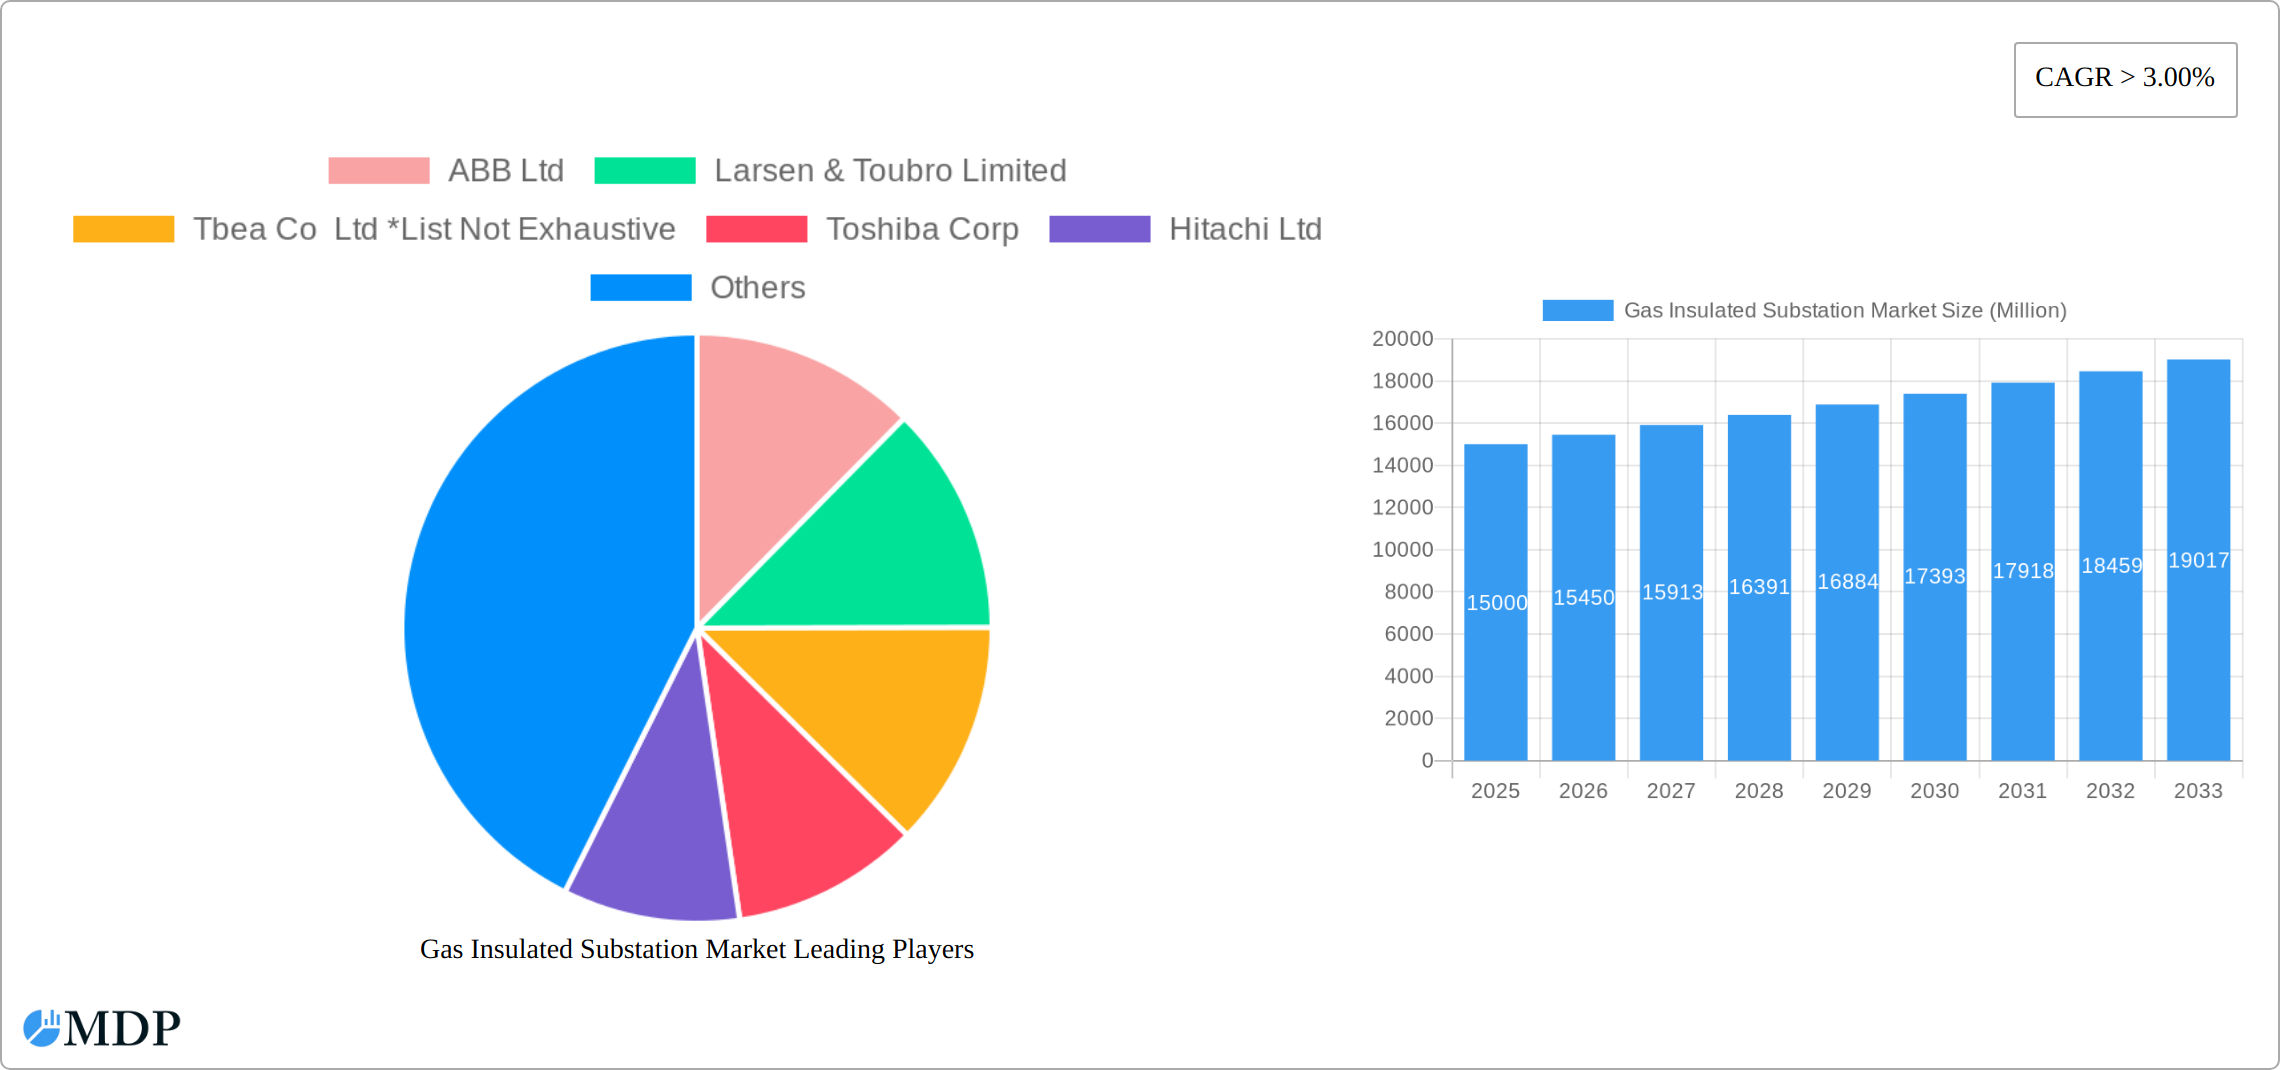
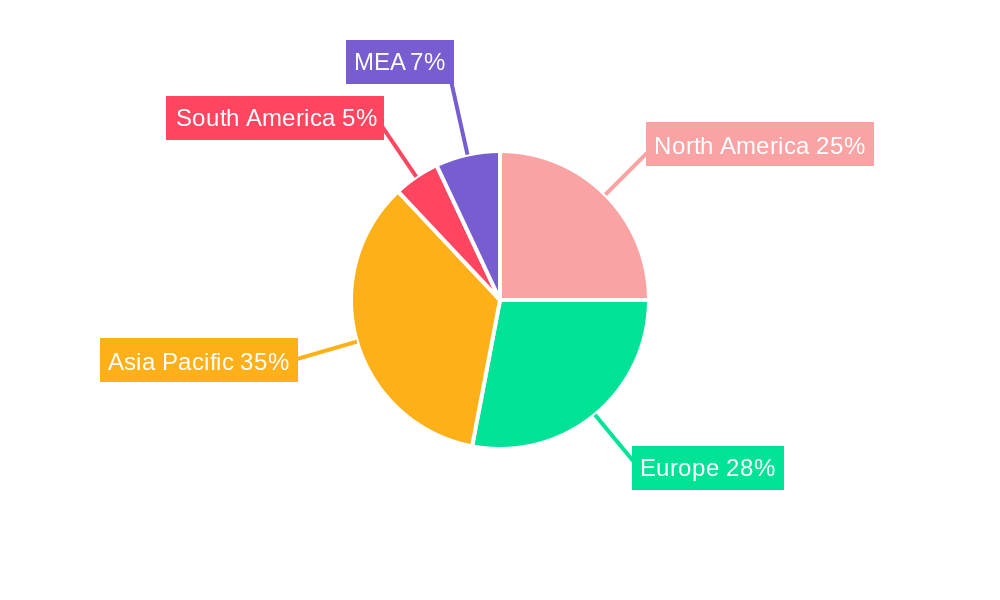
The Gas Insulated Substation (GIS) market is experiencing robust growth, driven by the increasing demand for reliable and efficient power transmission and distribution infrastructure. The market's compound annual growth rate (CAGR) exceeding 3.00% indicates a sustained expansion over the forecast period (2025-2033). Key drivers include the rising adoption of smart grids, the need for enhanced grid reliability in the face of extreme weather events, and the growing urbanization leading to increased power demand. Furthermore, the shift towards higher voltage applications (extra-high voltage) to minimize transmission losses and increase transmission capacity is significantly boosting market growth. Segment-wise, the high-voltage segment currently holds a dominant share, primarily due to its extensive use in power utility applications. However, the extra-high voltage segment is expected to witness the fastest growth, propelled by large-scale infrastructure projects globally. Geographically, North America and Europe represent mature markets with established grid infrastructure, while Asia-Pacific is projected to show significant growth, fueled by rapid industrialization and expanding power grids in countries like China and India. Restraints to market growth include the high initial investment costs associated with GIS installations and the specialized technical expertise required for their operation and maintenance. However, the long-term benefits of enhanced reliability and reduced maintenance costs are offsetting these challenges. Leading players such as ABB, Siemens, and Hitachi are strategically investing in research and development to improve GIS technology, further driving market expansion.
The competitive landscape is characterized by a mix of established multinational corporations and regional players. These companies are focusing on product innovation, strategic partnerships, and geographical expansion to gain a competitive edge. The market's future trajectory is likely to be influenced by government regulations promoting renewable energy integration and advancements in smart grid technologies. The increasing adoption of environmentally friendly SF6 alternatives in GIS also presents a notable market trend, addressing environmental concerns associated with traditional gas insulation. The long-term outlook for the GIS market remains positive, with consistent growth expected across different segments and geographical regions. This growth will be shaped by the interplay of technological advancements, regulatory policies, and the expanding global energy infrastructure needs.
Gas Insulated Substation Market: A Comprehensive Report (2019-2033)
This comprehensive report provides an in-depth analysis of the Gas Insulated Substation (GIS) market, offering invaluable insights for industry stakeholders, investors, and strategic decision-makers. The study covers the period from 2019 to 2033, with a focus on the forecast period of 2025-2033 and a base year of 2025. The market size is projected to reach xx Million by 2033, exhibiting a CAGR of xx% during the forecast period. This report features detailed analysis of market dynamics, leading players (including ABB Ltd, Larsen & Toubro Limited, TBEA Co Ltd, Toshiba Corp, Hitachi Ltd, Bharat Heavy Electricals Limited, Mitsubishi Electric Corporation, Siemens AG, Schneider Electric SE, Powell Industries Inc, Elsewedy Electric Co S.A.E, CG Power and Industrial Solutions Ltd, General Electric Company, and Hyosung Corp, List Not Exhaustive), key segments (Voltage: Medium Voltage, High Voltage, Extra High Voltage; End-User: Power Utilities, Industrial Sector, Commercial and Residential Sector), and emerging trends.
Gas Insulated Substation Market Market Dynamics & Concentration
The Gas Insulated Substation market is characterized by a moderately concentrated landscape, with a few major players holding significant market share. Market share data for 2024 indicates that ABB Ltd holds approximately xx%, followed by Siemens AG with xx% and Schneider Electric SE with xx%. However, the market is witnessing increased competition from emerging players, particularly in developing economies.
Innovation Drivers: The market is driven by continuous innovation in GIS technology, focusing on increased efficiency, compactness, and improved reliability. This includes the development of advanced SF6 alternatives and improved insulation materials.
Regulatory Frameworks: Stringent environmental regulations concerning SF6 emissions are significantly influencing market dynamics, pushing the adoption of eco-friendly alternatives. Furthermore, grid modernization initiatives and smart grid deployments are fueling demand for GIS solutions.
Product Substitutes: While traditional air-insulated substations remain in use, GIS technology offers significant advantages in terms of space saving, reduced maintenance, and improved reliability, making it a preferred choice for many applications.
End-User Trends: The power utilities sector continues to be the largest end-user segment, driven by the need for increased grid capacity and improved power transmission efficiency. The industrial sector is another significant market, with growing demand for reliable power supply in manufacturing facilities.
M&A Activities: The number of mergers and acquisitions in the GIS market has increased in recent years, with xx M&A deals recorded in 2024. These activities reflect the strategic efforts of companies to expand their market share and diversify their product portfolios.
Gas Insulated Substation Market Industry Trends & Analysis
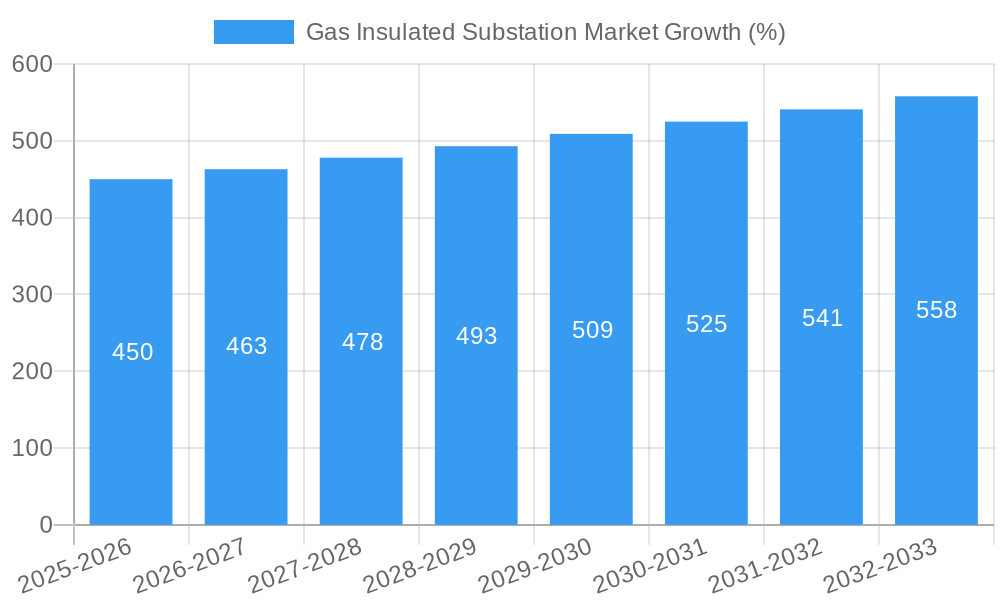
The Gas Insulated Substation market is experiencing robust growth, driven by several key factors. The increasing demand for reliable and efficient power transmission and distribution infrastructure, particularly in rapidly developing economies, is a major contributor. The global market size reached xx Million in 2024 and is projected to reach xx Million by 2033, representing a significant increase. This growth is further fueled by the ongoing investments in grid modernization and smart grid technologies across the globe. Technological advancements, such as the development of environmentally friendly SF6 alternatives, are also contributing to market expansion. The market penetration of GIS solutions is steadily increasing, with a significant uptake observed in urban areas and industrial hubs. The overall market exhibits a healthy CAGR of xx% during the forecast period (2025-2033). Competitive dynamics are characterized by both intense rivalry among established players and the emergence of new competitors offering innovative solutions. Consumer preferences are increasingly shifting towards sustainable and environmentally friendly GIS technologies.
Leading Markets & Segments in Gas Insulated Substation Market
The High Voltage segment holds the largest market share within the voltage categories, driven by extensive use in large-scale power transmission projects. The Power Utilities sector represents the dominant end-user segment, accounting for a significant portion of the overall market demand.
Key Drivers for High Voltage Segment:
- Increasing demand for long-distance power transmission.
- Growing investments in renewable energy projects.
- Expansion of electricity grids in developing countries.
Key Drivers for Power Utilities Segment:
- Government initiatives promoting grid modernization.
- Investments in smart grid technologies.
- Need for enhanced grid reliability and efficiency.
Detailed analysis reveals that the Asia-Pacific region dominates the global GIS market, driven by rapid economic growth, significant investments in infrastructure development, and increasing urbanization. Specific countries like China and India are major contributors to this regional dominance. Europe and North America also represent significant markets, albeit with slower growth rates compared to the Asia-Pacific region.
Gas Insulated Substation Market Product Developments
Recent product developments in the GIS market have focused on enhancing compactness, improving reliability, and incorporating environmentally friendly features. Manufacturers are actively developing SF6 alternatives, such as air or vacuum-based insulation systems, to meet increasingly stringent environmental regulations. The integration of smart sensors and digital technologies is also gaining traction, enabling real-time monitoring and predictive maintenance capabilities. These innovations are improving the overall efficiency and reducing the lifecycle costs of GIS systems, enhancing their market appeal.
Key Drivers of Gas Insulated Substation Market Growth
Several factors contribute to the growth of the Gas Insulated Substation market. Technological advancements, particularly the development of more efficient and environmentally friendly GIS systems, are a major driver. The increasing need for reliable and efficient power transmission and distribution is another crucial factor, as is the growing demand for electricity in both developed and developing countries. Furthermore, supportive government policies and regulations promoting grid modernization and renewable energy integration are also playing a significant role.
Challenges in the Gas Insulated Substation Market Market
The Gas Insulated Substation market faces several challenges. The high initial investment cost of GIS systems can be a barrier to adoption, especially in regions with limited budgets. Furthermore, supply chain disruptions and the availability of raw materials can impact production and delivery timelines. Intense competition among established players also poses a challenge for companies seeking to enter or expand their presence in the market. The environmental impact of SF6 gas continues to be a concern, requiring manufacturers to develop and adopt alternative solutions.
Emerging Opportunities in Gas Insulated Substation Market
The Gas Insulated Substation market presents several exciting opportunities for future growth. The increasing adoption of renewable energy sources and the ongoing electrification of various sectors create significant demand for reliable and efficient power transmission and distribution solutions. The development of advanced GIS technologies, such as compact designs and eco-friendly alternatives to SF6 gas, is creating new avenues for market expansion. Strategic partnerships and collaborations between manufacturers and utilities are also expected to fuel growth. Moreover, expanding into developing economies with rapidly growing power demands presents substantial opportunities for market players.
Leading Players in the Gas Insulated Substation Market Sector
- ABB Ltd
- Larsen & Toubro Limited
- TBEA Co Ltd
- Toshiba Corp
- Hitachi Ltd
- Bharat Heavy Electricals Limited
- Mitsubishi Electric Corporation
- Siemens AG
- Schneider Electric SE
- Powell Industries Inc
- Elsewedy Electric Co S.A.E
- CG Power and Industrial Solutions Ltd
- General Electric Company
- Hyosung Corp
Key Milestones in Gas Insulated Substation Market Industry
- 2020: ABB Ltd launches a new generation of eco-friendly GIS systems.
- 2021: Siemens AG acquires a smaller GIS manufacturer, expanding its market presence.
- 2022: Significant investments in R&D for SF6 alternative technologies are announced across the industry.
- 2023: Several large-scale GIS projects are commissioned in Asia-Pacific, driving market growth.
- 2024: New regulatory standards concerning SF6 emissions are implemented in several countries.
Strategic Outlook for Gas Insulated Substation Market Market
The Gas Insulated Substation market is poised for sustained growth, driven by several factors. The increasing demand for reliable and efficient power transmission infrastructure, the growing adoption of renewable energy technologies, and the ongoing investments in grid modernization will continue to drive market expansion. Strategic partnerships, technological innovation, and the development of environmentally friendly solutions will further fuel market growth. The focus on sustainable and cost-effective solutions will be crucial for success in this dynamic market.
Gas Insulated Substation Market Segmentation
-
1. Voltage
- 1.1. Medium Voltage
- 1.2. High Voltage
- 1.3. Extra High Voltage
-
2. End-User
- 2.1. Power Utilities
- 2.2. Industrial Sector
- 2.3. Commercial and Residential Sector
Gas Insulated Substation Market Segmentation By Geography
- 1. North America
- 2. Europe
- 3. Asia Pacific
- 4. South America
- 5. Middle East and Africa
Gas Insulated Substation Market REPORT HIGHLIGHTS
| Aspects | Details |
|---|---|
| Study Period | 2019-2033 |
| Base Year | 2024 |
| Estimated Year | 2025 |
| Forecast Period | 2025-2033 |
| Historical Period | 2019-2024 |
| Growth Rate | CAGR of > 3.00% from 2019-2033 |
| Segmentation |
|
Table of Contents
- 1. Introduction
- 1.1. Research Scope
- 1.2. Market Segmentation
- 1.3. Research Methodology
- 1.4. Definitions and Assumptions
- 2. Executive Summary
- 2.1. Introduction
- 3. Market Dynamics
- 3.1. Introduction
- 3.2. Market Drivers
- 3.2.1. Supportive Government Policies and Incentives4.; Environmental Concerns
- 3.3. Market Restrains
- 3.3.1. Fossil Fuel Subsidies
- 3.4. Market Trends
- 3.4.1. Power Utilities Sector to Dominate the Market
- 4. Market Factor Analysis
- 4.1. Porters Five Forces
- 4.2. Supply/Value Chain
- 4.3. PESTEL analysis
- 4.4. Market Entropy
- 4.5. Patent/Trademark Analysis
- 5. Global Gas Insulated Substation Market Analysis, Insights and Forecast, 2019-2031
- 5.1. Market Analysis, Insights and Forecast - by Voltage
- 5.1.1. Medium Voltage
- 5.1.2. High Voltage
- 5.1.3. Extra High Voltage
- 5.2. Market Analysis, Insights and Forecast - by End-User
- 5.2.1. Power Utilities
- 5.2.2. Industrial Sector
- 5.2.3. Commercial and Residential Sector
- 5.3. Market Analysis, Insights and Forecast - by Region
- 5.3.1. North America
- 5.3.2. Europe
- 5.3.3. Asia Pacific
- 5.3.4. South America
- 5.3.5. Middle East and Africa
- 5.1. Market Analysis, Insights and Forecast - by Voltage
- 6. North America Gas Insulated Substation Market Analysis, Insights and Forecast, 2019-2031
- 6.1. Market Analysis, Insights and Forecast - by Voltage
- 6.1.1. Medium Voltage
- 6.1.2. High Voltage
- 6.1.3. Extra High Voltage
- 6.2. Market Analysis, Insights and Forecast - by End-User
- 6.2.1. Power Utilities
- 6.2.2. Industrial Sector
- 6.2.3. Commercial and Residential Sector
- 6.1. Market Analysis, Insights and Forecast - by Voltage
- 7. Europe Gas Insulated Substation Market Analysis, Insights and Forecast, 2019-2031
- 7.1. Market Analysis, Insights and Forecast - by Voltage
- 7.1.1. Medium Voltage
- 7.1.2. High Voltage
- 7.1.3. Extra High Voltage
- 7.2. Market Analysis, Insights and Forecast - by End-User
- 7.2.1. Power Utilities
- 7.2.2. Industrial Sector
- 7.2.3. Commercial and Residential Sector
- 7.1. Market Analysis, Insights and Forecast - by Voltage
- 8. Asia Pacific Gas Insulated Substation Market Analysis, Insights and Forecast, 2019-2031
- 8.1. Market Analysis, Insights and Forecast - by Voltage
- 8.1.1. Medium Voltage
- 8.1.2. High Voltage
- 8.1.3. Extra High Voltage
- 8.2. Market Analysis, Insights and Forecast - by End-User
- 8.2.1. Power Utilities
- 8.2.2. Industrial Sector
- 8.2.3. Commercial and Residential Sector
- 8.1. Market Analysis, Insights and Forecast - by Voltage
- 9. South America Gas Insulated Substation Market Analysis, Insights and Forecast, 2019-2031
- 9.1. Market Analysis, Insights and Forecast - by Voltage
- 9.1.1. Medium Voltage
- 9.1.2. High Voltage
- 9.1.3. Extra High Voltage
- 9.2. Market Analysis, Insights and Forecast - by End-User
- 9.2.1. Power Utilities
- 9.2.2. Industrial Sector
- 9.2.3. Commercial and Residential Sector
- 9.1. Market Analysis, Insights and Forecast - by Voltage
- 10. Middle East and Africa Gas Insulated Substation Market Analysis, Insights and Forecast, 2019-2031
- 10.1. Market Analysis, Insights and Forecast - by Voltage
- 10.1.1. Medium Voltage
- 10.1.2. High Voltage
- 10.1.3. Extra High Voltage
- 10.2. Market Analysis, Insights and Forecast - by End-User
- 10.2.1. Power Utilities
- 10.2.2. Industrial Sector
- 10.2.3. Commercial and Residential Sector
- 10.1. Market Analysis, Insights and Forecast - by Voltage
- 11. North America Gas Insulated Substation Market Analysis, Insights and Forecast, 2019-2031
- 11.1. Market Analysis, Insights and Forecast - By Country/Sub-region
- 11.1.1 United States
- 11.1.2 Canada
- 11.1.3 Mexico
- 12. Europe Gas Insulated Substation Market Analysis, Insights and Forecast, 2019-2031
- 12.1. Market Analysis, Insights and Forecast - By Country/Sub-region
- 12.1.1 Germany
- 12.1.2 United Kingdom
- 12.1.3 France
- 12.1.4 Spain
- 12.1.5 Italy
- 12.1.6 Spain
- 12.1.7 Belgium
- 12.1.8 Netherland
- 12.1.9 Nordics
- 12.1.10 Rest of Europe
- 13. Asia Pacific Gas Insulated Substation Market Analysis, Insights and Forecast, 2019-2031
- 13.1. Market Analysis, Insights and Forecast - By Country/Sub-region
- 13.1.1 China
- 13.1.2 Japan
- 13.1.3 India
- 13.1.4 South Korea
- 13.1.5 Southeast Asia
- 13.1.6 Australia
- 13.1.7 Indonesia
- 13.1.8 Phillipes
- 13.1.9 Singapore
- 13.1.10 Thailandc
- 13.1.11 Rest of Asia Pacific
- 14. South America Gas Insulated Substation Market Analysis, Insights and Forecast, 2019-2031
- 14.1. Market Analysis, Insights and Forecast - By Country/Sub-region
- 14.1.1 Brazil
- 14.1.2 Argentina
- 14.1.3 Peru
- 14.1.4 Chile
- 14.1.5 Colombia
- 14.1.6 Ecuador
- 14.1.7 Venezuela
- 14.1.8 Rest of South America
- 15. MEA Gas Insulated Substation Market Analysis, Insights and Forecast, 2019-2031
- 15.1. Market Analysis, Insights and Forecast - By Country/Sub-region
- 15.1.1 United Arab Emirates
- 15.1.2 Saudi Arabia
- 15.1.3 South Africa
- 15.1.4 Rest of Middle East and Africa
- 16. Competitive Analysis
- 16.1. Global Market Share Analysis 2024
- 16.2. Company Profiles
- 16.2.1 ABB Ltd
- 16.2.1.1. Overview
- 16.2.1.2. Products
- 16.2.1.3. SWOT Analysis
- 16.2.1.4. Recent Developments
- 16.2.1.5. Financials (Based on Availability)
- 16.2.2 Larsen & Toubro Limited
- 16.2.2.1. Overview
- 16.2.2.2. Products
- 16.2.2.3. SWOT Analysis
- 16.2.2.4. Recent Developments
- 16.2.2.5. Financials (Based on Availability)
- 16.2.3 Tbea Co Ltd *List Not Exhaustive
- 16.2.3.1. Overview
- 16.2.3.2. Products
- 16.2.3.3. SWOT Analysis
- 16.2.3.4. Recent Developments
- 16.2.3.5. Financials (Based on Availability)
- 16.2.4 Toshiba Corp
- 16.2.4.1. Overview
- 16.2.4.2. Products
- 16.2.4.3. SWOT Analysis
- 16.2.4.4. Recent Developments
- 16.2.4.5. Financials (Based on Availability)
- 16.2.5 Hitachi Ltd
- 16.2.5.1. Overview
- 16.2.5.2. Products
- 16.2.5.3. SWOT Analysis
- 16.2.5.4. Recent Developments
- 16.2.5.5. Financials (Based on Availability)
- 16.2.6 Bharat Heavy Electricals Limited
- 16.2.6.1. Overview
- 16.2.6.2. Products
- 16.2.6.3. SWOT Analysis
- 16.2.6.4. Recent Developments
- 16.2.6.5. Financials (Based on Availability)
- 16.2.7 Mitsubishi Electric Corporation
- 16.2.7.1. Overview
- 16.2.7.2. Products
- 16.2.7.3. SWOT Analysis
- 16.2.7.4. Recent Developments
- 16.2.7.5. Financials (Based on Availability)
- 16.2.8 Siemens AG
- 16.2.8.1. Overview
- 16.2.8.2. Products
- 16.2.8.3. SWOT Analysis
- 16.2.8.4. Recent Developments
- 16.2.8.5. Financials (Based on Availability)
- 16.2.9 Schneider Electric SE
- 16.2.9.1. Overview
- 16.2.9.2. Products
- 16.2.9.3. SWOT Analysis
- 16.2.9.4. Recent Developments
- 16.2.9.5. Financials (Based on Availability)
- 16.2.10 Powell Industries Inc
- 16.2.10.1. Overview
- 16.2.10.2. Products
- 16.2.10.3. SWOT Analysis
- 16.2.10.4. Recent Developments
- 16.2.10.5. Financials (Based on Availability)
- 16.2.11 Elsewedy Electric Co S A E
- 16.2.11.1. Overview
- 16.2.11.2. Products
- 16.2.11.3. SWOT Analysis
- 16.2.11.4. Recent Developments
- 16.2.11.5. Financials (Based on Availability)
- 16.2.12 CG Power and Industrial Solutions Ltd
- 16.2.12.1. Overview
- 16.2.12.2. Products
- 16.2.12.3. SWOT Analysis
- 16.2.12.4. Recent Developments
- 16.2.12.5. Financials (Based on Availability)
- 16.2.13 General Electric Company
- 16.2.13.1. Overview
- 16.2.13.2. Products
- 16.2.13.3. SWOT Analysis
- 16.2.13.4. Recent Developments
- 16.2.13.5. Financials (Based on Availability)
- 16.2.14 Hyosung Corp
- 16.2.14.1. Overview
- 16.2.14.2. Products
- 16.2.14.3. SWOT Analysis
- 16.2.14.4. Recent Developments
- 16.2.14.5. Financials (Based on Availability)
- 16.2.1 ABB Ltd
List of Figures
- Figure 1: Global Gas Insulated Substation Market Revenue Breakdown (Million, %) by Region 2024 & 2032
- Figure 2: North America Gas Insulated Substation Market Revenue (Million), by Country 2024 & 2032
- Figure 3: North America Gas Insulated Substation Market Revenue Share (%), by Country 2024 & 2032
- Figure 4: Europe Gas Insulated Substation Market Revenue (Million), by Country 2024 & 2032
- Figure 5: Europe Gas Insulated Substation Market Revenue Share (%), by Country 2024 & 2032
- Figure 6: Asia Pacific Gas Insulated Substation Market Revenue (Million), by Country 2024 & 2032
- Figure 7: Asia Pacific Gas Insulated Substation Market Revenue Share (%), by Country 2024 & 2032
- Figure 8: South America Gas Insulated Substation Market Revenue (Million), by Country 2024 & 2032
- Figure 9: South America Gas Insulated Substation Market Revenue Share (%), by Country 2024 & 2032
- Figure 10: MEA Gas Insulated Substation Market Revenue (Million), by Country 2024 & 2032
- Figure 11: MEA Gas Insulated Substation Market Revenue Share (%), by Country 2024 & 2032
- Figure 12: North America Gas Insulated Substation Market Revenue (Million), by Voltage 2024 & 2032
- Figure 13: North America Gas Insulated Substation Market Revenue Share (%), by Voltage 2024 & 2032
- Figure 14: North America Gas Insulated Substation Market Revenue (Million), by End-User 2024 & 2032
- Figure 15: North America Gas Insulated Substation Market Revenue Share (%), by End-User 2024 & 2032
- Figure 16: North America Gas Insulated Substation Market Revenue (Million), by Country 2024 & 2032
- Figure 17: North America Gas Insulated Substation Market Revenue Share (%), by Country 2024 & 2032
- Figure 18: Europe Gas Insulated Substation Market Revenue (Million), by Voltage 2024 & 2032
- Figure 19: Europe Gas Insulated Substation Market Revenue Share (%), by Voltage 2024 & 2032
- Figure 20: Europe Gas Insulated Substation Market Revenue (Million), by End-User 2024 & 2032
- Figure 21: Europe Gas Insulated Substation Market Revenue Share (%), by End-User 2024 & 2032
- Figure 22: Europe Gas Insulated Substation Market Revenue (Million), by Country 2024 & 2032
- Figure 23: Europe Gas Insulated Substation Market Revenue Share (%), by Country 2024 & 2032
- Figure 24: Asia Pacific Gas Insulated Substation Market Revenue (Million), by Voltage 2024 & 2032
- Figure 25: Asia Pacific Gas Insulated Substation Market Revenue Share (%), by Voltage 2024 & 2032
- Figure 26: Asia Pacific Gas Insulated Substation Market Revenue (Million), by End-User 2024 & 2032
- Figure 27: Asia Pacific Gas Insulated Substation Market Revenue Share (%), by End-User 2024 & 2032
- Figure 28: Asia Pacific Gas Insulated Substation Market Revenue (Million), by Country 2024 & 2032
- Figure 29: Asia Pacific Gas Insulated Substation Market Revenue Share (%), by Country 2024 & 2032
- Figure 30: South America Gas Insulated Substation Market Revenue (Million), by Voltage 2024 & 2032
- Figure 31: South America Gas Insulated Substation Market Revenue Share (%), by Voltage 2024 & 2032
- Figure 32: South America Gas Insulated Substation Market Revenue (Million), by End-User 2024 & 2032
- Figure 33: South America Gas Insulated Substation Market Revenue Share (%), by End-User 2024 & 2032
- Figure 34: South America Gas Insulated Substation Market Revenue (Million), by Country 2024 & 2032
- Figure 35: South America Gas Insulated Substation Market Revenue Share (%), by Country 2024 & 2032
- Figure 36: Middle East and Africa Gas Insulated Substation Market Revenue (Million), by Voltage 2024 & 2032
- Figure 37: Middle East and Africa Gas Insulated Substation Market Revenue Share (%), by Voltage 2024 & 2032
- Figure 38: Middle East and Africa Gas Insulated Substation Market Revenue (Million), by End-User 2024 & 2032
- Figure 39: Middle East and Africa Gas Insulated Substation Market Revenue Share (%), by End-User 2024 & 2032
- Figure 40: Middle East and Africa Gas Insulated Substation Market Revenue (Million), by Country 2024 & 2032
- Figure 41: Middle East and Africa Gas Insulated Substation Market Revenue Share (%), by Country 2024 & 2032
List of Tables
- Table 1: Global Gas Insulated Substation Market Revenue Million Forecast, by Region 2019 & 2032
- Table 2: Global Gas Insulated Substation Market Revenue Million Forecast, by Voltage 2019 & 2032
- Table 3: Global Gas Insulated Substation Market Revenue Million Forecast, by End-User 2019 & 2032
- Table 4: Global Gas Insulated Substation Market Revenue Million Forecast, by Region 2019 & 2032
- Table 5: Global Gas Insulated Substation Market Revenue Million Forecast, by Country 2019 & 2032
- Table 6: United States Gas Insulated Substation Market Revenue (Million) Forecast, by Application 2019 & 2032
- Table 7: Canada Gas Insulated Substation Market Revenue (Million) Forecast, by Application 2019 & 2032
- Table 8: Mexico Gas Insulated Substation Market Revenue (Million) Forecast, by Application 2019 & 2032
- Table 9: Global Gas Insulated Substation Market Revenue Million Forecast, by Country 2019 & 2032
- Table 10: Germany Gas Insulated Substation Market Revenue (Million) Forecast, by Application 2019 & 2032
- Table 11: United Kingdom Gas Insulated Substation Market Revenue (Million) Forecast, by Application 2019 & 2032
- Table 12: France Gas Insulated Substation Market Revenue (Million) Forecast, by Application 2019 & 2032
- Table 13: Spain Gas Insulated Substation Market Revenue (Million) Forecast, by Application 2019 & 2032
- Table 14: Italy Gas Insulated Substation Market Revenue (Million) Forecast, by Application 2019 & 2032
- Table 15: Spain Gas Insulated Substation Market Revenue (Million) Forecast, by Application 2019 & 2032
- Table 16: Belgium Gas Insulated Substation Market Revenue (Million) Forecast, by Application 2019 & 2032
- Table 17: Netherland Gas Insulated Substation Market Revenue (Million) Forecast, by Application 2019 & 2032
- Table 18: Nordics Gas Insulated Substation Market Revenue (Million) Forecast, by Application 2019 & 2032
- Table 19: Rest of Europe Gas Insulated Substation Market Revenue (Million) Forecast, by Application 2019 & 2032
- Table 20: Global Gas Insulated Substation Market Revenue Million Forecast, by Country 2019 & 2032
- Table 21: China Gas Insulated Substation Market Revenue (Million) Forecast, by Application 2019 & 2032
- Table 22: Japan Gas Insulated Substation Market Revenue (Million) Forecast, by Application 2019 & 2032
- Table 23: India Gas Insulated Substation Market Revenue (Million) Forecast, by Application 2019 & 2032
- Table 24: South Korea Gas Insulated Substation Market Revenue (Million) Forecast, by Application 2019 & 2032
- Table 25: Southeast Asia Gas Insulated Substation Market Revenue (Million) Forecast, by Application 2019 & 2032
- Table 26: Australia Gas Insulated Substation Market Revenue (Million) Forecast, by Application 2019 & 2032
- Table 27: Indonesia Gas Insulated Substation Market Revenue (Million) Forecast, by Application 2019 & 2032
- Table 28: Phillipes Gas Insulated Substation Market Revenue (Million) Forecast, by Application 2019 & 2032
- Table 29: Singapore Gas Insulated Substation Market Revenue (Million) Forecast, by Application 2019 & 2032
- Table 30: Thailandc Gas Insulated Substation Market Revenue (Million) Forecast, by Application 2019 & 2032
- Table 31: Rest of Asia Pacific Gas Insulated Substation Market Revenue (Million) Forecast, by Application 2019 & 2032
- Table 32: Global Gas Insulated Substation Market Revenue Million Forecast, by Country 2019 & 2032
- Table 33: Brazil Gas Insulated Substation Market Revenue (Million) Forecast, by Application 2019 & 2032
- Table 34: Argentina Gas Insulated Substation Market Revenue (Million) Forecast, by Application 2019 & 2032
- Table 35: Peru Gas Insulated Substation Market Revenue (Million) Forecast, by Application 2019 & 2032
- Table 36: Chile Gas Insulated Substation Market Revenue (Million) Forecast, by Application 2019 & 2032
- Table 37: Colombia Gas Insulated Substation Market Revenue (Million) Forecast, by Application 2019 & 2032
- Table 38: Ecuador Gas Insulated Substation Market Revenue (Million) Forecast, by Application 2019 & 2032
- Table 39: Venezuela Gas Insulated Substation Market Revenue (Million) Forecast, by Application 2019 & 2032
- Table 40: Rest of South America Gas Insulated Substation Market Revenue (Million) Forecast, by Application 2019 & 2032
- Table 41: Global Gas Insulated Substation Market Revenue Million Forecast, by Country 2019 & 2032
- Table 42: United Arab Emirates Gas Insulated Substation Market Revenue (Million) Forecast, by Application 2019 & 2032
- Table 43: Saudi Arabia Gas Insulated Substation Market Revenue (Million) Forecast, by Application 2019 & 2032
- Table 44: South Africa Gas Insulated Substation Market Revenue (Million) Forecast, by Application 2019 & 2032
- Table 45: Rest of Middle East and Africa Gas Insulated Substation Market Revenue (Million) Forecast, by Application 2019 & 2032
- Table 46: Global Gas Insulated Substation Market Revenue Million Forecast, by Voltage 2019 & 2032
- Table 47: Global Gas Insulated Substation Market Revenue Million Forecast, by End-User 2019 & 2032
- Table 48: Global Gas Insulated Substation Market Revenue Million Forecast, by Country 2019 & 2032
- Table 49: Global Gas Insulated Substation Market Revenue Million Forecast, by Voltage 2019 & 2032
- Table 50: Global Gas Insulated Substation Market Revenue Million Forecast, by End-User 2019 & 2032
- Table 51: Global Gas Insulated Substation Market Revenue Million Forecast, by Country 2019 & 2032
- Table 52: Global Gas Insulated Substation Market Revenue Million Forecast, by Voltage 2019 & 2032
- Table 53: Global Gas Insulated Substation Market Revenue Million Forecast, by End-User 2019 & 2032
- Table 54: Global Gas Insulated Substation Market Revenue Million Forecast, by Country 2019 & 2032
- Table 55: Global Gas Insulated Substation Market Revenue Million Forecast, by Voltage 2019 & 2032
- Table 56: Global Gas Insulated Substation Market Revenue Million Forecast, by End-User 2019 & 2032
- Table 57: Global Gas Insulated Substation Market Revenue Million Forecast, by Country 2019 & 2032
- Table 58: Global Gas Insulated Substation Market Revenue Million Forecast, by Voltage 2019 & 2032
- Table 59: Global Gas Insulated Substation Market Revenue Million Forecast, by End-User 2019 & 2032
- Table 60: Global Gas Insulated Substation Market Revenue Million Forecast, by Country 2019 & 2032
Frequently Asked Questions
1. What is the projected Compound Annual Growth Rate (CAGR) of the Gas Insulated Substation Market?
The projected CAGR is approximately > 3.00%.
2. Which companies are prominent players in the Gas Insulated Substation Market?
Key companies in the market include ABB Ltd, Larsen & Toubro Limited, Tbea Co Ltd *List Not Exhaustive, Toshiba Corp, Hitachi Ltd, Bharat Heavy Electricals Limited, Mitsubishi Electric Corporation, Siemens AG, Schneider Electric SE, Powell Industries Inc, Elsewedy Electric Co S A E, CG Power and Industrial Solutions Ltd, General Electric Company, Hyosung Corp.
3. What are the main segments of the Gas Insulated Substation Market?
The market segments include Voltage, End-User.
4. Can you provide details about the market size?
The market size is estimated to be USD XX Million as of 2022.
5. What are some drivers contributing to market growth?
Supportive Government Policies and Incentives4.; Environmental Concerns.
6. What are the notable trends driving market growth?
Power Utilities Sector to Dominate the Market.
7. Are there any restraints impacting market growth?
Fossil Fuel Subsidies.
8. Can you provide examples of recent developments in the market?
N/A
9. What pricing options are available for accessing the report?
Pricing options include single-user, multi-user, and enterprise licenses priced at USD 4750, USD 5250, and USD 8750 respectively.
10. Is the market size provided in terms of value or volume?
The market size is provided in terms of value, measured in Million.
11. Are there any specific market keywords associated with the report?
Yes, the market keyword associated with the report is "Gas Insulated Substation Market," which aids in identifying and referencing the specific market segment covered.
12. How do I determine which pricing option suits my needs best?
The pricing options vary based on user requirements and access needs. Individual users may opt for single-user licenses, while businesses requiring broader access may choose multi-user or enterprise licenses for cost-effective access to the report.
13. Are there any additional resources or data provided in the Gas Insulated Substation Market report?
While the report offers comprehensive insights, it's advisable to review the specific contents or supplementary materials provided to ascertain if additional resources or data are available.
14. How can I stay updated on further developments or reports in the Gas Insulated Substation Market?
To stay informed about further developments, trends, and reports in the Gas Insulated Substation Market, consider subscribing to industry newsletters, following relevant companies and organizations, or regularly checking reputable industry news sources and publications.
Methodology
Step 1 - Identification of Relevant Samples Size from Population Database


Step 2 - Approaches for Defining Global Market Size (Value, Volume* & Price*)

Note*: In applicable scenarios
Step 3 - Data Sources
Primary Research
- Web Analytics
- Survey Reports
- Research Institute
- Latest Research Reports
- Opinion Leaders
Secondary Research
- Annual Reports
- White Paper
- Latest Press Release
- Industry Association
- Paid Database
- Investor Presentations

Step 4 - Data Triangulation
Involves using different sources of information in order to increase the validity of a study
These sources are likely to be stakeholders in a program - participants, other researchers, program staff, other community members, and so on.
Then we put all data in single framework & apply various statistical tools to find out the dynamic on the market.
During the analysis stage, feedback from the stakeholder groups would be compared to determine areas of agreement as well as areas of divergence
