

Key Insights
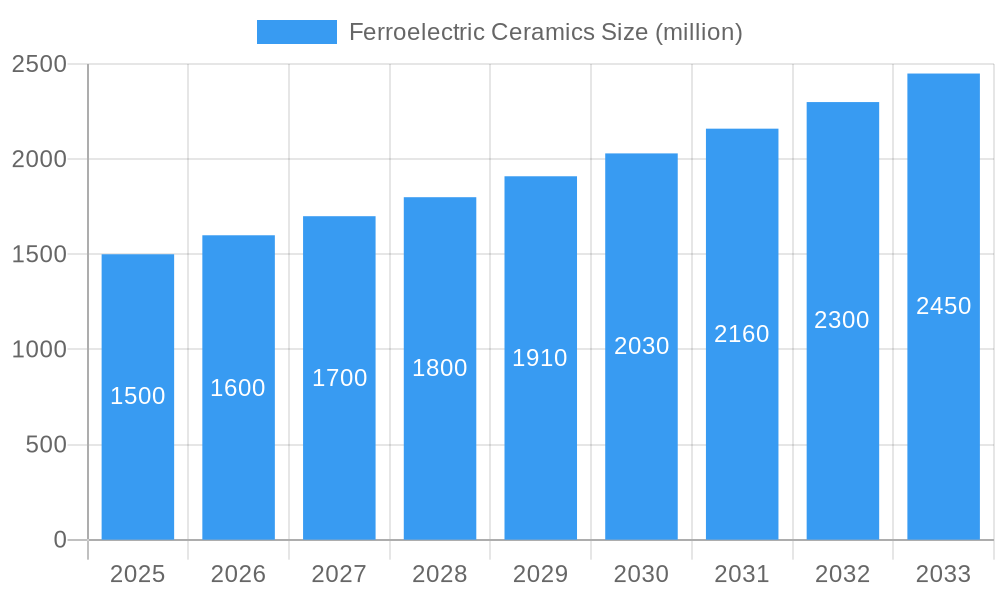
The global Ferroelectric Ceramics market is poised for significant expansion, projected to reach a substantial market size of approximately $1,500 million by 2025. This growth is underpinned by a robust Compound Annual Growth Rate (CAGR) of around 6.5% anticipated over the forecast period extending to 2033. The increasing demand for advanced electronic components, particularly in consumer electronics, telecommunications, and the Internet of Things (IoT) devices, serves as a primary driver. Furthermore, the automotive sector's adoption of ferroelectric ceramics for sensors, actuators, and memory applications, driven by the rise of electric vehicles (EVs) and autonomous driving technologies, is also a key contributor. Aerospace applications, leveraging the unique piezoelectric and dielectric properties of these ceramics for advanced systems, further bolster market prospects. The market's trajectory is further supported by ongoing research and development in novel ferroelectric materials and enhanced manufacturing processes, paving the way for improved performance and wider adoption across various industries.
Ferroelectric Ceramics Market Size (In Billion)
The market is segmented into distinct applications, with Electronics holding the largest share due to its widespread use in capacitors, sensors, and memory devices. The Automotive segment is experiencing rapid growth, fueled by the electrification and automation trends. In terms of product types, Solid Ferroelectric Ceramics are dominant, offering superior performance and durability in demanding applications. However, Powder Ferroelectric Ceramics are gaining traction for specialized applications and in emerging markets. Geographically, Asia Pacific, led by China and Japan, is expected to be the largest and fastest-growing regional market, owing to its strong manufacturing base and burgeoning consumer electronics industry. North America and Europe also represent significant markets, driven by technological advancements and a strong presence of key industry players like Citizen, PI Ceramic, and Kojundo Chemical. Restraints such as the high cost of raw materials and complex manufacturing processes are being addressed through innovation and economies of scale, indicating a positive outlook for sustained market growth.
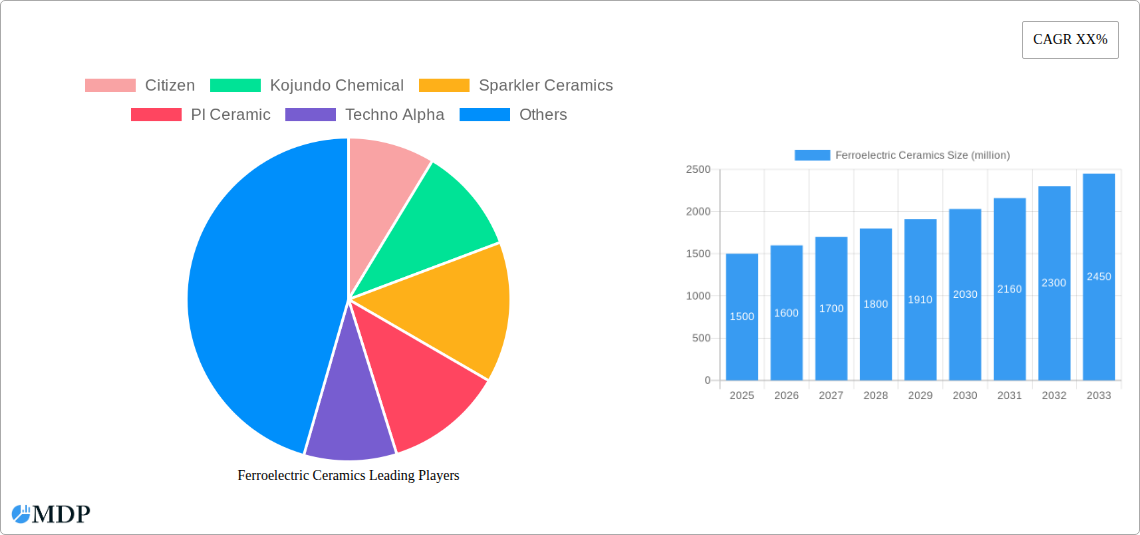
Ferroelectric Ceramics Company Market Share
Ferroelectric Ceramics Market: Comprehensive Analysis, Trends, and Future Outlook (2019-2033)
This in-depth report provides a thorough analysis of the global Ferroelectric Ceramics market, offering invaluable insights for industry stakeholders. Covering the study period of 2019–2033, with a base year of 2025 and a forecast period from 2025–2033, this report details historical trends, current market dynamics, and future projections. With a market size estimated to reach hundreds of millions, this research delves into the key drivers, challenges, opportunities, and leading players shaping the ferroelectric ceramics industry. Essential for strategic planning, investment decisions, and competitive intelligence, this report focuses on critical applications including Electronics, Automotive, and Aerospace, and analyzes the market for both Solid Ferroelectric Ceramics and Powder Ferroelectric Ceramics.
Ferroelectric Ceramics Market Dynamics & Concentration
The ferroelectric ceramics market exhibits a moderate concentration, with a few key players dominating a significant portion of the market share. Innovation is a primary driver, fueled by the demand for advanced materials in high-performance electronics and next-generation automotive components. Regulatory frameworks, while evolving, generally support the development of these advanced materials, particularly in safety-critical applications. Product substitutes, such as advanced polymers and other dielectric materials, pose a competitive threat, but ferroelectric ceramics retain a distinct advantage in specific high-temperature and high-frequency applications. End-user trends are strongly influenced by miniaturization in electronics and the increasing electrification of vehicles. Mergers and acquisitions (M&A) activities are moderate, indicating a focus on organic growth and technological advancement by established companies. For instance, recent M&A deals have been valued in the tens of millions, indicating strategic consolidation or niche technology acquisition.
Ferroelectric Ceramics Industry Trends & Analysis
The ferroelectric ceramics industry is poised for substantial growth, driven by an accelerating demand for high-performance materials across diverse sectors. The global market size is projected to reach several hundred million by the end of the forecast period. A key market growth driver is the escalating adoption of ferroelectric ceramics in advanced electronic components, including multilayer ceramic capacitors (MLCCs), sensors, and memory devices. The burgeoning electric vehicle (EV) market is another significant catalyst, where ferroelectric materials are increasingly utilized in power electronics for their superior dielectric properties and thermal stability. The integration of ferroelectric ceramics in aerospace applications, such as high-frequency communication systems and advanced sensors, further bolsters market expansion.
Technological disruptions are continuously reshaping the landscape. Advancements in material synthesis, particularly in nanoscale engineering and composite formulations, are enabling enhanced piezoelectric, pyroelectric, and ferroelectric properties. These improvements translate into smaller, more efficient, and more robust components. Consumer preferences are increasingly leaning towards compact, energy-efficient, and durable electronic devices, a trend that ferroelectric ceramics are well-positioned to capitalize on. The competitive dynamics within the industry are characterized by a mix of established global manufacturers and specialized regional players. Companies are investing heavily in research and development to create novel ferroelectric compositions and manufacturing processes, aiming to achieve higher energy densities, improved reliability, and cost-effectiveness. The Compound Annual Growth Rate (CAGR) is projected to be robust, estimated between 7% and 9% over the forecast period, reflecting the strong underlying demand and technological innovation. Market penetration is expected to deepen across existing applications and expand into new emerging sectors.
Leading Markets & Segments in Ferroelectric Ceramics
The Electronics segment is undeniably the dominant force within the ferroelectric ceramics market, driven by an insatiable demand for miniaturized, high-performance components. The sheer volume of electronic devices manufactured globally, from smartphones and laptops to advanced computing systems and telecommunications infrastructure, creates a consistent and escalating need for ferroelectric materials. Within this segment, Multilayer Ceramic Capacitors (MLCCs) represent a substantial share, critical for filtering, decoupling, and energy storage in virtually all electronic circuits.
- Electronics Application Dominance:
- Consumer Electronics: The pervasive use of ferroelectric ceramics in smartphones, tablets, wearables, and home appliances, where miniaturization and high reliability are paramount.
- Telecommunications: Essential for high-frequency circuits, base stations, and networking equipment, demanding stable dielectric properties under varying conditions.
- Computing: Found in motherboards, graphics cards, and data storage devices, contributing to efficient power management and signal integrity.
- Industrial Electronics: Used in power supplies, control systems, and automation, requiring robust performance and longevity.
The Automotive sector is rapidly emerging as a significant growth engine. The electrification of vehicles, coupled with the increasing integration of advanced driver-assistance systems (ADAS), infotainment, and electric powertrains, necessitates advanced materials like ferroelectric ceramics. Their ability to withstand high temperatures and voltage fluctuations makes them ideal for power modules, sensors, and onboard charging systems. Economic policies favoring electric mobility and stringent automotive safety standards further underscore this segment's importance.
- Automotive Application Drivers:
- Electric Vehicle Power Electronics: Crucial for efficient energy conversion in inverters, converters, and battery management systems.
- ADAS and Sensors: Employed in various sensors for radar, lidar, and ultrasonic systems, requiring precise and reliable operation.
- Infotainment Systems: Contributing to the stability and performance of complex audio and visual systems.
While currently smaller in market share, the Aerospace segment presents substantial high-value opportunities. The demand for lightweight, highly reliable components capable of operating in extreme environments—high temperatures, radiation, and significant mechanical stress—makes ferroelectric ceramics indispensable for critical aerospace systems, including navigation, communication, and control.
The Solid Ferroelectric Ceramics type commands the largest market share due to its widespread adoption in established electronic components. Their inherent stability and excellent dielectric properties make them the go-to choice for numerous applications. However, Powder Ferroelectric Ceramics are gaining traction, particularly for advanced manufacturing techniques like additive manufacturing and for specialized applications requiring tailored particle sizes and properties.
Ferroelectric Ceramics Product Developments
Recent product developments in ferroelectric ceramics are focused on enhancing performance characteristics for increasingly demanding applications. Innovations include the development of lead-free ferroelectric materials to meet environmental regulations, as well as compositions with improved piezoelectric and pyroelectric coefficients for higher energy harvesting efficiency and more sensitive sensors. Nanostructured ferroelectric ceramics are emerging, offering superior dielectric permittivity and reduced leakage currents for advanced capacitor designs. These advancements directly translate into smaller, more powerful electronic devices, more efficient energy storage solutions, and more sophisticated sensing capabilities across the Electronics, Automotive, and Aerospace sectors. The competitive advantage lies in achieving higher energy densities, enhanced thermal stability, and greater reliability in compact form factors.
Key Drivers of Ferroelectric Ceramics Growth
The ferroelectric ceramics market is propelled by several interconnected growth drivers. Technologically, the relentless miniaturization of electronic devices and the increasing complexity of automotive powertrains are creating an unyielding demand for high-performance dielectric materials. Economically, the global push towards electric vehicles and sustainable energy solutions directly translates into a greater need for efficient power electronics, where ferroelectric ceramics play a vital role. Regulatory factors, such as stringent environmental standards and the push for lead-free materials, are stimulating innovation and the adoption of new ferroelectric compositions. For instance, the increasing integration of advanced driver-assistance systems (ADAS) in vehicles necessitates robust and reliable sensor components.
Challenges in the Ferroelectric Ceramics Market
Despite its robust growth, the ferroelectric ceramics market faces several challenges. Regulatory hurdles, particularly concerning the use of lead-based compounds in certain regions, necessitate the development and adoption of alternative lead-free materials, which can be costly and time-consuming. Supply chain disruptions, exacerbated by global events, can impact the availability and cost of raw materials like titanium dioxide and barium carbonate. Competitive pressures from alternative dielectric materials and the continuous drive for cost reduction by end-users also present significant challenges. Quantifiable impacts include potential delays in product development and increased manufacturing expenses.
Emerging Opportunities in Ferroelectric Ceramics
Emerging opportunities in the ferroelectric ceramics market are primarily driven by technological breakthroughs and strategic market expansion. The growing field of energy harvesting, utilizing pyroelectric and piezoelectric properties of ferroelectric ceramics for self-powered sensors and IoT devices, presents a significant long-term growth catalyst. Furthermore, advancements in additive manufacturing (3D printing) of ferroelectric ceramics are opening doors for customized component designs and on-demand production, especially for niche applications in aerospace and medical devices. Strategic partnerships between material manufacturers and end-product developers are crucial for accelerating the integration of ferroelectric ceramics into next-generation technologies.
Leading Players in the Ferroelectric Ceramics Sector
- Citizen
- Kojundo Chemical
- Sparkler Ceramics
- PI Ceramic
- Techno Alpha
Key Milestones in Ferroelectric Ceramics Industry
- 2019: Increased investment in R&D for lead-free ferroelectric materials driven by environmental concerns.
- 2020: Significant growth in demand for MLCCs for 5G infrastructure deployment.
- 2021: Advancements in nanoscale ferroelectric material processing enabling higher energy density.
- 2022: Growing adoption of ferroelectric ceramics in electric vehicle power modules.
- 2023: Development of novel composite ferroelectric materials with enhanced thermal stability for aerospace applications.
- 2024: Expansion of applications in energy harvesting devices and IoT sensors.
Strategic Outlook for Ferroelectric Ceramics Market
The strategic outlook for the ferroelectric ceramics market is exceptionally promising, driven by an ongoing surge in demand from key sectors and continuous technological innovation. The market's trajectory is set to be further accelerated by the expanding electrification of transportation, the proliferation of advanced consumer electronics, and the increasing integration of smart technologies in industrial and aerospace applications. Companies focusing on developing high-performance, cost-effective, and environmentally friendly ferroelectric solutions are best positioned for sustained growth. Strategic opportunities lie in forging collaborative partnerships, investing in advanced manufacturing techniques like additive manufacturing, and capitalizing on the untapped potential of emerging applications such as energy harvesting and advanced medical devices.
Ferroelectric Ceramics Segmentation
-
1. Application
- 1.1. Electronics
- 1.2. Automotive
- 1.3. Aerospace
-
2. Types
- 2.1. Solid Ferroelectric Ceramics
- 2.2. Powder Ferroelectric Ceramics
Ferroelectric Ceramics Segmentation By Geography
-
1. North America
- 1.1. United States
- 1.2. Canada
- 1.3. Mexico
-
2. South America
- 2.1. Brazil
- 2.2. Argentina
- 2.3. Rest of South America
-
3. Europe
- 3.1. United Kingdom
- 3.2. Germany
- 3.3. France
- 3.4. Italy
- 3.5. Spain
- 3.6. Russia
- 3.7. Benelux
- 3.8. Nordics
- 3.9. Rest of Europe
-
4. Middle East & Africa
- 4.1. Turkey
- 4.2. Israel
- 4.3. GCC
- 4.4. North Africa
- 4.5. South Africa
- 4.6. Rest of Middle East & Africa
-
5. Asia Pacific
- 5.1. China
- 5.2. India
- 5.3. Japan
- 5.4. South Korea
- 5.5. ASEAN
- 5.6. Oceania
- 5.7. Rest of Asia Pacific
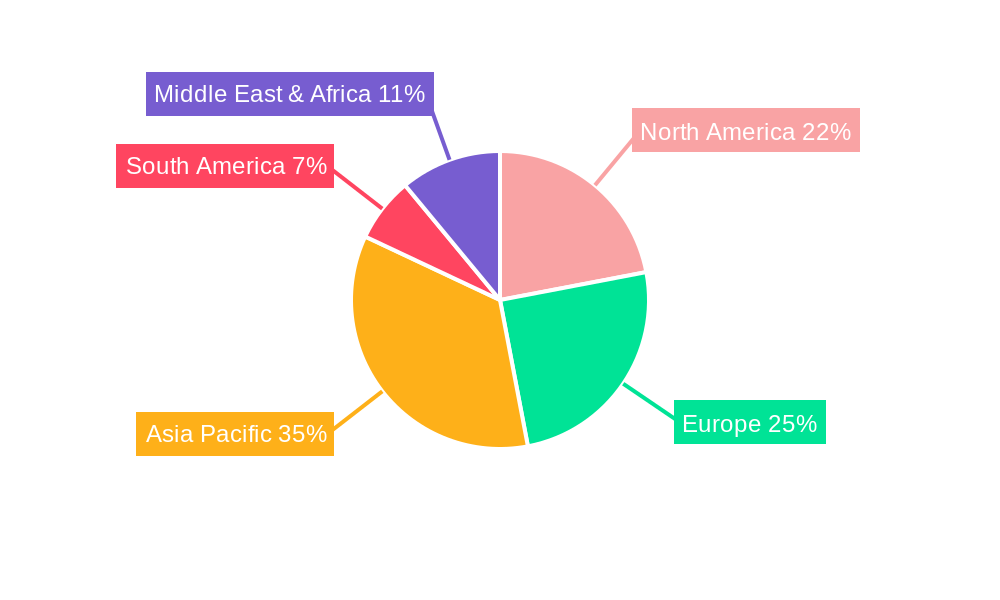
Ferroelectric Ceramics Regional Market Share
Geographic Coverage of Ferroelectric Ceramics
Ferroelectric Ceramics REPORT HIGHLIGHTS
| Aspects | Details |
|---|---|
| Study Period | 2020-2034 |
| Base Year | 2025 |
| Estimated Year | 2026 |
| Forecast Period | 2026-2034 |
| Historical Period | 2020-2025 |
| Growth Rate | CAGR of 8.4% from 2020-2034 |
| Segmentation |
|
Table of Contents
- 1. Introduction
- 1.1. Research Scope
- 1.2. Market Segmentation
- 1.3. Research Methodology
- 1.4. Definitions and Assumptions
- 2. Executive Summary
- 2.1. Introduction
- 3. Market Dynamics
- 3.1. Introduction
- 3.2. Market Drivers
- 3.3. Market Restrains
- 3.4. Market Trends
- 4. Market Factor Analysis
- 4.1. Porters Five Forces
- 4.2. Supply/Value Chain
- 4.3. PESTEL analysis
- 4.4. Market Entropy
- 4.5. Patent/Trademark Analysis
- 5. Global Ferroelectric Ceramics Analysis, Insights and Forecast, 2020-2032
- 5.1. Market Analysis, Insights and Forecast - by Application
- 5.1.1. Electronics
- 5.1.2. Automotive
- 5.1.3. Aerospace
- 5.2. Market Analysis, Insights and Forecast - by Types
- 5.2.1. Solid Ferroelectric Ceramics
- 5.2.2. Powder Ferroelectric Ceramics
- 5.3. Market Analysis, Insights and Forecast - by Region
- 5.3.1. North America
- 5.3.2. South America
- 5.3.3. Europe
- 5.3.4. Middle East & Africa
- 5.3.5. Asia Pacific
- 5.1. Market Analysis, Insights and Forecast - by Application
- 6. North America Ferroelectric Ceramics Analysis, Insights and Forecast, 2020-2032
- 6.1. Market Analysis, Insights and Forecast - by Application
- 6.1.1. Electronics
- 6.1.2. Automotive
- 6.1.3. Aerospace
- 6.2. Market Analysis, Insights and Forecast - by Types
- 6.2.1. Solid Ferroelectric Ceramics
- 6.2.2. Powder Ferroelectric Ceramics
- 6.1. Market Analysis, Insights and Forecast - by Application
- 7. South America Ferroelectric Ceramics Analysis, Insights and Forecast, 2020-2032
- 7.1. Market Analysis, Insights and Forecast - by Application
- 7.1.1. Electronics
- 7.1.2. Automotive
- 7.1.3. Aerospace
- 7.2. Market Analysis, Insights and Forecast - by Types
- 7.2.1. Solid Ferroelectric Ceramics
- 7.2.2. Powder Ferroelectric Ceramics
- 7.1. Market Analysis, Insights and Forecast - by Application
- 8. Europe Ferroelectric Ceramics Analysis, Insights and Forecast, 2020-2032
- 8.1. Market Analysis, Insights and Forecast - by Application
- 8.1.1. Electronics
- 8.1.2. Automotive
- 8.1.3. Aerospace
- 8.2. Market Analysis, Insights and Forecast - by Types
- 8.2.1. Solid Ferroelectric Ceramics
- 8.2.2. Powder Ferroelectric Ceramics
- 8.1. Market Analysis, Insights and Forecast - by Application
- 9. Middle East & Africa Ferroelectric Ceramics Analysis, Insights and Forecast, 2020-2032
- 9.1. Market Analysis, Insights and Forecast - by Application
- 9.1.1. Electronics
- 9.1.2. Automotive
- 9.1.3. Aerospace
- 9.2. Market Analysis, Insights and Forecast - by Types
- 9.2.1. Solid Ferroelectric Ceramics
- 9.2.2. Powder Ferroelectric Ceramics
- 9.1. Market Analysis, Insights and Forecast - by Application
- 10. Asia Pacific Ferroelectric Ceramics Analysis, Insights and Forecast, 2020-2032
- 10.1. Market Analysis, Insights and Forecast - by Application
- 10.1.1. Electronics
- 10.1.2. Automotive
- 10.1.3. Aerospace
- 10.2. Market Analysis, Insights and Forecast - by Types
- 10.2.1. Solid Ferroelectric Ceramics
- 10.2.2. Powder Ferroelectric Ceramics
- 10.1. Market Analysis, Insights and Forecast - by Application
- 11. Competitive Analysis
- 11.1. Global Market Share Analysis 2025
- 11.2. Company Profiles
- 11.2.1 Citizen
- 11.2.1.1. Overview
- 11.2.1.2. Products
- 11.2.1.3. SWOT Analysis
- 11.2.1.4. Recent Developments
- 11.2.1.5. Financials (Based on Availability)
- 11.2.2 Kojundo Chemical
- 11.2.2.1. Overview
- 11.2.2.2. Products
- 11.2.2.3. SWOT Analysis
- 11.2.2.4. Recent Developments
- 11.2.2.5. Financials (Based on Availability)
- 11.2.3 Sparkler Ceramics
- 11.2.3.1. Overview
- 11.2.3.2. Products
- 11.2.3.3. SWOT Analysis
- 11.2.3.4. Recent Developments
- 11.2.3.5. Financials (Based on Availability)
- 11.2.4 PI Ceramic
- 11.2.4.1. Overview
- 11.2.4.2. Products
- 11.2.4.3. SWOT Analysis
- 11.2.4.4. Recent Developments
- 11.2.4.5. Financials (Based on Availability)
- 11.2.5 Techno Alpha
- 11.2.5.1. Overview
- 11.2.5.2. Products
- 11.2.5.3. SWOT Analysis
- 11.2.5.4. Recent Developments
- 11.2.5.5. Financials (Based on Availability)
- 11.2.1 Citizen
List of Figures
- Figure 1: Global Ferroelectric Ceramics Revenue Breakdown (undefined, %) by Region 2025 & 2033
- Figure 2: North America Ferroelectric Ceramics Revenue (undefined), by Application 2025 & 2033
- Figure 3: North America Ferroelectric Ceramics Revenue Share (%), by Application 2025 & 2033
- Figure 4: North America Ferroelectric Ceramics Revenue (undefined), by Types 2025 & 2033
- Figure 5: North America Ferroelectric Ceramics Revenue Share (%), by Types 2025 & 2033
- Figure 6: North America Ferroelectric Ceramics Revenue (undefined), by Country 2025 & 2033
- Figure 7: North America Ferroelectric Ceramics Revenue Share (%), by Country 2025 & 2033
- Figure 8: South America Ferroelectric Ceramics Revenue (undefined), by Application 2025 & 2033
- Figure 9: South America Ferroelectric Ceramics Revenue Share (%), by Application 2025 & 2033
- Figure 10: South America Ferroelectric Ceramics Revenue (undefined), by Types 2025 & 2033
- Figure 11: South America Ferroelectric Ceramics Revenue Share (%), by Types 2025 & 2033
- Figure 12: South America Ferroelectric Ceramics Revenue (undefined), by Country 2025 & 2033
- Figure 13: South America Ferroelectric Ceramics Revenue Share (%), by Country 2025 & 2033
- Figure 14: Europe Ferroelectric Ceramics Revenue (undefined), by Application 2025 & 2033
- Figure 15: Europe Ferroelectric Ceramics Revenue Share (%), by Application 2025 & 2033
- Figure 16: Europe Ferroelectric Ceramics Revenue (undefined), by Types 2025 & 2033
- Figure 17: Europe Ferroelectric Ceramics Revenue Share (%), by Types 2025 & 2033
- Figure 18: Europe Ferroelectric Ceramics Revenue (undefined), by Country 2025 & 2033
- Figure 19: Europe Ferroelectric Ceramics Revenue Share (%), by Country 2025 & 2033
- Figure 20: Middle East & Africa Ferroelectric Ceramics Revenue (undefined), by Application 2025 & 2033
- Figure 21: Middle East & Africa Ferroelectric Ceramics Revenue Share (%), by Application 2025 & 2033
- Figure 22: Middle East & Africa Ferroelectric Ceramics Revenue (undefined), by Types 2025 & 2033
- Figure 23: Middle East & Africa Ferroelectric Ceramics Revenue Share (%), by Types 2025 & 2033
- Figure 24: Middle East & Africa Ferroelectric Ceramics Revenue (undefined), by Country 2025 & 2033
- Figure 25: Middle East & Africa Ferroelectric Ceramics Revenue Share (%), by Country 2025 & 2033
- Figure 26: Asia Pacific Ferroelectric Ceramics Revenue (undefined), by Application 2025 & 2033
- Figure 27: Asia Pacific Ferroelectric Ceramics Revenue Share (%), by Application 2025 & 2033
- Figure 28: Asia Pacific Ferroelectric Ceramics Revenue (undefined), by Types 2025 & 2033
- Figure 29: Asia Pacific Ferroelectric Ceramics Revenue Share (%), by Types 2025 & 2033
- Figure 30: Asia Pacific Ferroelectric Ceramics Revenue (undefined), by Country 2025 & 2033
- Figure 31: Asia Pacific Ferroelectric Ceramics Revenue Share (%), by Country 2025 & 2033
List of Tables
- Table 1: Global Ferroelectric Ceramics Revenue undefined Forecast, by Application 2020 & 2033
- Table 2: Global Ferroelectric Ceramics Revenue undefined Forecast, by Types 2020 & 2033
- Table 3: Global Ferroelectric Ceramics Revenue undefined Forecast, by Region 2020 & 2033
- Table 4: Global Ferroelectric Ceramics Revenue undefined Forecast, by Application 2020 & 2033
- Table 5: Global Ferroelectric Ceramics Revenue undefined Forecast, by Types 2020 & 2033
- Table 6: Global Ferroelectric Ceramics Revenue undefined Forecast, by Country 2020 & 2033
- Table 7: United States Ferroelectric Ceramics Revenue (undefined) Forecast, by Application 2020 & 2033
- Table 8: Canada Ferroelectric Ceramics Revenue (undefined) Forecast, by Application 2020 & 2033
- Table 9: Mexico Ferroelectric Ceramics Revenue (undefined) Forecast, by Application 2020 & 2033
- Table 10: Global Ferroelectric Ceramics Revenue undefined Forecast, by Application 2020 & 2033
- Table 11: Global Ferroelectric Ceramics Revenue undefined Forecast, by Types 2020 & 2033
- Table 12: Global Ferroelectric Ceramics Revenue undefined Forecast, by Country 2020 & 2033
- Table 13: Brazil Ferroelectric Ceramics Revenue (undefined) Forecast, by Application 2020 & 2033
- Table 14: Argentina Ferroelectric Ceramics Revenue (undefined) Forecast, by Application 2020 & 2033
- Table 15: Rest of South America Ferroelectric Ceramics Revenue (undefined) Forecast, by Application 2020 & 2033
- Table 16: Global Ferroelectric Ceramics Revenue undefined Forecast, by Application 2020 & 2033
- Table 17: Global Ferroelectric Ceramics Revenue undefined Forecast, by Types 2020 & 2033
- Table 18: Global Ferroelectric Ceramics Revenue undefined Forecast, by Country 2020 & 2033
- Table 19: United Kingdom Ferroelectric Ceramics Revenue (undefined) Forecast, by Application 2020 & 2033
- Table 20: Germany Ferroelectric Ceramics Revenue (undefined) Forecast, by Application 2020 & 2033
- Table 21: France Ferroelectric Ceramics Revenue (undefined) Forecast, by Application 2020 & 2033
- Table 22: Italy Ferroelectric Ceramics Revenue (undefined) Forecast, by Application 2020 & 2033
- Table 23: Spain Ferroelectric Ceramics Revenue (undefined) Forecast, by Application 2020 & 2033
- Table 24: Russia Ferroelectric Ceramics Revenue (undefined) Forecast, by Application 2020 & 2033
- Table 25: Benelux Ferroelectric Ceramics Revenue (undefined) Forecast, by Application 2020 & 2033
- Table 26: Nordics Ferroelectric Ceramics Revenue (undefined) Forecast, by Application 2020 & 2033
- Table 27: Rest of Europe Ferroelectric Ceramics Revenue (undefined) Forecast, by Application 2020 & 2033
- Table 28: Global Ferroelectric Ceramics Revenue undefined Forecast, by Application 2020 & 2033
- Table 29: Global Ferroelectric Ceramics Revenue undefined Forecast, by Types 2020 & 2033
- Table 30: Global Ferroelectric Ceramics Revenue undefined Forecast, by Country 2020 & 2033
- Table 31: Turkey Ferroelectric Ceramics Revenue (undefined) Forecast, by Application 2020 & 2033
- Table 32: Israel Ferroelectric Ceramics Revenue (undefined) Forecast, by Application 2020 & 2033
- Table 33: GCC Ferroelectric Ceramics Revenue (undefined) Forecast, by Application 2020 & 2033
- Table 34: North Africa Ferroelectric Ceramics Revenue (undefined) Forecast, by Application 2020 & 2033
- Table 35: South Africa Ferroelectric Ceramics Revenue (undefined) Forecast, by Application 2020 & 2033
- Table 36: Rest of Middle East & Africa Ferroelectric Ceramics Revenue (undefined) Forecast, by Application 2020 & 2033
- Table 37: Global Ferroelectric Ceramics Revenue undefined Forecast, by Application 2020 & 2033
- Table 38: Global Ferroelectric Ceramics Revenue undefined Forecast, by Types 2020 & 2033
- Table 39: Global Ferroelectric Ceramics Revenue undefined Forecast, by Country 2020 & 2033
- Table 40: China Ferroelectric Ceramics Revenue (undefined) Forecast, by Application 2020 & 2033
- Table 41: India Ferroelectric Ceramics Revenue (undefined) Forecast, by Application 2020 & 2033
- Table 42: Japan Ferroelectric Ceramics Revenue (undefined) Forecast, by Application 2020 & 2033
- Table 43: South Korea Ferroelectric Ceramics Revenue (undefined) Forecast, by Application 2020 & 2033
- Table 44: ASEAN Ferroelectric Ceramics Revenue (undefined) Forecast, by Application 2020 & 2033
- Table 45: Oceania Ferroelectric Ceramics Revenue (undefined) Forecast, by Application 2020 & 2033
- Table 46: Rest of Asia Pacific Ferroelectric Ceramics Revenue (undefined) Forecast, by Application 2020 & 2033
Frequently Asked Questions
1. What is the projected Compound Annual Growth Rate (CAGR) of the Ferroelectric Ceramics?
The projected CAGR is approximately 8.4%.
2. Which companies are prominent players in the Ferroelectric Ceramics?
Key companies in the market include Citizen, Kojundo Chemical, Sparkler Ceramics, PI Ceramic, Techno Alpha.
3. What are the main segments of the Ferroelectric Ceramics?
The market segments include Application, Types.
4. Can you provide details about the market size?
The market size is estimated to be USD XXX N/A as of 2022.
5. What are some drivers contributing to market growth?
N/A
6. What are the notable trends driving market growth?
N/A
7. Are there any restraints impacting market growth?
N/A
8. Can you provide examples of recent developments in the market?
N/A
9. What pricing options are available for accessing the report?
Pricing options include single-user, multi-user, and enterprise licenses priced at USD 4900.00, USD 7350.00, and USD 9800.00 respectively.
10. Is the market size provided in terms of value or volume?
The market size is provided in terms of value, measured in N/A.
11. Are there any specific market keywords associated with the report?
Yes, the market keyword associated with the report is "Ferroelectric Ceramics," which aids in identifying and referencing the specific market segment covered.
12. How do I determine which pricing option suits my needs best?
The pricing options vary based on user requirements and access needs. Individual users may opt for single-user licenses, while businesses requiring broader access may choose multi-user or enterprise licenses for cost-effective access to the report.
13. Are there any additional resources or data provided in the Ferroelectric Ceramics report?
While the report offers comprehensive insights, it's advisable to review the specific contents or supplementary materials provided to ascertain if additional resources or data are available.
14. How can I stay updated on further developments or reports in the Ferroelectric Ceramics?
To stay informed about further developments, trends, and reports in the Ferroelectric Ceramics, consider subscribing to industry newsletters, following relevant companies and organizations, or regularly checking reputable industry news sources and publications.
Methodology
Step 1 - Identification of Relevant Samples Size from Population Database


Step 2 - Approaches for Defining Global Market Size (Value, Volume* & Price*)

Note*: In applicable scenarios
Step 3 - Data Sources
Primary Research
- Web Analytics
- Survey Reports
- Research Institute
- Latest Research Reports
- Opinion Leaders
Secondary Research
- Annual Reports
- White Paper
- Latest Press Release
- Industry Association
- Paid Database
- Investor Presentations

Step 4 - Data Triangulation
Involves using different sources of information in order to increase the validity of a study
These sources are likely to be stakeholders in a program - participants, other researchers, program staff, other community members, and so on.
Then we put all data in single framework & apply various statistical tools to find out the dynamic on the market.
During the analysis stage, feedback from the stakeholder groups would be compared to determine areas of agreement as well as areas of divergence