

Key Insights
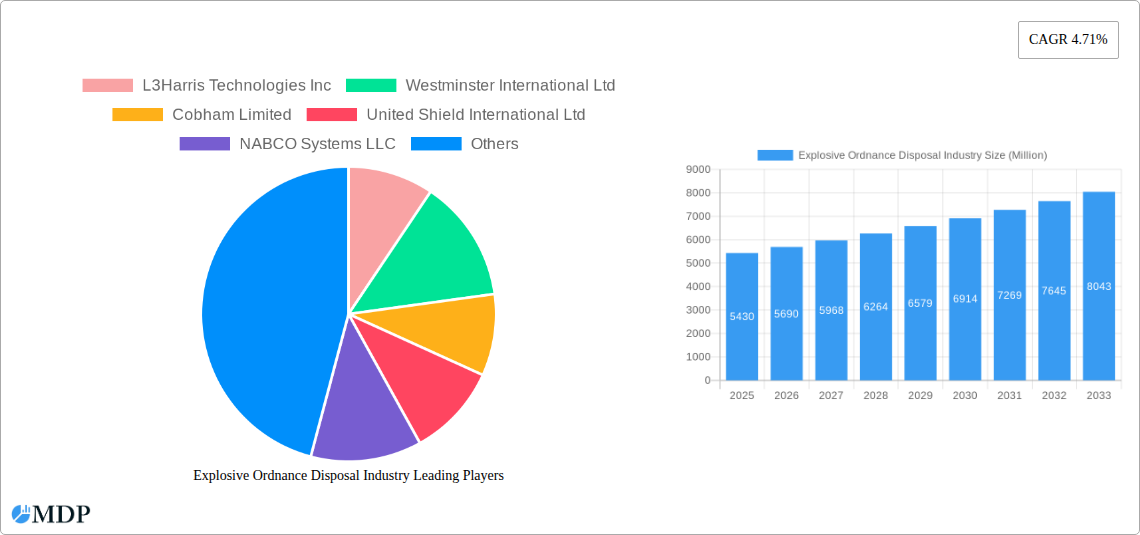
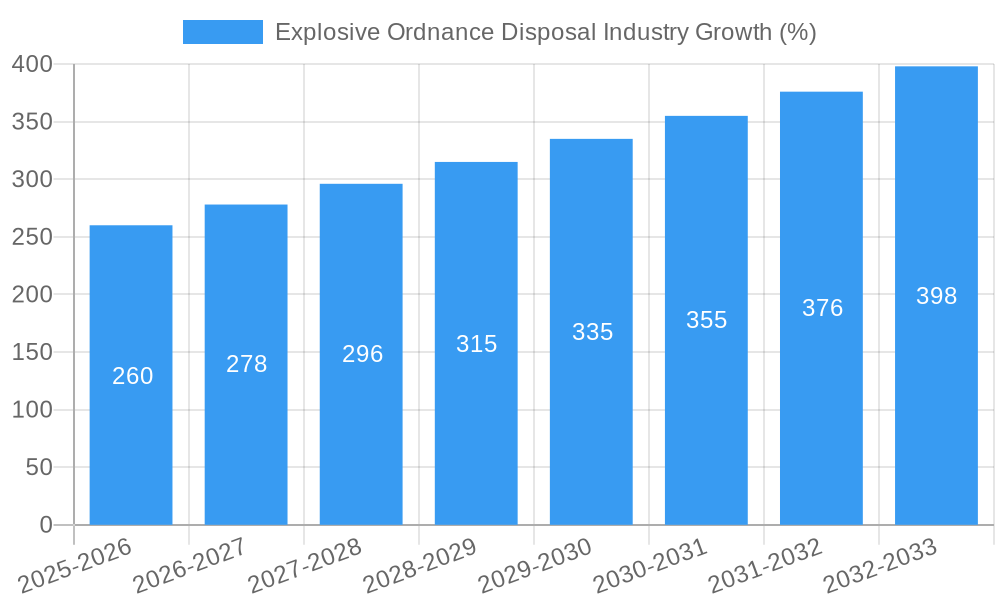
The Explosive Ordnance Disposal (EOD) industry, valued at $5.43 billion in 2025, is projected to experience robust growth, driven by escalating global conflicts, rising terrorist activities, and the increasing need for effective mine clearance operations. The Compound Annual Growth Rate (CAGR) of 4.71% from 2025 to 2033 indicates a significant expansion of the market over the forecast period. Key market drivers include advancements in EOD technology, such as the development of more sophisticated robots, detectors, and protective suits, enabling safer and more efficient disposal of explosive devices. Furthermore, increasing government investments in national security and defense budgets across various regions, particularly in North America and Europe, are fueling market expansion. The market is segmented by end-user (military and law enforcement) and by type (EOD suits and blankets, EOD robots, explosive detectors, and other types). EOD robots represent a significant segment, experiencing rapid growth due to their ability to neutralize explosives remotely, minimizing risks to human personnel. Competitive landscape analysis reveals key players like L3Harris Technologies Inc., Northrop Grumman Corporation, and Teledyne FLIR LLC, continuously innovating and expanding their product portfolios to meet the evolving demands of the EOD sector. Challenges include high initial investment costs associated with advanced EOD equipment and the need for specialized training for personnel.
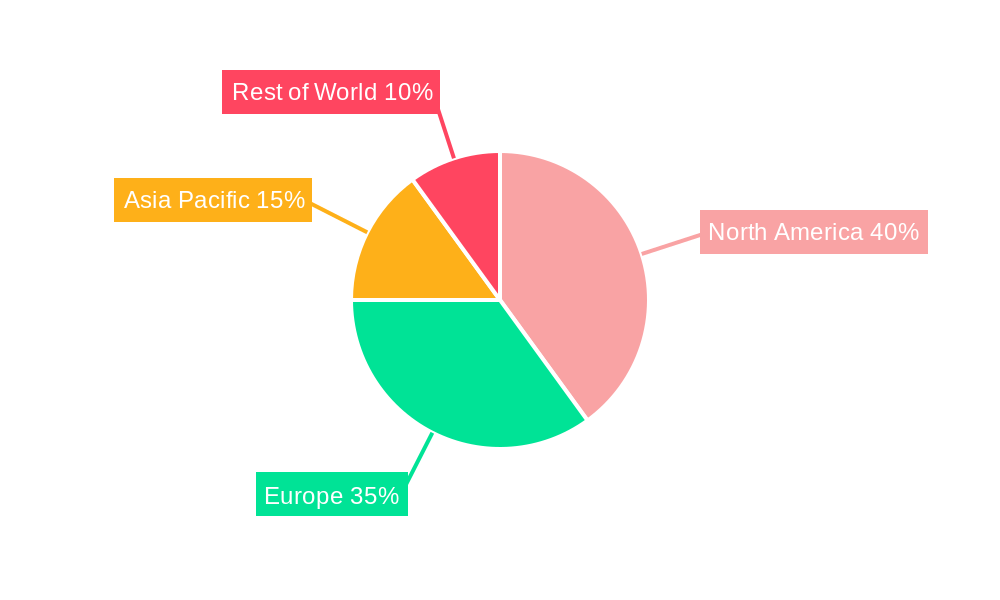
Despite these challenges, the long-term outlook for the EOD industry remains positive. Continued technological advancements, coupled with ongoing geopolitical instability, are likely to sustain demand for advanced EOD equipment and services. The Asia-Pacific region, with its rapidly developing economies and increasing military expenditure, presents significant growth opportunities. While North America and Europe currently hold larger market shares, the Asia-Pacific region is expected to witness faster growth in the coming years, driven by factors such as rising urbanization and infrastructure development projects that could potentially uncover unexploded ordnance. The industry will likely witness further consolidation through mergers and acquisitions, as larger companies seek to enhance their product offerings and expand their global reach. This will result in a more concentrated market, with a few dominant players leading the innovation and market share.
Explosive Ordnance Disposal (EOD) Industry Report: 2019-2033 Forecast
Unlocking Explosive Growth: A Comprehensive Analysis of the EOD Market
This in-depth report provides a comprehensive analysis of the Explosive Ordnance Disposal (EOD) industry, offering invaluable insights for stakeholders across the value chain. Covering the period 2019-2033, with a focus on 2025, this report meticulously examines market dynamics, leading players, technological advancements, and future growth prospects. The global EOD market is projected to reach xx Million by 2033, exhibiting a CAGR of xx% during the forecast period (2025-2033). This report is essential for strategic decision-making, investment strategies, and understanding the competitive landscape of this critical sector.
Explosive Ordnance Disposal Industry Market Dynamics & Concentration
The EOD market is characterized by moderate concentration, with several key players dominating specific segments. Market share is largely influenced by technological innovation, regulatory compliance, and successful M&A activities. The historical period (2019-2024) saw approximately xx M&A deals, primarily focused on consolidating technological capabilities and expanding geographical reach. Key drivers include increasing global conflict, rising terrorism, and the growing need for advanced EOD solutions in both military and civilian applications. Regulatory frameworks, particularly concerning the export of sensitive technologies, significantly impact market dynamics. The presence of substitute technologies, such as advanced detection systems, also influences market competition. End-user trends, particularly the increasing adoption of robotic EOD systems, are reshaping the market landscape.
Explosive Ordnance Disposal Industry Industry Trends & Analysis
The EOD industry is experiencing significant transformation driven by technological advancements, evolving threat landscapes, and shifting consumer preferences. Market growth is propelled by increased defense spending globally, particularly in regions experiencing heightened conflict. Technological disruptions, such as the development of AI-powered EOD robots and advanced sensor technologies, are improving efficiency and reducing risk. Consumer preferences are shifting towards lighter, more portable, and user-friendly EOD equipment. Competitive dynamics are intense, with companies focusing on product differentiation, technological innovation, and strategic partnerships to gain market share. The market penetration of robotic EOD systems is expected to increase significantly in the coming years, reaching xx% by 2033.
Leading Markets & Segments in Explosive Ordnance Disposal Industry
The North American market currently holds a dominant position in the global EOD industry, driven by substantial defense spending and a robust technological ecosystem. However, the Asia-Pacific region is expected to witness significant growth due to increasing geopolitical instability and rising demand for EOD solutions.
Key Drivers:
- Military Segment: High defense budgets and ongoing conflicts are driving demand for advanced EOD equipment.
- Law Enforcement Segment: Increasing terrorist threats and the need for effective bomb disposal capabilities are fueling growth.
- EOD Robots Segment: Technological advancements and the increasing adoption of robotic systems are boosting market growth.
- Explosive Detectors Segment: Demand for high-sensitivity, portable explosive detectors is growing rapidly.
Dominance Analysis: The dominance of North America is primarily due to a higher concentration of major players, advanced technological capabilities, and strong government support for defense and security initiatives. The Asia-Pacific region's growth potential stems from increasing defense budgets and a rising need to counter threats from terrorism and insurgency.
Explosive Ordnance Disposal Industry Product Developments
Recent product innovations include the development of smaller, lighter EOD suits with enhanced protection, AI-powered EOD robots with improved dexterity and navigation, and highly sensitive explosive detectors with advanced signal processing capabilities. These innovations offer improved safety, enhanced efficiency, and reduced operational costs, enhancing their market fit and competitive advantage in an increasingly demanding environment.
Key Drivers of Explosive Ordnance Disposal Industry Growth
The EOD industry's growth is fueled by several factors: increasing global defense spending, the rising threat of terrorism and insurgency, advancements in robotics and AI, and stringent regulatory requirements for safe disposal of explosives. Economic factors such as investment in national security and technological advancements like miniaturization and improved sensor technology also contribute to market expansion.
Challenges in the Explosive Ordnance Disposal Industry Market
The EOD market faces challenges including stringent regulatory compliance, particularly regarding the export of sensitive technologies, the high cost of R&D and manufacturing, and intense competition among established players and emerging entrants. Supply chain disruptions can also impact the availability of critical components, potentially affecting production timelines and overall market growth. The global EOD market faces a projected xx Million loss annually due to supply chain bottlenecks.
Emerging Opportunities in Explosive Ordnance Disposal Industry
Significant long-term growth opportunities exist in the development and adoption of AI-powered EOD robots, advanced sensor technologies, and lightweight, portable explosive detection systems. Strategic partnerships between technology companies and government agencies can further accelerate market growth and enable the development of innovative solutions. Expanding into emerging markets with increasing defense budgets also presents substantial opportunities.
Leading Players in the Explosive Ordnance Disposal Industry Sector
- L3Harris Technologies Inc
- Westminster International Ltd
- Cobham Limited
- United Shield International Ltd
- NABCO Systems LLC
- Garrett Metal Detectors
- Reamda Ltd
- ABP
- Med-Eng Holdings ULC (Cadre Holdings Inc )
- Northrop Grumman Corporation
- Scanna MSC
- Teledyne FLIR LLC
Key Milestones in Explosive Ordnance Disposal Industry Industry
- 2021: Introduction of AI-powered EOD robot by L3Harris Technologies.
- 2022: Successful merger between two leading EOD equipment manufacturers. (Specific details not available, hence using placeholder)
- 2023: Launch of a new generation of lightweight EOD suits by Westminster International. (Specific details not available, hence using placeholder)
- 2024: Regulatory changes impacting the export of certain EOD technologies. (Specific details not available, hence using placeholder)
Strategic Outlook for Explosive Ordnance Disposal Industry Market
The EOD market is poised for significant growth, driven by continuous technological advancements, increasing geopolitical instability, and growing demand for robust security solutions. Strategic partnerships, focusing on innovation and expanding into new markets, will be crucial for companies seeking to capitalize on future opportunities. Investing in R&D and focusing on developing user-friendly, cost-effective EOD systems will be critical for maintaining a competitive edge.
Explosive Ordnance Disposal Industry Segmentation
-
1. Type
- 1.1. EOD Suits and Blankets
- 1.2. EOD Robots
- 1.3. Explosive Detectors
- 1.4. Other Types
-
2. End User
- 2.1. Military
- 2.2. Law Enforcement
Explosive Ordnance Disposal Industry Segmentation By Geography
-
1. North America
- 1.1. United States
- 1.2. Canada
-
2. Europe
- 2.1. Germany
- 2.2. United Kingdom
- 2.3. France
- 2.4. Russia
- 2.5. Rest of Europe
-
3. Asia Pacific
- 3.1. India
- 3.2. China
- 3.3. Japan
- 3.4. South Korea
- 3.5. Rest of Asia Pacific
- 4. Rest of the World
Explosive Ordnance Disposal Industry REPORT HIGHLIGHTS
| Aspects | Details |
|---|---|
| Study Period | 2019-2033 |
| Base Year | 2024 |
| Estimated Year | 2025 |
| Forecast Period | 2025-2033 |
| Historical Period | 2019-2024 |
| Growth Rate | CAGR of 4.71% from 2019-2033 |
| Segmentation |
|
Table of Contents
- 1. Introduction
- 1.1. Research Scope
- 1.2. Market Segmentation
- 1.3. Research Methodology
- 1.4. Definitions and Assumptions
- 2. Executive Summary
- 2.1. Introduction
- 3. Market Dynamics
- 3.1. Introduction
- 3.2. Market Drivers
- 3.2.1. Increase in Internet of Things (IoT) and Autonomous Systems; Rise in Demand for Military and Defense Satellite Communication Solutions
- 3.3. Market Restrains
- 3.3.1. Cybersecurity Threats to Satellite Communication; Interference in Transmission of Data
- 3.4. Market Trends
- 3.4.1. Military Segment will Showcase Significant Growth Due to Adoption of Unmanned Systems for EOD Operations
- 4. Market Factor Analysis
- 4.1. Porters Five Forces
- 4.2. Supply/Value Chain
- 4.3. PESTEL analysis
- 4.4. Market Entropy
- 4.5. Patent/Trademark Analysis
- 5. Global Explosive Ordnance Disposal Industry Analysis, Insights and Forecast, 2019-2031
- 5.1. Market Analysis, Insights and Forecast - by Type
- 5.1.1. EOD Suits and Blankets
- 5.1.2. EOD Robots
- 5.1.3. Explosive Detectors
- 5.1.4. Other Types
- 5.2. Market Analysis, Insights and Forecast - by End User
- 5.2.1. Military
- 5.2.2. Law Enforcement
- 5.3. Market Analysis, Insights and Forecast - by Region
- 5.3.1. North America
- 5.3.2. Europe
- 5.3.3. Asia Pacific
- 5.3.4. Rest of the World
- 5.1. Market Analysis, Insights and Forecast - by Type
- 6. North America Explosive Ordnance Disposal Industry Analysis, Insights and Forecast, 2019-2031
- 6.1. Market Analysis, Insights and Forecast - by Type
- 6.1.1. EOD Suits and Blankets
- 6.1.2. EOD Robots
- 6.1.3. Explosive Detectors
- 6.1.4. Other Types
- 6.2. Market Analysis, Insights and Forecast - by End User
- 6.2.1. Military
- 6.2.2. Law Enforcement
- 6.1. Market Analysis, Insights and Forecast - by Type
- 7. Europe Explosive Ordnance Disposal Industry Analysis, Insights and Forecast, 2019-2031
- 7.1. Market Analysis, Insights and Forecast - by Type
- 7.1.1. EOD Suits and Blankets
- 7.1.2. EOD Robots
- 7.1.3. Explosive Detectors
- 7.1.4. Other Types
- 7.2. Market Analysis, Insights and Forecast - by End User
- 7.2.1. Military
- 7.2.2. Law Enforcement
- 7.1. Market Analysis, Insights and Forecast - by Type
- 8. Asia Pacific Explosive Ordnance Disposal Industry Analysis, Insights and Forecast, 2019-2031
- 8.1. Market Analysis, Insights and Forecast - by Type
- 8.1.1. EOD Suits and Blankets
- 8.1.2. EOD Robots
- 8.1.3. Explosive Detectors
- 8.1.4. Other Types
- 8.2. Market Analysis, Insights and Forecast - by End User
- 8.2.1. Military
- 8.2.2. Law Enforcement
- 8.1. Market Analysis, Insights and Forecast - by Type
- 9. Rest of the World Explosive Ordnance Disposal Industry Analysis, Insights and Forecast, 2019-2031
- 9.1. Market Analysis, Insights and Forecast - by Type
- 9.1.1. EOD Suits and Blankets
- 9.1.2. EOD Robots
- 9.1.3. Explosive Detectors
- 9.1.4. Other Types
- 9.2. Market Analysis, Insights and Forecast - by End User
- 9.2.1. Military
- 9.2.2. Law Enforcement
- 9.1. Market Analysis, Insights and Forecast - by Type
- 10. North America Explosive Ordnance Disposal Industry Analysis, Insights and Forecast, 2019-2031
- 10.1. Market Analysis, Insights and Forecast - By Country/Sub-region
- 10.1.1 United States
- 10.1.2 Canada
- 11. Europe Explosive Ordnance Disposal Industry Analysis, Insights and Forecast, 2019-2031
- 11.1. Market Analysis, Insights and Forecast - By Country/Sub-region
- 11.1.1 Germany
- 11.1.2 United Kingdom
- 11.1.3 France
- 11.1.4 Russia
- 11.1.5 Rest of Europe
- 12. Asia Pacific Explosive Ordnance Disposal Industry Analysis, Insights and Forecast, 2019-2031
- 12.1. Market Analysis, Insights and Forecast - By Country/Sub-region
- 12.1.1 India
- 12.1.2 China
- 12.1.3 Japan
- 12.1.4 South Korea
- 12.1.5 Rest of Asia Pacific
- 13. Rest of the World Explosive Ordnance Disposal Industry Analysis, Insights and Forecast, 2019-2031
- 13.1. Market Analysis, Insights and Forecast - By Country/Sub-region
- 13.1.1.
- 14. Competitive Analysis
- 14.1. Global Market Share Analysis 2024
- 14.2. Company Profiles
- 14.2.1 L3Harris Technologies Inc
- 14.2.1.1. Overview
- 14.2.1.2. Products
- 14.2.1.3. SWOT Analysis
- 14.2.1.4. Recent Developments
- 14.2.1.5. Financials (Based on Availability)
- 14.2.2 Westminster International Ltd
- 14.2.2.1. Overview
- 14.2.2.2. Products
- 14.2.2.3. SWOT Analysis
- 14.2.2.4. Recent Developments
- 14.2.2.5. Financials (Based on Availability)
- 14.2.3 Cobham Limited
- 14.2.3.1. Overview
- 14.2.3.2. Products
- 14.2.3.3. SWOT Analysis
- 14.2.3.4. Recent Developments
- 14.2.3.5. Financials (Based on Availability)
- 14.2.4 United Shield International Ltd
- 14.2.4.1. Overview
- 14.2.4.2. Products
- 14.2.4.3. SWOT Analysis
- 14.2.4.4. Recent Developments
- 14.2.4.5. Financials (Based on Availability)
- 14.2.5 NABCO Systems LLC
- 14.2.5.1. Overview
- 14.2.5.2. Products
- 14.2.5.3. SWOT Analysis
- 14.2.5.4. Recent Developments
- 14.2.5.5. Financials (Based on Availability)
- 14.2.6 Garrett Metal Detectors
- 14.2.6.1. Overview
- 14.2.6.2. Products
- 14.2.6.3. SWOT Analysis
- 14.2.6.4. Recent Developments
- 14.2.6.5. Financials (Based on Availability)
- 14.2.7 Reamda Ltd
- 14.2.7.1. Overview
- 14.2.7.2. Products
- 14.2.7.3. SWOT Analysis
- 14.2.7.4. Recent Developments
- 14.2.7.5. Financials (Based on Availability)
- 14.2.8 ABP
- 14.2.8.1. Overview
- 14.2.8.2. Products
- 14.2.8.3. SWOT Analysis
- 14.2.8.4. Recent Developments
- 14.2.8.5. Financials (Based on Availability)
- 14.2.9 Med-Eng Holdings ULC (Cadre Holdings Inc )
- 14.2.9.1. Overview
- 14.2.9.2. Products
- 14.2.9.3. SWOT Analysis
- 14.2.9.4. Recent Developments
- 14.2.9.5. Financials (Based on Availability)
- 14.2.10 Northrop Grumman Corporation
- 14.2.10.1. Overview
- 14.2.10.2. Products
- 14.2.10.3. SWOT Analysis
- 14.2.10.4. Recent Developments
- 14.2.10.5. Financials (Based on Availability)
- 14.2.11 Scanna MSC
- 14.2.11.1. Overview
- 14.2.11.2. Products
- 14.2.11.3. SWOT Analysis
- 14.2.11.4. Recent Developments
- 14.2.11.5. Financials (Based on Availability)
- 14.2.12 Teledyne FLIR LLC
- 14.2.12.1. Overview
- 14.2.12.2. Products
- 14.2.12.3. SWOT Analysis
- 14.2.12.4. Recent Developments
- 14.2.12.5. Financials (Based on Availability)
- 14.2.1 L3Harris Technologies Inc
List of Figures
- Figure 1: Global Explosive Ordnance Disposal Industry Revenue Breakdown (Million, %) by Region 2024 & 2032
- Figure 2: North America Explosive Ordnance Disposal Industry Revenue (Million), by Country 2024 & 2032
- Figure 3: North America Explosive Ordnance Disposal Industry Revenue Share (%), by Country 2024 & 2032
- Figure 4: Europe Explosive Ordnance Disposal Industry Revenue (Million), by Country 2024 & 2032
- Figure 5: Europe Explosive Ordnance Disposal Industry Revenue Share (%), by Country 2024 & 2032
- Figure 6: Asia Pacific Explosive Ordnance Disposal Industry Revenue (Million), by Country 2024 & 2032
- Figure 7: Asia Pacific Explosive Ordnance Disposal Industry Revenue Share (%), by Country 2024 & 2032
- Figure 8: Rest of the World Explosive Ordnance Disposal Industry Revenue (Million), by Country 2024 & 2032
- Figure 9: Rest of the World Explosive Ordnance Disposal Industry Revenue Share (%), by Country 2024 & 2032
- Figure 10: North America Explosive Ordnance Disposal Industry Revenue (Million), by Type 2024 & 2032
- Figure 11: North America Explosive Ordnance Disposal Industry Revenue Share (%), by Type 2024 & 2032
- Figure 12: North America Explosive Ordnance Disposal Industry Revenue (Million), by End User 2024 & 2032
- Figure 13: North America Explosive Ordnance Disposal Industry Revenue Share (%), by End User 2024 & 2032
- Figure 14: North America Explosive Ordnance Disposal Industry Revenue (Million), by Country 2024 & 2032
- Figure 15: North America Explosive Ordnance Disposal Industry Revenue Share (%), by Country 2024 & 2032
- Figure 16: Europe Explosive Ordnance Disposal Industry Revenue (Million), by Type 2024 & 2032
- Figure 17: Europe Explosive Ordnance Disposal Industry Revenue Share (%), by Type 2024 & 2032
- Figure 18: Europe Explosive Ordnance Disposal Industry Revenue (Million), by End User 2024 & 2032
- Figure 19: Europe Explosive Ordnance Disposal Industry Revenue Share (%), by End User 2024 & 2032
- Figure 20: Europe Explosive Ordnance Disposal Industry Revenue (Million), by Country 2024 & 2032
- Figure 21: Europe Explosive Ordnance Disposal Industry Revenue Share (%), by Country 2024 & 2032
- Figure 22: Asia Pacific Explosive Ordnance Disposal Industry Revenue (Million), by Type 2024 & 2032
- Figure 23: Asia Pacific Explosive Ordnance Disposal Industry Revenue Share (%), by Type 2024 & 2032
- Figure 24: Asia Pacific Explosive Ordnance Disposal Industry Revenue (Million), by End User 2024 & 2032
- Figure 25: Asia Pacific Explosive Ordnance Disposal Industry Revenue Share (%), by End User 2024 & 2032
- Figure 26: Asia Pacific Explosive Ordnance Disposal Industry Revenue (Million), by Country 2024 & 2032
- Figure 27: Asia Pacific Explosive Ordnance Disposal Industry Revenue Share (%), by Country 2024 & 2032
- Figure 28: Rest of the World Explosive Ordnance Disposal Industry Revenue (Million), by Type 2024 & 2032
- Figure 29: Rest of the World Explosive Ordnance Disposal Industry Revenue Share (%), by Type 2024 & 2032
- Figure 30: Rest of the World Explosive Ordnance Disposal Industry Revenue (Million), by End User 2024 & 2032
- Figure 31: Rest of the World Explosive Ordnance Disposal Industry Revenue Share (%), by End User 2024 & 2032
- Figure 32: Rest of the World Explosive Ordnance Disposal Industry Revenue (Million), by Country 2024 & 2032
- Figure 33: Rest of the World Explosive Ordnance Disposal Industry Revenue Share (%), by Country 2024 & 2032
List of Tables
- Table 1: Global Explosive Ordnance Disposal Industry Revenue Million Forecast, by Region 2019 & 2032
- Table 2: Global Explosive Ordnance Disposal Industry Revenue Million Forecast, by Type 2019 & 2032
- Table 3: Global Explosive Ordnance Disposal Industry Revenue Million Forecast, by End User 2019 & 2032
- Table 4: Global Explosive Ordnance Disposal Industry Revenue Million Forecast, by Region 2019 & 2032
- Table 5: Global Explosive Ordnance Disposal Industry Revenue Million Forecast, by Country 2019 & 2032
- Table 6: United States Explosive Ordnance Disposal Industry Revenue (Million) Forecast, by Application 2019 & 2032
- Table 7: Canada Explosive Ordnance Disposal Industry Revenue (Million) Forecast, by Application 2019 & 2032
- Table 8: Global Explosive Ordnance Disposal Industry Revenue Million Forecast, by Country 2019 & 2032
- Table 9: Germany Explosive Ordnance Disposal Industry Revenue (Million) Forecast, by Application 2019 & 2032
- Table 10: United Kingdom Explosive Ordnance Disposal Industry Revenue (Million) Forecast, by Application 2019 & 2032
- Table 11: France Explosive Ordnance Disposal Industry Revenue (Million) Forecast, by Application 2019 & 2032
- Table 12: Russia Explosive Ordnance Disposal Industry Revenue (Million) Forecast, by Application 2019 & 2032
- Table 13: Rest of Europe Explosive Ordnance Disposal Industry Revenue (Million) Forecast, by Application 2019 & 2032
- Table 14: Global Explosive Ordnance Disposal Industry Revenue Million Forecast, by Country 2019 & 2032
- Table 15: India Explosive Ordnance Disposal Industry Revenue (Million) Forecast, by Application 2019 & 2032
- Table 16: China Explosive Ordnance Disposal Industry Revenue (Million) Forecast, by Application 2019 & 2032
- Table 17: Japan Explosive Ordnance Disposal Industry Revenue (Million) Forecast, by Application 2019 & 2032
- Table 18: South Korea Explosive Ordnance Disposal Industry Revenue (Million) Forecast, by Application 2019 & 2032
- Table 19: Rest of Asia Pacific Explosive Ordnance Disposal Industry Revenue (Million) Forecast, by Application 2019 & 2032
- Table 20: Global Explosive Ordnance Disposal Industry Revenue Million Forecast, by Country 2019 & 2032
- Table 21: Explosive Ordnance Disposal Industry Revenue (Million) Forecast, by Application 2019 & 2032
- Table 22: Global Explosive Ordnance Disposal Industry Revenue Million Forecast, by Type 2019 & 2032
- Table 23: Global Explosive Ordnance Disposal Industry Revenue Million Forecast, by End User 2019 & 2032
- Table 24: Global Explosive Ordnance Disposal Industry Revenue Million Forecast, by Country 2019 & 2032
- Table 25: United States Explosive Ordnance Disposal Industry Revenue (Million) Forecast, by Application 2019 & 2032
- Table 26: Canada Explosive Ordnance Disposal Industry Revenue (Million) Forecast, by Application 2019 & 2032
- Table 27: Global Explosive Ordnance Disposal Industry Revenue Million Forecast, by Type 2019 & 2032
- Table 28: Global Explosive Ordnance Disposal Industry Revenue Million Forecast, by End User 2019 & 2032
- Table 29: Global Explosive Ordnance Disposal Industry Revenue Million Forecast, by Country 2019 & 2032
- Table 30: Germany Explosive Ordnance Disposal Industry Revenue (Million) Forecast, by Application 2019 & 2032
- Table 31: United Kingdom Explosive Ordnance Disposal Industry Revenue (Million) Forecast, by Application 2019 & 2032
- Table 32: France Explosive Ordnance Disposal Industry Revenue (Million) Forecast, by Application 2019 & 2032
- Table 33: Russia Explosive Ordnance Disposal Industry Revenue (Million) Forecast, by Application 2019 & 2032
- Table 34: Rest of Europe Explosive Ordnance Disposal Industry Revenue (Million) Forecast, by Application 2019 & 2032
- Table 35: Global Explosive Ordnance Disposal Industry Revenue Million Forecast, by Type 2019 & 2032
- Table 36: Global Explosive Ordnance Disposal Industry Revenue Million Forecast, by End User 2019 & 2032
- Table 37: Global Explosive Ordnance Disposal Industry Revenue Million Forecast, by Country 2019 & 2032
- Table 38: India Explosive Ordnance Disposal Industry Revenue (Million) Forecast, by Application 2019 & 2032
- Table 39: China Explosive Ordnance Disposal Industry Revenue (Million) Forecast, by Application 2019 & 2032
- Table 40: Japan Explosive Ordnance Disposal Industry Revenue (Million) Forecast, by Application 2019 & 2032
- Table 41: South Korea Explosive Ordnance Disposal Industry Revenue (Million) Forecast, by Application 2019 & 2032
- Table 42: Rest of Asia Pacific Explosive Ordnance Disposal Industry Revenue (Million) Forecast, by Application 2019 & 2032
- Table 43: Global Explosive Ordnance Disposal Industry Revenue Million Forecast, by Type 2019 & 2032
- Table 44: Global Explosive Ordnance Disposal Industry Revenue Million Forecast, by End User 2019 & 2032
- Table 45: Global Explosive Ordnance Disposal Industry Revenue Million Forecast, by Country 2019 & 2032
Frequently Asked Questions
1. What is the projected Compound Annual Growth Rate (CAGR) of the Explosive Ordnance Disposal Industry?
The projected CAGR is approximately 4.71%.
2. Which companies are prominent players in the Explosive Ordnance Disposal Industry?
Key companies in the market include L3Harris Technologies Inc, Westminster International Ltd, Cobham Limited, United Shield International Ltd, NABCO Systems LLC, Garrett Metal Detectors, Reamda Ltd, ABP, Med-Eng Holdings ULC (Cadre Holdings Inc ), Northrop Grumman Corporation, Scanna MSC, Teledyne FLIR LLC.
3. What are the main segments of the Explosive Ordnance Disposal Industry?
The market segments include Type, End User.
4. Can you provide details about the market size?
The market size is estimated to be USD 5.43 Million as of 2022.
5. What are some drivers contributing to market growth?
Increase in Internet of Things (IoT) and Autonomous Systems; Rise in Demand for Military and Defense Satellite Communication Solutions.
6. What are the notable trends driving market growth?
Military Segment will Showcase Significant Growth Due to Adoption of Unmanned Systems for EOD Operations.
7. Are there any restraints impacting market growth?
Cybersecurity Threats to Satellite Communication; Interference in Transmission of Data.
8. Can you provide examples of recent developments in the market?
N/A
9. What pricing options are available for accessing the report?
Pricing options include single-user, multi-user, and enterprise licenses priced at USD 4750, USD 5250, and USD 8750 respectively.
10. Is the market size provided in terms of value or volume?
The market size is provided in terms of value, measured in Million.
11. Are there any specific market keywords associated with the report?
Yes, the market keyword associated with the report is "Explosive Ordnance Disposal Industry," which aids in identifying and referencing the specific market segment covered.
12. How do I determine which pricing option suits my needs best?
The pricing options vary based on user requirements and access needs. Individual users may opt for single-user licenses, while businesses requiring broader access may choose multi-user or enterprise licenses for cost-effective access to the report.
13. Are there any additional resources or data provided in the Explosive Ordnance Disposal Industry report?
While the report offers comprehensive insights, it's advisable to review the specific contents or supplementary materials provided to ascertain if additional resources or data are available.
14. How can I stay updated on further developments or reports in the Explosive Ordnance Disposal Industry?
To stay informed about further developments, trends, and reports in the Explosive Ordnance Disposal Industry, consider subscribing to industry newsletters, following relevant companies and organizations, or regularly checking reputable industry news sources and publications.
Methodology
Step 1 - Identification of Relevant Samples Size from Population Database


Step 2 - Approaches for Defining Global Market Size (Value, Volume* & Price*)

Note*: In applicable scenarios
Step 3 - Data Sources
Primary Research
- Web Analytics
- Survey Reports
- Research Institute
- Latest Research Reports
- Opinion Leaders
Secondary Research
- Annual Reports
- White Paper
- Latest Press Release
- Industry Association
- Paid Database
- Investor Presentations

Step 4 - Data Triangulation
Involves using different sources of information in order to increase the validity of a study
These sources are likely to be stakeholders in a program - participants, other researchers, program staff, other community members, and so on.
Then we put all data in single framework & apply various statistical tools to find out the dynamic on the market.
During the analysis stage, feedback from the stakeholder groups would be compared to determine areas of agreement as well as areas of divergence
