

Key Insights
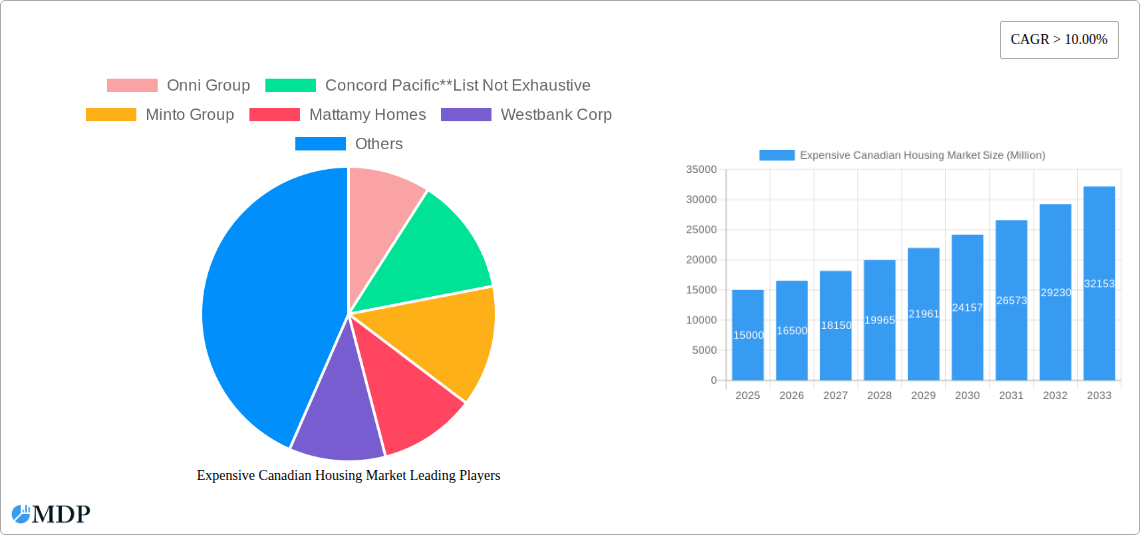
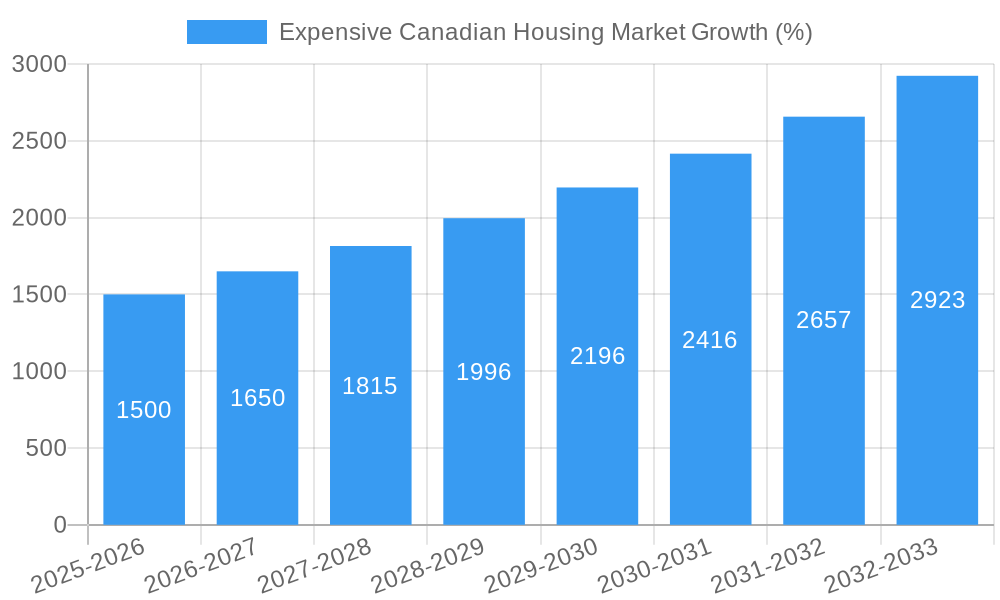
The Canadian luxury housing market, encompassing high-end apartments, condominiums, villas, and landed houses, is experiencing robust growth, with a Compound Annual Growth Rate (CAGR) exceeding 10% from 2025 to 2033. This expansion is driven by several factors, including a strong influx of high-net-worth individuals, both domestic and international, attracted by Canada's stable political and economic environment, high quality of life, and robust immigration policies. Furthermore, limited land availability in major metropolitan areas like Toronto, Vancouver, and Montreal, coupled with increasing demand, fuels escalating prices in the luxury segment. Despite potential economic headwinds, the sustained demand for premium properties suggests a resilient market outlook. Developers like Onni Group, Concord Pacific, Minto Group, and Mattamy Homes are key players capitalizing on this trend, shaping the landscape of luxury real estate across the nation. While increases in interest rates might slightly temper growth in the short term, the long-term forecast remains positive, propelled by the underlying factors driving this market segment.
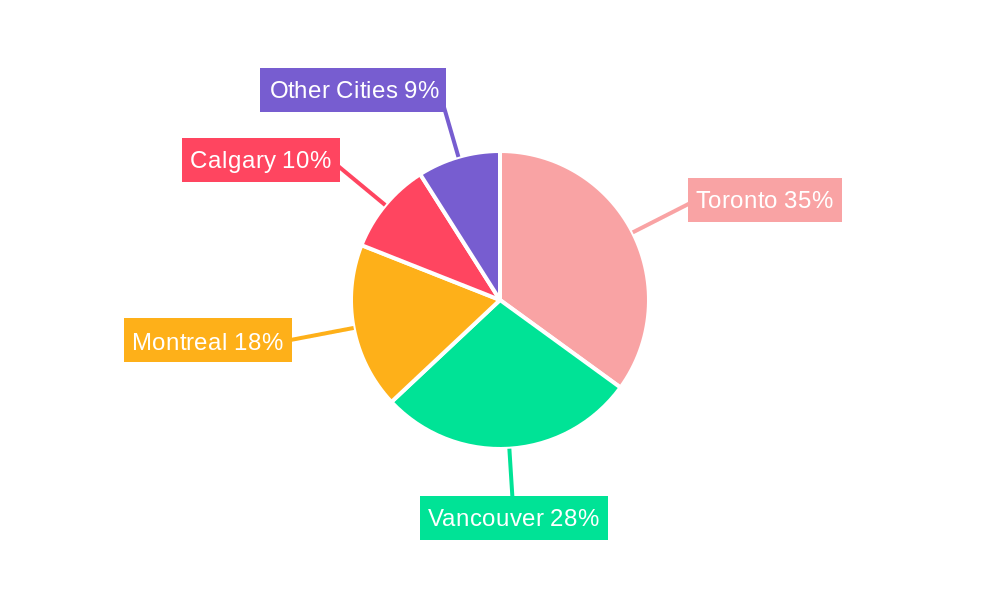
The segmentation reveals significant variations across cities. Toronto, Montreal, and Vancouver consistently dominate the market due to their established economies and cosmopolitan lifestyles. Calgary contributes significantly, but other Canadian cities present a noteworthy yet smaller segment of the overall luxury housing market. The "Other Cities" segment, while less prominent, holds potential for growth as urban centers expand and attract affluent residents. The data indicates a strong focus on apartments and condominiums within the luxury segment, particularly in urban cores, while villas and landed houses are more prominent in suburban areas and other regions. Future projections must account for shifting demographics, evolving preferences for luxury living, and government policies impacting the housing market.
Unlocking the Secrets of Canada's Expensive Housing Market: A Comprehensive 2019-2033 Forecast
This in-depth report provides a comprehensive analysis of Canada's high-value housing market, offering invaluable insights for investors, developers, and industry stakeholders navigating this dynamic landscape. Covering the period from 2019 to 2033, with a focus on 2025, this report dissects market dynamics, identifies key trends, and projects future growth potential. We examine leading players like Onni Group, Concord Pacific, Minto Group, Mattamy Homes, Westbank Corp, The Daniels Corporation, Valencia Residential, Amacon, Brookfield Residential, and Oxford Properties Group, offering a granular view of the competitive landscape.
Expensive Canadian Housing Market Market Dynamics & Concentration
This section analyzes the Canadian luxury housing market's competitive intensity, innovation drivers, and regulatory influences. We examine market share distribution among key players (e.g., Onni Group capturing an estimated xx% market share in Vancouver in 2025), evaluating the impact of mergers and acquisitions (M&A) activity. The historical period (2019-2024) reveals xx M&A deals, with a projected increase to xx deals during the forecast period (2025-2033). Regulatory frameworks, including zoning laws and building codes, significantly impact market development. The report further analyzes consumer preferences for specific property types (apartments, condos, villas, landed houses) and the influence of substitute products (e.g., rental markets).
- Market Concentration: Analysis of market share held by top 10 players in key cities.
- Innovation Drivers: Examination of sustainable building practices, smart home technologies, and design innovations.
- Regulatory Frameworks: Assessment of zoning regulations, building codes, and environmental policies.
- Product Substitutes: Evaluation of rental markets and alternative housing options.
- End-User Trends: Analysis of shifting demographics, lifestyle preferences, and investment strategies.
- M&A Activities: Review of past and projected M&A activity, identifying key drivers and implications.
Expensive Canadian Housing Market Industry Trends & Analysis
This section delves into the key factors driving growth and transformation within Canada's luxury housing market. We analyze the Compound Annual Growth Rate (CAGR) for the forecast period (2025-2033), projected at xx%, driven by factors such as increasing disposable incomes, urbanization, and government policies. We examine market penetration rates for different property types in major cities. The competitive landscape is characterized by intense rivalry among established players and the emergence of new entrants. Technological disruptions, particularly in construction methods and property management, are also scrutinized. Consumer preferences are analyzed, highlighting the demand for sustainable, technologically advanced, and luxury-amenity-rich properties.
Leading Markets & Segments in Expensive Canadian Housing Market
This section identifies the leading cities and property types within the expensive Canadian housing market. Vancouver, Toronto, and Montreal consistently rank as the most dominant markets, fueled by robust economic activity, immigration, and strong investor interest.
- By Cities:
- Toronto: Key drivers include strong job growth, robust infrastructure, and high demand.
- Montreal: Factors influencing its position include relatively lower prices compared to Toronto and Vancouver, and a growing economy.
- Vancouver: High demand, limited supply, and scenic views drive its leading position.
- Calgary: Oil industry fluctuations impact growth, but its market remains significant.
- Other Cities: Emerging luxury housing markets in secondary cities are analyzed.
- By Type:
- Apartments and Condominiums: High demand in urban centers due to convenience and lifestyle.
- Villas and Landed Houses: Growing demand for larger properties in suburban and rural areas.
Detailed analysis of market dominance is provided for each segment, considering economic policies, infrastructure developments, and regional variations.
Expensive Canadian Housing Market Product Developments
The Canadian luxury housing market is witnessing significant product innovation, driven by technological advancements and evolving consumer preferences. Smart home technology integration, sustainable building materials, and unique design features are shaping the landscape. Companies are focusing on creating energy-efficient, technologically advanced, and aesthetically appealing properties to cater to discerning buyers. This leads to enhanced value propositions and competitive advantages.
Key Drivers of Expensive Canadian Housing Market Growth
Several factors fuel the growth of the expensive Canadian housing market. These include robust economic conditions, strong population growth (driven by immigration), favorable government policies encouraging housing construction, and low-interest rates (historically). Technological advancements such as prefabricated construction and 3D printing are also expected to boost efficiency and affordability.
Challenges in the Expensive Canadian Housing Market Market
The market faces challenges such as high construction costs, land scarcity in major cities, stringent building regulations, and supply chain disruptions. These factors contribute to increased housing prices and limit market expansion. The increasing cost of building materials and labour are causing delays and impacting profit margins for developers. Regulatory hurdles, including environmental impact assessments, can also prolong project timelines.
Emerging Opportunities in Expensive Canadian Housing Market
Opportunities exist in sustainable development, smart home technologies, and strategic partnerships with technology providers to develop innovative and efficient building solutions. Expanding into secondary markets with high growth potential, and focusing on building luxury rental properties, also offer attractive investment opportunities.
Leading Players in the Expensive Canadian Housing Market Sector
- Onni Group
- Concord Pacific
- Minto Group
- Mattamy Homes
- Westbank Corp
- The Daniels Corporation
- Valencia Residential
- Amacon
- Brookfield Residential
- Oxford Properties Group
Key Milestones in Expensive Canadian Housing Market Industry
- 2020-03: Implementation of new building codes impacting construction costs.
- 2021-10: Launch of a major luxury condominium development in downtown Toronto.
- 2022-05: Merger between two leading developers resulting in increased market share.
- 2023-08: Introduction of innovative sustainable building technology by a major player.
- 2024-12: Government incentives for green building initiatives.
Strategic Outlook for Expensive Canadian Housing Market Market
The Canadian luxury housing market is projected to maintain steady growth over the forecast period, driven by sustained economic growth and ongoing demand for high-end properties. Strategic opportunities exist in focusing on sustainable development, embracing technological advancements, and targeting specific niche markets to maximize returns and achieve long-term success. The potential for growth in secondary markets also presents a compelling opportunity for investors and developers.
Expensive Canadian Housing Market Segmentation
-
1. Type
- 1.1. Apartments and Condominiums
- 1.2. Villas and Landed Houses
-
2. Cities
- 2.1. Toronto
- 2.2. Montreal
- 2.3. Vancouver
- 2.4. Calgary
- 2.5. Other Cities
Expensive Canadian Housing Market Segmentation By Geography
-
1. North America
- 1.1. United States
- 1.2. Canada
- 1.3. Mexico
-
2. South America
- 2.1. Brazil
- 2.2. Argentina
- 2.3. Rest of South America
-
3. Europe
- 3.1. United Kingdom
- 3.2. Germany
- 3.3. France
- 3.4. Italy
- 3.5. Spain
- 3.6. Russia
- 3.7. Benelux
- 3.8. Nordics
- 3.9. Rest of Europe
-
4. Middle East & Africa
- 4.1. Turkey
- 4.2. Israel
- 4.3. GCC
- 4.4. North Africa
- 4.5. South Africa
- 4.6. Rest of Middle East & Africa
-
5. Asia Pacific
- 5.1. China
- 5.2. India
- 5.3. Japan
- 5.4. South Korea
- 5.5. ASEAN
- 5.6. Oceania
- 5.7. Rest of Asia Pacific
Expensive Canadian Housing Market REPORT HIGHLIGHTS
| Aspects | Details |
|---|---|
| Study Period | 2019-2033 |
| Base Year | 2024 |
| Estimated Year | 2025 |
| Forecast Period | 2025-2033 |
| Historical Period | 2019-2024 |
| Growth Rate | CAGR of > 10.00% from 2019-2033 |
| Segmentation |
|
Table of Contents
- 1. Introduction
- 1.1. Research Scope
- 1.2. Market Segmentation
- 1.3. Research Methodology
- 1.4. Definitions and Assumptions
- 2. Executive Summary
- 2.1. Introduction
- 3. Market Dynamics
- 3.1. Introduction
- 3.2. Market Drivers
- 3.2.1. Increasing Adoption of Remote and Hybrid Work Model
- 3.3. Market Restrains
- 3.3.1. Lack of Privacy
- 3.4. Market Trends
- 3.4.1. Pandemic Accelerated Luxury Home Sales in Major Canadian Markets
- 4. Market Factor Analysis
- 4.1. Porters Five Forces
- 4.2. Supply/Value Chain
- 4.3. PESTEL analysis
- 4.4. Market Entropy
- 4.5. Patent/Trademark Analysis
- 5. Global Expensive Canadian Housing Market Analysis, Insights and Forecast, 2019-2031
- 5.1. Market Analysis, Insights and Forecast - by Type
- 5.1.1. Apartments and Condominiums
- 5.1.2. Villas and Landed Houses
- 5.2. Market Analysis, Insights and Forecast - by Cities
- 5.2.1. Toronto
- 5.2.2. Montreal
- 5.2.3. Vancouver
- 5.2.4. Calgary
- 5.2.5. Other Cities
- 5.3. Market Analysis, Insights and Forecast - by Region
- 5.3.1. North America
- 5.3.2. South America
- 5.3.3. Europe
- 5.3.4. Middle East & Africa
- 5.3.5. Asia Pacific
- 5.1. Market Analysis, Insights and Forecast - by Type
- 6. North America Expensive Canadian Housing Market Analysis, Insights and Forecast, 2019-2031
- 6.1. Market Analysis, Insights and Forecast - by Type
- 6.1.1. Apartments and Condominiums
- 6.1.2. Villas and Landed Houses
- 6.2. Market Analysis, Insights and Forecast - by Cities
- 6.2.1. Toronto
- 6.2.2. Montreal
- 6.2.3. Vancouver
- 6.2.4. Calgary
- 6.2.5. Other Cities
- 6.1. Market Analysis, Insights and Forecast - by Type
- 7. South America Expensive Canadian Housing Market Analysis, Insights and Forecast, 2019-2031
- 7.1. Market Analysis, Insights and Forecast - by Type
- 7.1.1. Apartments and Condominiums
- 7.1.2. Villas and Landed Houses
- 7.2. Market Analysis, Insights and Forecast - by Cities
- 7.2.1. Toronto
- 7.2.2. Montreal
- 7.2.3. Vancouver
- 7.2.4. Calgary
- 7.2.5. Other Cities
- 7.1. Market Analysis, Insights and Forecast - by Type
- 8. Europe Expensive Canadian Housing Market Analysis, Insights and Forecast, 2019-2031
- 8.1. Market Analysis, Insights and Forecast - by Type
- 8.1.1. Apartments and Condominiums
- 8.1.2. Villas and Landed Houses
- 8.2. Market Analysis, Insights and Forecast - by Cities
- 8.2.1. Toronto
- 8.2.2. Montreal
- 8.2.3. Vancouver
- 8.2.4. Calgary
- 8.2.5. Other Cities
- 8.1. Market Analysis, Insights and Forecast - by Type
- 9. Middle East & Africa Expensive Canadian Housing Market Analysis, Insights and Forecast, 2019-2031
- 9.1. Market Analysis, Insights and Forecast - by Type
- 9.1.1. Apartments and Condominiums
- 9.1.2. Villas and Landed Houses
- 9.2. Market Analysis, Insights and Forecast - by Cities
- 9.2.1. Toronto
- 9.2.2. Montreal
- 9.2.3. Vancouver
- 9.2.4. Calgary
- 9.2.5. Other Cities
- 9.1. Market Analysis, Insights and Forecast - by Type
- 10. Asia Pacific Expensive Canadian Housing Market Analysis, Insights and Forecast, 2019-2031
- 10.1. Market Analysis, Insights and Forecast - by Type
- 10.1.1. Apartments and Condominiums
- 10.1.2. Villas and Landed Houses
- 10.2. Market Analysis, Insights and Forecast - by Cities
- 10.2.1. Toronto
- 10.2.2. Montreal
- 10.2.3. Vancouver
- 10.2.4. Calgary
- 10.2.5. Other Cities
- 10.1. Market Analysis, Insights and Forecast - by Type
- 11. Dubai Expensive Canadian Housing Market Analysis, Insights and Forecast, 2019-2031
- 11.1. Market Analysis, Insights and Forecast - By Country/Sub-region
- 11.1.1.
- 12. Abu Dhabi Expensive Canadian Housing Market Analysis, Insights and Forecast, 2019-2031
- 12.1. Market Analysis, Insights and Forecast - By Country/Sub-region
- 12.1.1.
- 13. Sharjah Expensive Canadian Housing Market Analysis, Insights and Forecast, 2019-2031
- 13.1. Market Analysis, Insights and Forecast - By Country/Sub-region
- 13.1.1.
- 14. Other Cities Expensive Canadian Housing Market Analysis, Insights and Forecast, 2019-2031
- 14.1. Market Analysis, Insights and Forecast - By Country/Sub-region
- 14.1.1.
- 15. Competitive Analysis
- 15.1. Global Market Share Analysis 2024
- 15.2. Company Profiles
- 15.2.1 Onni Group
- 15.2.1.1. Overview
- 15.2.1.2. Products
- 15.2.1.3. SWOT Analysis
- 15.2.1.4. Recent Developments
- 15.2.1.5. Financials (Based on Availability)
- 15.2.2 Concord Pacific**List Not Exhaustive
- 15.2.2.1. Overview
- 15.2.2.2. Products
- 15.2.2.3. SWOT Analysis
- 15.2.2.4. Recent Developments
- 15.2.2.5. Financials (Based on Availability)
- 15.2.3 Minto Group
- 15.2.3.1. Overview
- 15.2.3.2. Products
- 15.2.3.3. SWOT Analysis
- 15.2.3.4. Recent Developments
- 15.2.3.5. Financials (Based on Availability)
- 15.2.4 Mattamy Homes
- 15.2.4.1. Overview
- 15.2.4.2. Products
- 15.2.4.3. SWOT Analysis
- 15.2.4.4. Recent Developments
- 15.2.4.5. Financials (Based on Availability)
- 15.2.5 Westbank Corp
- 15.2.5.1. Overview
- 15.2.5.2. Products
- 15.2.5.3. SWOT Analysis
- 15.2.5.4. Recent Developments
- 15.2.5.5. Financials (Based on Availability)
- 15.2.6 The Daniels Corporation
- 15.2.6.1. Overview
- 15.2.6.2. Products
- 15.2.6.3. SWOT Analysis
- 15.2.6.4. Recent Developments
- 15.2.6.5. Financials (Based on Availability)
- 15.2.7 Valencia Residential
- 15.2.7.1. Overview
- 15.2.7.2. Products
- 15.2.7.3. SWOT Analysis
- 15.2.7.4. Recent Developments
- 15.2.7.5. Financials (Based on Availability)
- 15.2.8 Amacon
- 15.2.8.1. Overview
- 15.2.8.2. Products
- 15.2.8.3. SWOT Analysis
- 15.2.8.4. Recent Developments
- 15.2.8.5. Financials (Based on Availability)
- 15.2.9 Brookfield Residential
- 15.2.9.1. Overview
- 15.2.9.2. Products
- 15.2.9.3. SWOT Analysis
- 15.2.9.4. Recent Developments
- 15.2.9.5. Financials (Based on Availability)
- 15.2.10 Oxford Properties Group
- 15.2.10.1. Overview
- 15.2.10.2. Products
- 15.2.10.3. SWOT Analysis
- 15.2.10.4. Recent Developments
- 15.2.10.5. Financials (Based on Availability)
- 15.2.1 Onni Group
List of Figures
- Figure 1: Global Expensive Canadian Housing Market Revenue Breakdown (Million, %) by Region 2024 & 2032
- Figure 2: Dubai Expensive Canadian Housing Market Revenue (Million), by Country 2024 & 2032
- Figure 3: Dubai Expensive Canadian Housing Market Revenue Share (%), by Country 2024 & 2032
- Figure 4: Abu Dhabi Expensive Canadian Housing Market Revenue (Million), by Country 2024 & 2032
- Figure 5: Abu Dhabi Expensive Canadian Housing Market Revenue Share (%), by Country 2024 & 2032
- Figure 6: Sharjah Expensive Canadian Housing Market Revenue (Million), by Country 2024 & 2032
- Figure 7: Sharjah Expensive Canadian Housing Market Revenue Share (%), by Country 2024 & 2032
- Figure 8: Other Cities Expensive Canadian Housing Market Revenue (Million), by Country 2024 & 2032
- Figure 9: Other Cities Expensive Canadian Housing Market Revenue Share (%), by Country 2024 & 2032
- Figure 10: North America Expensive Canadian Housing Market Revenue (Million), by Type 2024 & 2032
- Figure 11: North America Expensive Canadian Housing Market Revenue Share (%), by Type 2024 & 2032
- Figure 12: North America Expensive Canadian Housing Market Revenue (Million), by Cities 2024 & 2032
- Figure 13: North America Expensive Canadian Housing Market Revenue Share (%), by Cities 2024 & 2032
- Figure 14: North America Expensive Canadian Housing Market Revenue (Million), by Country 2024 & 2032
- Figure 15: North America Expensive Canadian Housing Market Revenue Share (%), by Country 2024 & 2032
- Figure 16: South America Expensive Canadian Housing Market Revenue (Million), by Type 2024 & 2032
- Figure 17: South America Expensive Canadian Housing Market Revenue Share (%), by Type 2024 & 2032
- Figure 18: South America Expensive Canadian Housing Market Revenue (Million), by Cities 2024 & 2032
- Figure 19: South America Expensive Canadian Housing Market Revenue Share (%), by Cities 2024 & 2032
- Figure 20: South America Expensive Canadian Housing Market Revenue (Million), by Country 2024 & 2032
- Figure 21: South America Expensive Canadian Housing Market Revenue Share (%), by Country 2024 & 2032
- Figure 22: Europe Expensive Canadian Housing Market Revenue (Million), by Type 2024 & 2032
- Figure 23: Europe Expensive Canadian Housing Market Revenue Share (%), by Type 2024 & 2032
- Figure 24: Europe Expensive Canadian Housing Market Revenue (Million), by Cities 2024 & 2032
- Figure 25: Europe Expensive Canadian Housing Market Revenue Share (%), by Cities 2024 & 2032
- Figure 26: Europe Expensive Canadian Housing Market Revenue (Million), by Country 2024 & 2032
- Figure 27: Europe Expensive Canadian Housing Market Revenue Share (%), by Country 2024 & 2032
- Figure 28: Middle East & Africa Expensive Canadian Housing Market Revenue (Million), by Type 2024 & 2032
- Figure 29: Middle East & Africa Expensive Canadian Housing Market Revenue Share (%), by Type 2024 & 2032
- Figure 30: Middle East & Africa Expensive Canadian Housing Market Revenue (Million), by Cities 2024 & 2032
- Figure 31: Middle East & Africa Expensive Canadian Housing Market Revenue Share (%), by Cities 2024 & 2032
- Figure 32: Middle East & Africa Expensive Canadian Housing Market Revenue (Million), by Country 2024 & 2032
- Figure 33: Middle East & Africa Expensive Canadian Housing Market Revenue Share (%), by Country 2024 & 2032
- Figure 34: Asia Pacific Expensive Canadian Housing Market Revenue (Million), by Type 2024 & 2032
- Figure 35: Asia Pacific Expensive Canadian Housing Market Revenue Share (%), by Type 2024 & 2032
- Figure 36: Asia Pacific Expensive Canadian Housing Market Revenue (Million), by Cities 2024 & 2032
- Figure 37: Asia Pacific Expensive Canadian Housing Market Revenue Share (%), by Cities 2024 & 2032
- Figure 38: Asia Pacific Expensive Canadian Housing Market Revenue (Million), by Country 2024 & 2032
- Figure 39: Asia Pacific Expensive Canadian Housing Market Revenue Share (%), by Country 2024 & 2032
List of Tables
- Table 1: Global Expensive Canadian Housing Market Revenue Million Forecast, by Region 2019 & 2032
- Table 2: Global Expensive Canadian Housing Market Revenue Million Forecast, by Type 2019 & 2032
- Table 3: Global Expensive Canadian Housing Market Revenue Million Forecast, by Cities 2019 & 2032
- Table 4: Global Expensive Canadian Housing Market Revenue Million Forecast, by Region 2019 & 2032
- Table 5: Global Expensive Canadian Housing Market Revenue Million Forecast, by Country 2019 & 2032
- Table 6: Expensive Canadian Housing Market Revenue (Million) Forecast, by Application 2019 & 2032
- Table 7: Global Expensive Canadian Housing Market Revenue Million Forecast, by Country 2019 & 2032
- Table 8: Expensive Canadian Housing Market Revenue (Million) Forecast, by Application 2019 & 2032
- Table 9: Global Expensive Canadian Housing Market Revenue Million Forecast, by Country 2019 & 2032
- Table 10: Expensive Canadian Housing Market Revenue (Million) Forecast, by Application 2019 & 2032
- Table 11: Global Expensive Canadian Housing Market Revenue Million Forecast, by Country 2019 & 2032
- Table 12: Expensive Canadian Housing Market Revenue (Million) Forecast, by Application 2019 & 2032
- Table 13: Global Expensive Canadian Housing Market Revenue Million Forecast, by Type 2019 & 2032
- Table 14: Global Expensive Canadian Housing Market Revenue Million Forecast, by Cities 2019 & 2032
- Table 15: Global Expensive Canadian Housing Market Revenue Million Forecast, by Country 2019 & 2032
- Table 16: United States Expensive Canadian Housing Market Revenue (Million) Forecast, by Application 2019 & 2032
- Table 17: Canada Expensive Canadian Housing Market Revenue (Million) Forecast, by Application 2019 & 2032
- Table 18: Mexico Expensive Canadian Housing Market Revenue (Million) Forecast, by Application 2019 & 2032
- Table 19: Global Expensive Canadian Housing Market Revenue Million Forecast, by Type 2019 & 2032
- Table 20: Global Expensive Canadian Housing Market Revenue Million Forecast, by Cities 2019 & 2032
- Table 21: Global Expensive Canadian Housing Market Revenue Million Forecast, by Country 2019 & 2032
- Table 22: Brazil Expensive Canadian Housing Market Revenue (Million) Forecast, by Application 2019 & 2032
- Table 23: Argentina Expensive Canadian Housing Market Revenue (Million) Forecast, by Application 2019 & 2032
- Table 24: Rest of South America Expensive Canadian Housing Market Revenue (Million) Forecast, by Application 2019 & 2032
- Table 25: Global Expensive Canadian Housing Market Revenue Million Forecast, by Type 2019 & 2032
- Table 26: Global Expensive Canadian Housing Market Revenue Million Forecast, by Cities 2019 & 2032
- Table 27: Global Expensive Canadian Housing Market Revenue Million Forecast, by Country 2019 & 2032
- Table 28: United Kingdom Expensive Canadian Housing Market Revenue (Million) Forecast, by Application 2019 & 2032
- Table 29: Germany Expensive Canadian Housing Market Revenue (Million) Forecast, by Application 2019 & 2032
- Table 30: France Expensive Canadian Housing Market Revenue (Million) Forecast, by Application 2019 & 2032
- Table 31: Italy Expensive Canadian Housing Market Revenue (Million) Forecast, by Application 2019 & 2032
- Table 32: Spain Expensive Canadian Housing Market Revenue (Million) Forecast, by Application 2019 & 2032
- Table 33: Russia Expensive Canadian Housing Market Revenue (Million) Forecast, by Application 2019 & 2032
- Table 34: Benelux Expensive Canadian Housing Market Revenue (Million) Forecast, by Application 2019 & 2032
- Table 35: Nordics Expensive Canadian Housing Market Revenue (Million) Forecast, by Application 2019 & 2032
- Table 36: Rest of Europe Expensive Canadian Housing Market Revenue (Million) Forecast, by Application 2019 & 2032
- Table 37: Global Expensive Canadian Housing Market Revenue Million Forecast, by Type 2019 & 2032
- Table 38: Global Expensive Canadian Housing Market Revenue Million Forecast, by Cities 2019 & 2032
- Table 39: Global Expensive Canadian Housing Market Revenue Million Forecast, by Country 2019 & 2032
- Table 40: Turkey Expensive Canadian Housing Market Revenue (Million) Forecast, by Application 2019 & 2032
- Table 41: Israel Expensive Canadian Housing Market Revenue (Million) Forecast, by Application 2019 & 2032
- Table 42: GCC Expensive Canadian Housing Market Revenue (Million) Forecast, by Application 2019 & 2032
- Table 43: North Africa Expensive Canadian Housing Market Revenue (Million) Forecast, by Application 2019 & 2032
- Table 44: South Africa Expensive Canadian Housing Market Revenue (Million) Forecast, by Application 2019 & 2032
- Table 45: Rest of Middle East & Africa Expensive Canadian Housing Market Revenue (Million) Forecast, by Application 2019 & 2032
- Table 46: Global Expensive Canadian Housing Market Revenue Million Forecast, by Type 2019 & 2032
- Table 47: Global Expensive Canadian Housing Market Revenue Million Forecast, by Cities 2019 & 2032
- Table 48: Global Expensive Canadian Housing Market Revenue Million Forecast, by Country 2019 & 2032
- Table 49: China Expensive Canadian Housing Market Revenue (Million) Forecast, by Application 2019 & 2032
- Table 50: India Expensive Canadian Housing Market Revenue (Million) Forecast, by Application 2019 & 2032
- Table 51: Japan Expensive Canadian Housing Market Revenue (Million) Forecast, by Application 2019 & 2032
- Table 52: South Korea Expensive Canadian Housing Market Revenue (Million) Forecast, by Application 2019 & 2032
- Table 53: ASEAN Expensive Canadian Housing Market Revenue (Million) Forecast, by Application 2019 & 2032
- Table 54: Oceania Expensive Canadian Housing Market Revenue (Million) Forecast, by Application 2019 & 2032
- Table 55: Rest of Asia Pacific Expensive Canadian Housing Market Revenue (Million) Forecast, by Application 2019 & 2032
Frequently Asked Questions
1. What is the projected Compound Annual Growth Rate (CAGR) of the Expensive Canadian Housing Market?
The projected CAGR is approximately > 10.00%.
2. Which companies are prominent players in the Expensive Canadian Housing Market?
Key companies in the market include Onni Group, Concord Pacific**List Not Exhaustive, Minto Group, Mattamy Homes, Westbank Corp, The Daniels Corporation, Valencia Residential, Amacon, Brookfield Residential, Oxford Properties Group.
3. What are the main segments of the Expensive Canadian Housing Market?
The market segments include Type, Cities.
4. Can you provide details about the market size?
The market size is estimated to be USD XX Million as of 2022.
5. What are some drivers contributing to market growth?
Increasing Adoption of Remote and Hybrid Work Model.
6. What are the notable trends driving market growth?
Pandemic Accelerated Luxury Home Sales in Major Canadian Markets.
7. Are there any restraints impacting market growth?
Lack of Privacy.
8. Can you provide examples of recent developments in the market?
N/A
9. What pricing options are available for accessing the report?
Pricing options include single-user, multi-user, and enterprise licenses priced at USD 3800, USD 4500, and USD 5800 respectively.
10. Is the market size provided in terms of value or volume?
The market size is provided in terms of value, measured in Million.
11. Are there any specific market keywords associated with the report?
Yes, the market keyword associated with the report is "Expensive Canadian Housing Market," which aids in identifying and referencing the specific market segment covered.
12. How do I determine which pricing option suits my needs best?
The pricing options vary based on user requirements and access needs. Individual users may opt for single-user licenses, while businesses requiring broader access may choose multi-user or enterprise licenses for cost-effective access to the report.
13. Are there any additional resources or data provided in the Expensive Canadian Housing Market report?
While the report offers comprehensive insights, it's advisable to review the specific contents or supplementary materials provided to ascertain if additional resources or data are available.
14. How can I stay updated on further developments or reports in the Expensive Canadian Housing Market?
To stay informed about further developments, trends, and reports in the Expensive Canadian Housing Market, consider subscribing to industry newsletters, following relevant companies and organizations, or regularly checking reputable industry news sources and publications.
Methodology
Step 1 - Identification of Relevant Samples Size from Population Database


Step 2 - Approaches for Defining Global Market Size (Value, Volume* & Price*)

Note*: In applicable scenarios
Step 3 - Data Sources
Primary Research
- Web Analytics
- Survey Reports
- Research Institute
- Latest Research Reports
- Opinion Leaders
Secondary Research
- Annual Reports
- White Paper
- Latest Press Release
- Industry Association
- Paid Database
- Investor Presentations

Step 4 - Data Triangulation
Involves using different sources of information in order to increase the validity of a study
These sources are likely to be stakeholders in a program - participants, other researchers, program staff, other community members, and so on.
Then we put all data in single framework & apply various statistical tools to find out the dynamic on the market.
During the analysis stage, feedback from the stakeholder groups would be compared to determine areas of agreement as well as areas of divergence
