

Key Insights
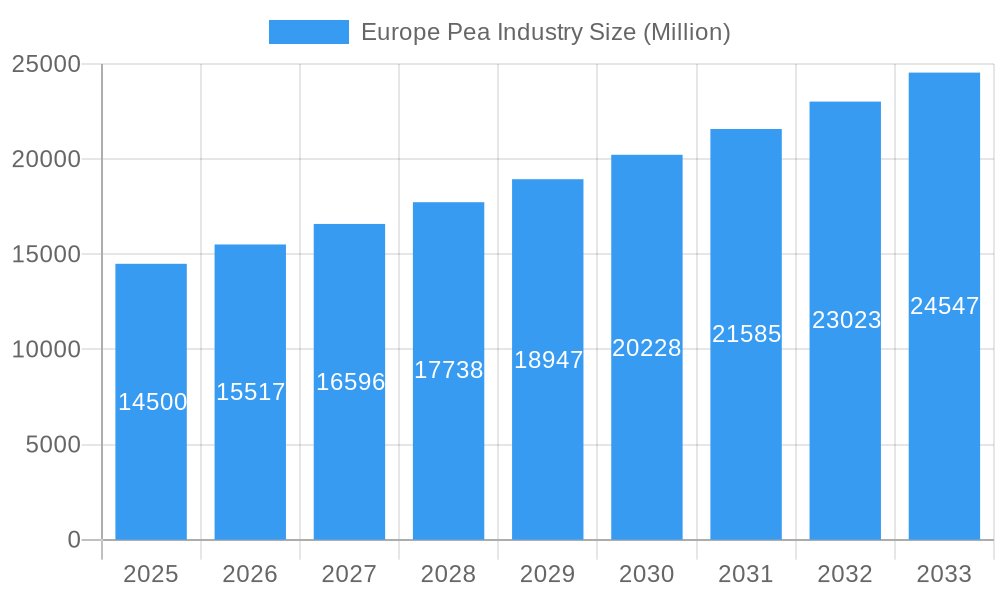
The European pea industry, valued at €14.5 billion in 2025, is projected to experience robust growth, driven by increasing consumer demand for plant-based proteins and the rising popularity of pea-based foods and ingredients. This surge is fueled by several factors, including the growing awareness of health benefits associated with pea consumption, the increasing prevalence of vegetarian and vegan diets, and the growing demand for sustainable and ethically sourced food products. The industry benefits from a diversified product portfolio ranging from whole peas for direct consumption to processed pea protein isolates and flours used extensively in food manufacturing, animal feed, and other applications. Key players such as Sensus, Tereos, Lantmännen, AGRANA, and Roquette are driving innovation, expanding their product lines, and investing in research and development to meet this growing demand. Competition is expected to remain intense, with companies focusing on product differentiation, supply chain optimization, and strategic partnerships to secure their market position. Regional variations exist, with Germany, France, and the UK representing significant markets due to high consumption and robust processing capacities. While challenges such as fluctuating crop yields and price volatility remain, the overall outlook for the European pea industry remains positive, with a projected Compound Annual Growth Rate (CAGR) of 6.88% from 2025 to 2033.
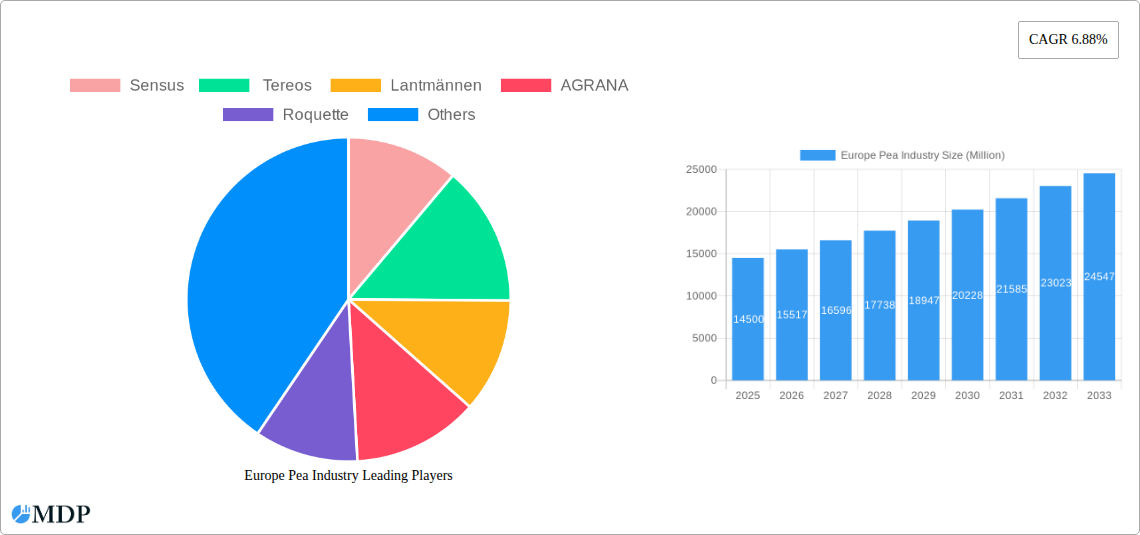
Europe Pea Industry Market Size (In Billion)
The growth trajectory is expected to be influenced by factors such as government support for sustainable agriculture, technological advancements in pea processing, and increasing investments in research and development to improve pea protein extraction efficiency. Furthermore, the industry is likely to see consolidation through mergers and acquisitions as larger companies seek to expand their market share and strengthen their supply chains. The geographical distribution of production and consumption will continue to shape market dynamics, with countries like France and Germany expected to remain leading producers and consumers. However, other European nations are anticipated to witness significant growth due to increased domestic consumption and the expansion of the plant-based food market. The forecast period will likely see further diversification in the applications of pea-based products, leading to new market opportunities and driving further industry expansion.
Europe Pea Industry Company Market Share
Europe Pea Industry: A Comprehensive Market Report (2019-2033)
This comprehensive report provides a detailed analysis of the European pea industry, encompassing market dynamics, leading players, key trends, and future growth prospects. With a study period spanning 2019-2033, a base year of 2025, and a forecast period of 2025-2033, this report offers actionable insights for industry stakeholders, investors, and businesses operating within the European pea market. The report utilizes data from the historical period (2019-2024) and offers detailed analysis of key segments, including Russia, Ukraine, France, Spain, Netherlands, and the Rest of Europe. Expect in-depth analysis of production volumes (in Millions of tons), price trends, and market share data, offering a clear understanding of this dynamic market.
Europe Pea Industry Market Dynamics & Concentration
The European pea industry exhibits a moderately concentrated market structure, with several key players holding significant market share. Market concentration is influenced by factors such as economies of scale in production, access to advanced processing technologies, and strong distribution networks. Innovation in pea processing technologies, particularly for protein extraction and value-added products, is a significant growth driver. Stringent regulatory frameworks related to food safety and labeling impact market dynamics, along with the presence of substitute products like soy and other pulses. End-user trends towards plant-based diets and increasing demand for sustainable and functional food ingredients significantly influence the market's growth. Mergers and acquisitions (M&A) activity has been moderate in recent years, with a total of xx M&A deals recorded between 2019 and 2024, leading to a xx% increase in market concentration. Key players like Roquette, AGRANA, and Lantmännen have consistently expanded their market share through both organic growth and strategic acquisitions. The average market share of the top 5 players is estimated to be xx% in 2025.
Europe Pea Industry Industry Trends & Analysis
The European pea industry is experiencing robust growth, driven by several key factors. The rising popularity of plant-based diets, fueled by increasing health consciousness and environmental concerns, is a major catalyst. Technological advancements in pea processing, particularly in protein extraction and purification, have led to the development of high-quality pea protein ingredients for various food and beverage applications. Consumer preferences are shifting towards sustainable and ethically sourced products, boosting demand for peas grown with environmentally friendly practices. The competitive landscape is characterized by both established players and new entrants, driving innovation and efficiency improvements. The industry is projected to exhibit a Compound Annual Growth Rate (CAGR) of xx% during the forecast period (2025-2033), with market penetration in key food and beverage segments expected to reach xx% by 2033. This growth is further fueled by increasing demand for pea-based ingredients in various applications such as food, feed, and industrial uses.
Leading Markets & Segments in Europe Pea Industry
Russia: Production Analysis reveals a xx Million ton output in 2024, impacted by xx factors. Price Trend Analysis indicates an average price of xx EUR/ton in 2024.
Ukraine: The Ukrainian pea market experienced significant disruptions in 2022 due to geopolitical factors. Production is estimated at xx Million tons in 2024, with an average price of xx EUR/ton.
France: France is a major producer and consumer of peas in Europe, benefiting from favorable climate conditions and established agricultural practices. Production in 2024 was xx Million tons with an average price of xx EUR/ton.
Spain: The Spanish pea market is characterized by a strong focus on processing and value-added products. Production is estimated at xx Million tons in 2024, with a price of xx EUR/ton.
Netherlands: The Netherlands plays a significant role in the European pea market due to its advanced agricultural technologies and efficient logistics infrastructure. 2024 production was at xx Million tons with a price averaging xx EUR/ton.
Rest of Europe: This segment encompasses a diverse range of countries with varying levels of pea production and consumption. The combined production is estimated at xx Million tons in 2024, with a price of xx EUR/ton.
The dominance of specific regions is primarily driven by factors like climatic suitability, government support for agriculture, access to processing facilities, and established supply chains.
Europe Pea Industry Product Developments
Recent product developments have focused on enhancing the functionality and nutritional value of pea-based ingredients. This includes the development of novel pea protein isolates with improved solubility and functionality, as well as the creation of new pea-based ingredients for specific applications, such as pea starch and pea flour. These innovations address market demand for clean-label, sustainable, and nutritious alternatives to traditional ingredients. Technological advancements in pea processing contribute to cost efficiency and improved product quality, driving wider adoption across various industries.
Key Drivers of Europe Pea Industry Growth
The growth of the European pea industry is propelled by several key factors, including the rising global demand for plant-based proteins, the increasing consumer awareness of the health benefits of peas, and the growing adoption of sustainable and ethical sourcing practices. Government regulations promoting sustainable agriculture and support for the development of plant-based alternatives are also key drivers. Technological innovations in processing and extraction techniques continue to enhance efficiency and reduce production costs, further driving growth.
Challenges in the Europe Pea Industry Market
The European pea industry faces challenges including fluctuating raw material prices, seasonal variations in production, and competition from other pulse crops. Supply chain disruptions can significantly impact production and distribution costs. The increasing demand for pea-based products may lead to supply shortages and price volatility, unless production capacity is scaled to meet demand. Moreover, regulatory changes can also impact market operations and profitability.
Emerging Opportunities in Europe Pea Industry
Significant opportunities exist for expansion into new product applications, including functional foods, pet food, and even bioplastics. Strategic partnerships and collaborations among industry players can accelerate innovation and market penetration. The development of novel technologies for pea processing and the exploration of new markets, particularly in developing economies, present significant growth potential. Further investment in research and development is crucial to unlock new applications and improve overall industry competitiveness.
Leading Players in the Europe Pea Industry Sector
Key Milestones in Europe Pea Industry Industry
October 2022: Roquette launched a new line of organic pea ingredients (organic pea starch and organic pea protein) in the European market, expanding the range of plant-based options available to food manufacturers.
September 2022: Lantmännen invested USD 95.7 Million in a new large-scale pea protein production facility in Sweden, signifying a significant commitment to expanding pea protein production capacity in Europe.
May 2022: The phytosanitary protocol signed between China and Russia for peas opens a new export market for Russia and increases global competition for pea exports.
Strategic Outlook for Europe Pea Industry Market
The European pea industry is poised for continued growth, driven by increasing demand for sustainable and plant-based food ingredients. Strategic investments in research and development, along with expansion into new markets and product applications, will further fuel market growth. Collaborations and partnerships within the industry will be crucial for fostering innovation and maximizing the potential of this dynamic sector. The predicted CAGR for the next 8 years indicates significant growth potential and attractive investment opportunities.
Europe Pea Industry Segmentation
-
1. Russia
-
1.1. Production Analysis
- 1.1.1. Consumption Analysis and Market Value
- 1.1.2. Import Market Analysis (Volume and Value)
- 1.1.3. Export Market Analysis (Volume and Value)
- 1.1.4. Price Trend Analysis
- 1.2. Ukraine
- 1.3. France
- 1.4. Spain
- 1.5. Netherlands
- 1.6. Rest of Europe
-
1.1. Production Analysis
-
2. Russia
-
2.1. Production Analysis
- 2.1.1. Consumption Analysis and Market Value
- 2.1.2. Import Market Analysis (Volume and Value)
- 2.1.3. Export Market Analysis (Volume and Value)
- 2.1.4. Price Trend Analysis
- 2.2. Ukraine
- 2.3. France
- 2.4. Spain
- 2.5. Netherlands
- 2.6. Rest of Europe
-
2.1. Production Analysis
Europe Pea Industry Segmentation By Geography
-
1. Europe
- 1.1. United Kingdom
- 1.2. Germany
- 1.3. France
- 1.4. Italy
- 1.5. Spain
- 1.6. Netherlands
- 1.7. Belgium
- 1.8. Sweden
- 1.9. Norway
- 1.10. Poland
- 1.11. Denmark
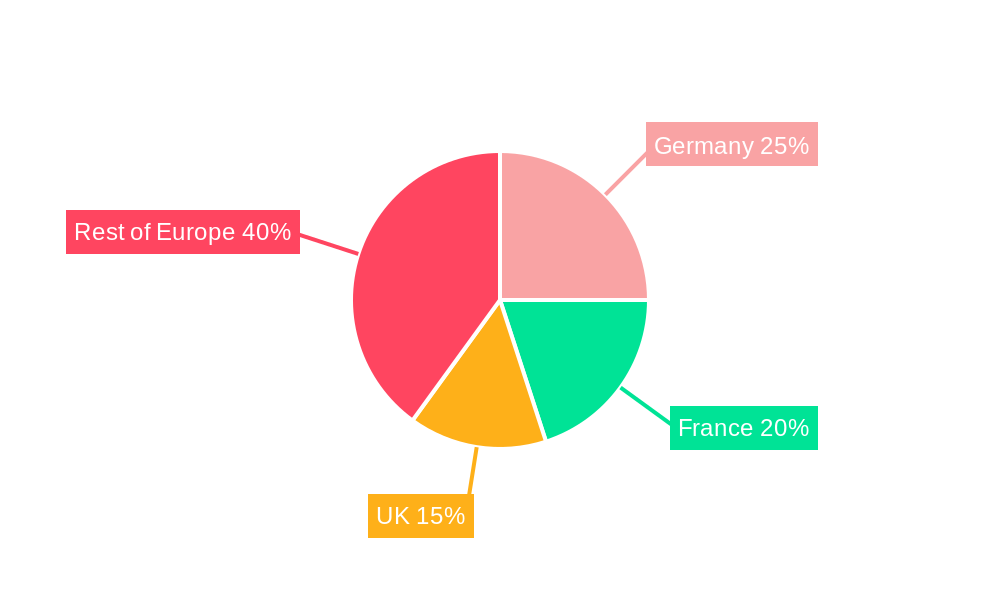
Europe Pea Industry Regional Market Share
Geographic Coverage of Europe Pea Industry
Europe Pea Industry REPORT HIGHLIGHTS
| Aspects | Details |
|---|---|
| Study Period | 2020-2034 |
| Base Year | 2025 |
| Estimated Year | 2026 |
| Forecast Period | 2026-2034 |
| Historical Period | 2020-2025 |
| Growth Rate | CAGR of 6.88% from 2020-2034 |
| Segmentation |
|
Table of Contents
- 1. Introduction
- 1.1. Research Scope
- 1.2. Market Segmentation
- 1.3. Research Objective
- 1.4. Definitions and Assumptions
- 2. Executive Summary
- 2.1. Market Snapshot
- 3. Market Dynamics
- 3.1. Market Drivers
- 3.2. Market Restrains
- 3.3. Market Trends
- 3.4. Market Opportunities
- 4. Market Factor Analysis
- 4.1. Porters Five Forces
- 4.1.1. Bargaining Power of Suppliers
- 4.1.2. Bargaining Power of Buyers
- 4.1.3. Threat of New Entrants
- 4.1.4. Threat of Substitutes
- 4.1.5. Competitive Rivalry
- 4.2. PESTEL analysis
- 4.3. BCG Analysis
- 4.3.1. Stars (High Growth, High Market Share)
- 4.3.2. Cash Cows (Low Growth, High Market Share)
- 4.3.3. Question Mark (High Growth, Low Market Share)
- 4.3.4. Dogs (Low Growth, Low Market Share)
- 4.4. Ansoff Matrix Analysis
- 4.5. Supply Chain Analysis
- 4.6. Regulatory Landscape
- 4.7. Current Market Potential and Opportunity Assessment (TAM–SAM–SOM Framework)
- 4.8. MDP Analyst Note
- 4.1. Porters Five Forces
- 5. Market Analysis, Insights and Forecast 2021-2033
- 5.1. Market Analysis, Insights and Forecast - by Russia
- 5.1.1. Production Analysis
- 5.1.1.1. Consumption Analysis and Market Value
- 5.1.1.2. Import Market Analysis (Volume and Value)
- 5.1.1.3. Export Market Analysis (Volume and Value)
- 5.1.1.4. Price Trend Analysis
- 5.1.2. Ukraine
- 5.1.3. France
- 5.1.4. Spain
- 5.1.5. Netherlands
- 5.1.6. Rest of Europe
- 5.1.1. Production Analysis
- 5.2. Market Analysis, Insights and Forecast - by Russia
- 5.2.1. Production Analysis
- 5.2.1.1. Consumption Analysis and Market Value
- 5.2.1.2. Import Market Analysis (Volume and Value)
- 5.2.1.3. Export Market Analysis (Volume and Value)
- 5.2.1.4. Price Trend Analysis
- 5.2.2. Ukraine
- 5.2.3. France
- 5.2.4. Spain
- 5.2.5. Netherlands
- 5.2.6. Rest of Europe
- 5.2.1. Production Analysis
- 5.3. Market Analysis, Insights and Forecast - by Region
- 5.3.1. Europe
- 5.1. Market Analysis, Insights and Forecast - by Russia
- 6. Europe Pea Industry Analysis, Insights and Forecast, 2021-2033
- 6.1. Market Analysis, Insights and Forecast - by Russia
- 6.1.1. Production Analysis
- 6.1.1.1. Consumption Analysis and Market Value
- 6.1.1.2. Import Market Analysis (Volume and Value)
- 6.1.1.3. Export Market Analysis (Volume and Value)
- 6.1.1.4. Price Trend Analysis
- 6.1.2. Ukraine
- 6.1.3. France
- 6.1.4. Spain
- 6.1.5. Netherlands
- 6.1.6. Rest of Europe
- 6.1.1. Production Analysis
- 6.2. Market Analysis, Insights and Forecast - by Russia
- 6.2.1. Production Analysis
- 6.2.1.1. Consumption Analysis and Market Value
- 6.2.1.2. Import Market Analysis (Volume and Value)
- 6.2.1.3. Export Market Analysis (Volume and Value)
- 6.2.1.4. Price Trend Analysis
- 6.2.2. Ukraine
- 6.2.3. France
- 6.2.4. Spain
- 6.2.5. Netherlands
- 6.2.6. Rest of Europe
- 6.2.1. Production Analysis
- 6.1. Market Analysis, Insights and Forecast - by Russia
- 7. Competitive Analysis
- 7.1. Company Profiles
- 7.1.1 Sensus
- 7.1.1.1. Company Overview
- 7.1.1.2. Products
- 7.1.1.3. Company Financials
- 7.1.1.4. SWOT Analysis
- 7.1.2 Tereos
- 7.1.2.1. Company Overview
- 7.1.2.2. Products
- 7.1.2.3. Company Financials
- 7.1.2.4. SWOT Analysis
- 7.1.3 Lantmännen
- 7.1.3.1. Company Overview
- 7.1.3.2. Products
- 7.1.3.3. Company Financials
- 7.1.3.4. SWOT Analysis
- 7.1.4 AGRANA
- 7.1.4.1. Company Overview
- 7.1.4.2. Products
- 7.1.4.3. Company Financials
- 7.1.4.4. SWOT Analysis
- 7.1.5 Roquette
- 7.1.5.1. Company Overview
- 7.1.5.2. Products
- 7.1.5.3. Company Financials
- 7.1.5.4. SWOT Analysis
- 7.1.1 Sensus
- 7.2. Market Entropy
- 7.2.1 Company's Key Areas Served
- 7.2.2 Recent Developments
- 7.3. Company Market Share Analysis 2025
- 7.3.1 Top 5 Companies Market Share Analysis
- 7.3.2 Top 3 Companies Market Share Analysis
- 7.4. List of Potential Customers
- 8. Research Methodology
List of Figures
- Figure 1: Europe Pea Industry Revenue Breakdown (Million, %) by Product 2025 & 2033
- Figure 2: Europe Pea Industry Share (%) by Company 2025
List of Tables
- Table 1: Europe Pea Industry Revenue Million Forecast, by Russia 2020 & 2033
- Table 2: Europe Pea Industry Volume million units Forecast, by Russia 2020 & 2033
- Table 3: Europe Pea Industry Revenue Million Forecast, by Russia 2020 & 2033
- Table 4: Europe Pea Industry Volume million units Forecast, by Russia 2020 & 2033
- Table 5: Europe Pea Industry Revenue Million Forecast, by Region 2020 & 2033
- Table 6: Europe Pea Industry Volume million units Forecast, by Region 2020 & 2033
- Table 7: Europe Pea Industry Revenue Million Forecast, by Russia 2020 & 2033
- Table 8: Europe Pea Industry Volume million units Forecast, by Russia 2020 & 2033
- Table 9: Europe Pea Industry Revenue Million Forecast, by Russia 2020 & 2033
- Table 10: Europe Pea Industry Volume million units Forecast, by Russia 2020 & 2033
- Table 11: Europe Pea Industry Revenue Million Forecast, by Country 2020 & 2033
- Table 12: Europe Pea Industry Volume million units Forecast, by Country 2020 & 2033
- Table 13: United Kingdom Europe Pea Industry Revenue (Million) Forecast, by Application 2020 & 2033
- Table 14: United Kingdom Europe Pea Industry Volume (million units) Forecast, by Application 2020 & 2033
- Table 15: Germany Europe Pea Industry Revenue (Million) Forecast, by Application 2020 & 2033
- Table 16: Germany Europe Pea Industry Volume (million units) Forecast, by Application 2020 & 2033
- Table 17: France Europe Pea Industry Revenue (Million) Forecast, by Application 2020 & 2033
- Table 18: France Europe Pea Industry Volume (million units) Forecast, by Application 2020 & 2033
- Table 19: Italy Europe Pea Industry Revenue (Million) Forecast, by Application 2020 & 2033
- Table 20: Italy Europe Pea Industry Volume (million units) Forecast, by Application 2020 & 2033
- Table 21: Spain Europe Pea Industry Revenue (Million) Forecast, by Application 2020 & 2033
- Table 22: Spain Europe Pea Industry Volume (million units) Forecast, by Application 2020 & 2033
- Table 23: Netherlands Europe Pea Industry Revenue (Million) Forecast, by Application 2020 & 2033
- Table 24: Netherlands Europe Pea Industry Volume (million units) Forecast, by Application 2020 & 2033
- Table 25: Belgium Europe Pea Industry Revenue (Million) Forecast, by Application 2020 & 2033
- Table 26: Belgium Europe Pea Industry Volume (million units) Forecast, by Application 2020 & 2033
- Table 27: Sweden Europe Pea Industry Revenue (Million) Forecast, by Application 2020 & 2033
- Table 28: Sweden Europe Pea Industry Volume (million units) Forecast, by Application 2020 & 2033
- Table 29: Norway Europe Pea Industry Revenue (Million) Forecast, by Application 2020 & 2033
- Table 30: Norway Europe Pea Industry Volume (million units) Forecast, by Application 2020 & 2033
- Table 31: Poland Europe Pea Industry Revenue (Million) Forecast, by Application 2020 & 2033
- Table 32: Poland Europe Pea Industry Volume (million units) Forecast, by Application 2020 & 2033
- Table 33: Denmark Europe Pea Industry Revenue (Million) Forecast, by Application 2020 & 2033
- Table 34: Denmark Europe Pea Industry Volume (million units) Forecast, by Application 2020 & 2033
Frequently Asked Questions
1. What is the projected Compound Annual Growth Rate (CAGR) of the Europe Pea Industry?
The projected CAGR is approximately 6.88%.
2. Which companies are prominent players in the Europe Pea Industry?
Key companies in the market include Sensus, Tereos , Lantmännen , AGRANA, Roquette .
3. What are the main segments of the Europe Pea Industry?
The market segments include Russia, Russia.
4. Can you provide details about the market size?
The market size is estimated to be USD 14.50 Million as of 2022.
5. What are some drivers contributing to market growth?
Rising Consumption of Cashew Nuts in the Country; Favorable Government Initiatives.
6. What are the notable trends driving market growth?
Growing Export Opportunity.
7. Are there any restraints impacting market growth?
Hazardous Climatic Condition Hinders Cashew Production; Stringent Regulations Related to Food Quality Standards.
8. Can you provide examples of recent developments in the market?
October 2022: Roquette, a global leader in plant-based ingredients and a pioneer of plant proteins, launched a new line of organic pea ingredients: organic pea starch and organic pea protein to the Europe market.
9. What pricing options are available for accessing the report?
Pricing options include single-user, multi-user, and enterprise licenses priced at USD 4750, USD 4950, and USD 6800 respectively.
10. Is the market size provided in terms of value or volume?
The market size is provided in terms of value, measured in Million and volume, measured in million units.
11. Are there any specific market keywords associated with the report?
Yes, the market keyword associated with the report is "Europe Pea Industry," which aids in identifying and referencing the specific market segment covered.
12. How do I determine which pricing option suits my needs best?
The pricing options vary based on user requirements and access needs. Individual users may opt for single-user licenses, while businesses requiring broader access may choose multi-user or enterprise licenses for cost-effective access to the report.
13. Are there any additional resources or data provided in the Europe Pea Industry report?
While the report offers comprehensive insights, it's advisable to review the specific contents or supplementary materials provided to ascertain if additional resources or data are available.
14. How can I stay updated on further developments or reports in the Europe Pea Industry?
To stay informed about further developments, trends, and reports in the Europe Pea Industry, consider subscribing to industry newsletters, following relevant companies and organizations, or regularly checking reputable industry news sources and publications.
Methodology
Step 1 - Identification of Relevant Samples Size from Population Database


Step 2 - Approaches for Defining Global Market Size (Value, Volume* & Price*)

Note*: In applicable scenarios
Step 3 - Data Sources
Primary Research
- Web Analytics
- Survey Reports
- Research Institute
- Latest Research Reports
- Opinion Leaders
Secondary Research
- Annual Reports
- White Paper
- Latest Press Release
- Industry Association
- Paid Database
- Investor Presentations

Step 4 - Data Triangulation
Involves using different sources of information in order to increase the validity of a study
These sources are likely to be stakeholders in a program - participants, other researchers, program staff, other community members, and so on.
Then we put all data in single framework & apply various statistical tools to find out the dynamic on the market.
During the analysis stage, feedback from the stakeholder groups would be compared to determine areas of agreement as well as areas of divergence