

Key Insights
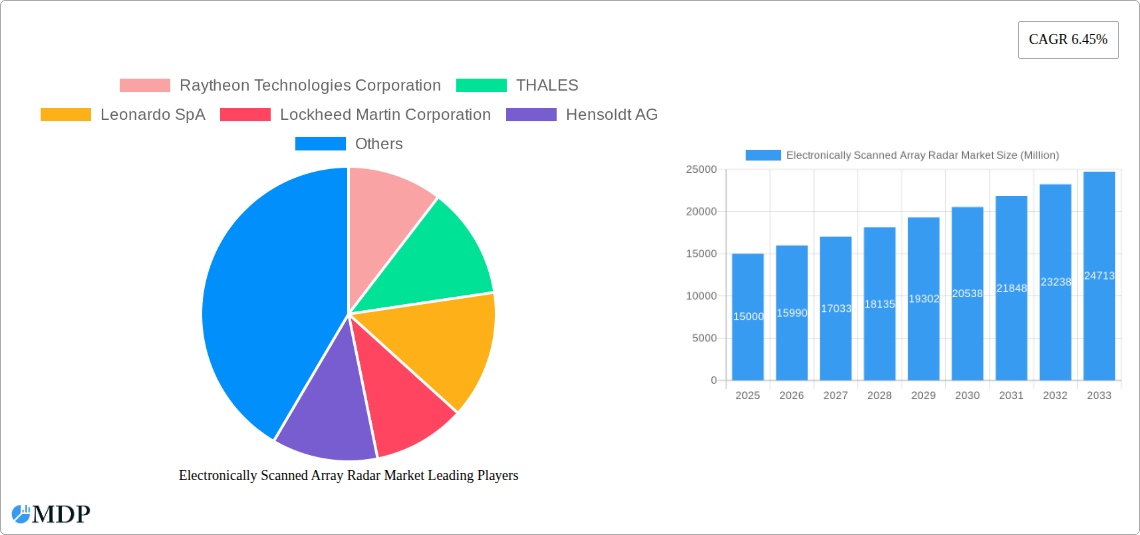
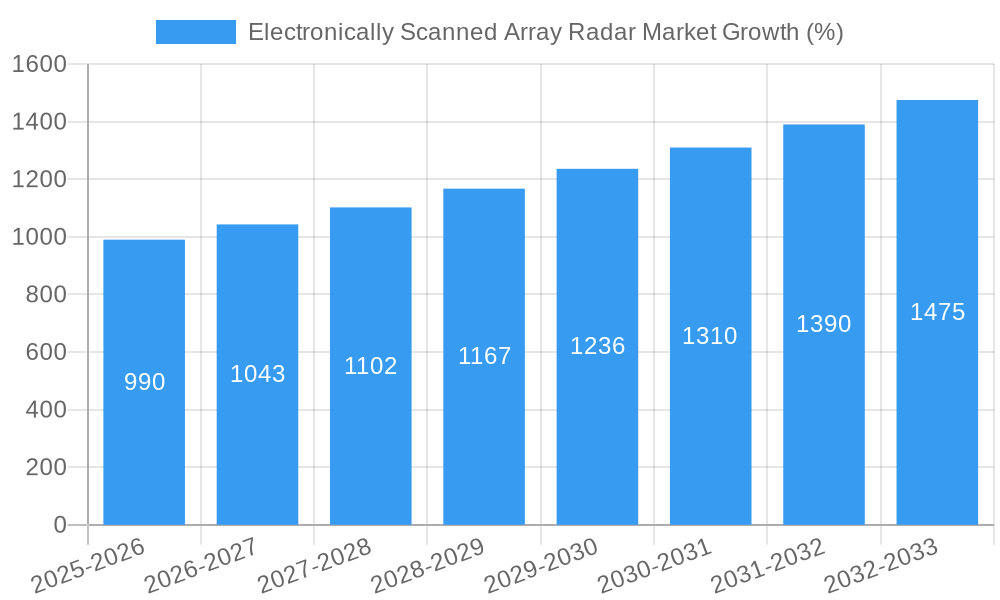
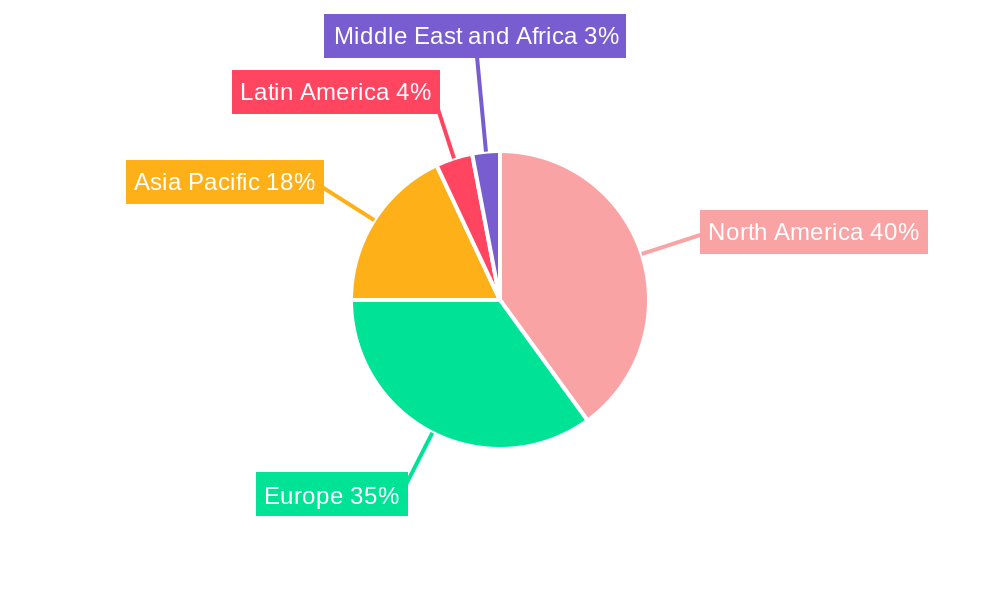
The Electronically Scanned Array (ESA) radar market is experiencing robust growth, driven by increasing demand for advanced surveillance and defense systems across various sectors. The market's Compound Annual Growth Rate (CAGR) of 6.45% from 2019 to 2024 indicates a significant expansion, projected to continue through 2033. Key drivers include the rising need for enhanced situational awareness, improved target detection capabilities, and the integration of ESA radar technology into autonomous systems, such as unmanned aerial vehicles (UAVs) and autonomous vehicles. The transition from mechanically scanned radars to ESA radars is a significant trend, as ESA technology offers superior performance in terms of speed, accuracy, and multi-target tracking. Furthermore, advancements in semiconductor technology, leading to smaller, lighter, and more energy-efficient ESA radars, are fueling market growth. While the high initial cost of ESA radar systems presents a restraint, the long-term cost savings associated with reduced maintenance and increased operational efficiency are offsetting this factor. The market is segmented by array type (Active and Passive ESA), platform (Land, Air, Sea), and fit type (Line Fit and Retrofit). Active ESA systems currently dominate due to their superior performance, but Passive ESA technology is gaining traction due to its cost-effectiveness in specific applications. The geographical distribution reveals a strong presence in North America and Europe, driven by significant defense spending and technological advancements in these regions. However, the Asia-Pacific region is expected to witness substantial growth fueled by rising investments in defense modernization and increasing adoption of advanced surveillance technologies.
The competitive landscape is marked by the presence of several established players, including Raytheon Technologies, Thales, Leonardo SpA, Lockheed Martin, and others. These companies are continuously investing in research and development to enhance radar capabilities, such as improved signal processing, increased range, and enhanced resolution. Strategic partnerships and collaborations are also prevalent, enabling companies to leverage expertise and expand their market reach. The forecast period (2025-2033) suggests continued expansion, propelled by the aforementioned drivers and the increasing integration of ESA radar technology in diverse applications beyond defense, such as air traffic control, weather monitoring, and autonomous driving. The market's future growth will depend heavily on technological innovation, government spending on defense and security, and the adoption of ESA radar in emerging applications. The competitive landscape will likely see further consolidation as companies strive to gain a larger market share through innovation, acquisitions, and strategic partnerships.
Electronically Scanned Array Radar Market: A Comprehensive Analysis (2019-2033)
This comprehensive report provides a detailed analysis of the Electronically Scanned Array (ESA) Radar market, offering invaluable insights for industry stakeholders, investors, and strategic decision-makers. The report covers the period from 2019 to 2033, with a base year of 2025 and a forecast period spanning 2025-2033. The study meticulously analyzes market dynamics, technological advancements, competitive landscapes, and future growth opportunities within this rapidly evolving sector. Key segments analyzed include Active and Passive ESA radars, across Land, Air, and Sea platforms, further categorized by Line Fit and Retrofit applications. Leading players such as Raytheon Technologies Corporation, Thales, and Lockheed Martin are profiled, revealing their market strategies and contributions to innovation.
Electronically Scanned Array Radar Market Market Dynamics & Concentration
The Electronically Scanned Array Radar market is characterized by a moderately concentrated landscape, with a few major players holding significant market share. The market’s growth is fueled by technological advancements, increasing defense budgets globally, and the rising demand for advanced surveillance and targeting systems. Stringent regulatory frameworks governing the production and deployment of radar systems influence market dynamics, while the emergence of alternative technologies presents a level of substitution threat. End-user trends, particularly towards enhanced situational awareness and improved accuracy, are shaping product development and market demand.
- Market Concentration: The top 5 players account for approximately xx% of the market share in 2025.
- Innovation Drivers: Miniaturization, improved signal processing, and AI integration are key innovation drivers.
- Regulatory Framework: Export controls and cybersecurity regulations impact market access and product design.
- Product Substitutes: Traditional mechanically scanned radars still hold a niche market, but their share is declining.
- End-User Trends: Demand for higher resolution, longer range, and multi-functionality is driving market growth.
- M&A Activities: An estimated xx M&A deals occurred between 2019-2024, signifying industry consolidation.
Electronically Scanned Array Radar Market Industry Trends & Analysis
The global Electronically Scanned Array Radar market is experiencing robust growth, projected to reach USD xx Million by 2033, exhibiting a CAGR of xx% during the forecast period (2025-2033). This growth is propelled by several key factors, including escalating geopolitical tensions leading to increased defense spending, the integration of advanced technologies like AI and machine learning to enhance radar capabilities, and a growing demand for advanced surveillance and air traffic management systems. Market penetration of ESA radars is increasing across various sectors, driven by their superior performance over traditional radar systems. Technological disruptions, such as the development of gallium nitride (GaN) based components, are improving the efficiency and capabilities of ESA radars. Competitive dynamics are characterized by ongoing innovation, strategic partnerships, and a focus on meeting the evolving needs of diverse end-users.
Leading Markets & Segments in Electronically Scanned Array Radar Market
The Air segment dominates the Electronically Scanned Array Radar market, accounting for xx% of the total market value in 2025, driven by the substantial demand from military and civilian aviation sectors. The Active Electronically Scanned Array type holds the largest market share (xx%), owing to its superior performance and versatility compared to passive systems. North America is currently the leading regional market, owing to strong defense spending and technological advancements.
Key Drivers by Segment:
- Air Segment: High demand from military and civilian aviation for enhanced surveillance and air traffic management.
- Active ESA Type: Superior performance, flexibility, and advanced features compared to passive systems.
- North America: Strong defense spending, technological leadership, and early adoption of advanced radar systems.
Dominance Analysis:
The dominance of the Air segment is expected to continue throughout the forecast period, driven by significant investments in military aircraft modernization and the increasing demand for sophisticated air defense systems. The Active ESA type's dominance is attributed to its superior capabilities and wider applicability across various platforms and applications. The continued technological leadership and robust defense budgets in North America will solidify its position as a leading market.
Electronically Scanned Array Radar Market Product Developments
Recent product innovations in the Electronically Scanned Array Radar market focus on miniaturization, improved signal processing, and the incorporation of AI and machine learning for enhanced target detection and tracking. These advancements are leading to more compact, efficient, and intelligent radar systems. This is improving the market fit across diverse applications, from military platforms to civilian infrastructure projects. The competitive advantage is shifting towards manufacturers who can deliver superior performance, cost-effectiveness, and adaptability to the evolving needs of various industries.
Key Drivers of Electronically Scanned Array Radar Market Growth
Technological advancements, particularly in areas like GaN technology and AI integration, are driving significant growth in the ESA radar market. Increased defense budgets globally, fueled by geopolitical instability, are further fueling demand. Furthermore, regulatory mandates related to air traffic control and enhanced security are pushing the adoption of advanced radar systems.
Challenges in the Electronically Scanned Array Radar Market Market
The Electronically Scanned Array Radar market faces challenges including high manufacturing costs, the complexity of integrating advanced technologies, and supply chain disruptions impacting the availability of crucial components. Moreover, intense competition among established players and new entrants creates pressure on pricing and margins. The estimated impact of these challenges on market growth is approximately xx% reduction in CAGR for the forecast period.
Emerging Opportunities in Electronically Scanned Array Radar Market
The long-term growth of the Electronically Scanned Array Radar market is poised to accelerate through technological breakthroughs in areas like high-frequency radars and improved signal processing techniques. Strategic partnerships and collaborations between defense contractors and technology companies are creating new market opportunities. Expansion into emerging markets with growing demand for advanced surveillance and security systems will offer significant growth potential.
Leading Players in the Electronically Scanned Array Radar Market Sector
- Raytheon Technologies Corporation
- THALES
- Leonardo SpA
- Lockheed Martin Corporation
- Hensoldt AG
- RADA Electronic Industries Ltd
- Mitsubishi Electric Corporation
- Israel Aerospace Industries
- ASELSAN A
- CEA Technologies
- Northrop Grumman Corporation
- Saab AB
Key Milestones in Electronically Scanned Array Radar Industry
- September 2022: Raytheon secured a USD 19.4 Million contract for APG-79 AESA radar system support.
- March 2023: The Indian MoD signed contracts worth USD 448.44 Million with Bharat Electronics Limited for radar and warning receivers.
Strategic Outlook for Electronically Scanned Array Radar Market Market
The future of the Electronically Scanned Array Radar market is bright, with significant growth potential driven by technological advancements, increased defense spending, and the growing demand for advanced surveillance and security systems. Strategic partnerships, investments in R&D, and expansion into new markets will be crucial for sustained growth and market leadership in the coming years.
Electronically Scanned Array Radar Market Segmentation
- 1. Production Analysis
- 2. Consumption Analysis
- 3. Import Market Analysis (Value & Volume)
- 4. Export Market Analysis (Value & Volume)
- 5. Price Trend Analysis
Electronically Scanned Array Radar Market Segmentation By Geography
-
1. North America
- 1.1. United States
- 1.2. Canada
- 1.3. Mexico
-
2. South America
- 2.1. Brazil
- 2.2. Argentina
- 2.3. Rest of South America
-
3. Europe
- 3.1. United Kingdom
- 3.2. Germany
- 3.3. France
- 3.4. Italy
- 3.5. Spain
- 3.6. Russia
- 3.7. Benelux
- 3.8. Nordics
- 3.9. Rest of Europe
-
4. Middle East & Africa
- 4.1. Turkey
- 4.2. Israel
- 4.3. GCC
- 4.4. North Africa
- 4.5. South Africa
- 4.6. Rest of Middle East & Africa
-
5. Asia Pacific
- 5.1. China
- 5.2. India
- 5.3. Japan
- 5.4. South Korea
- 5.5. ASEAN
- 5.6. Oceania
- 5.7. Rest of Asia Pacific
Electronically Scanned Array Radar Market REPORT HIGHLIGHTS
| Aspects | Details |
|---|---|
| Study Period | 2019-2033 |
| Base Year | 2024 |
| Estimated Year | 2025 |
| Forecast Period | 2025-2033 |
| Historical Period | 2019-2024 |
| Growth Rate | CAGR of 6.45% from 2019-2033 |
| Segmentation |
|
Table of Contents
- 1. Introduction
- 1.1. Research Scope
- 1.2. Market Segmentation
- 1.3. Research Methodology
- 1.4. Definitions and Assumptions
- 2. Executive Summary
- 2.1. Introduction
- 3. Market Dynamics
- 3.1. Introduction
- 3.2. Market Drivers
- 3.2.1. ; Increasing Number Of Air Passengers; Use Of Portable Electronic Devices
- 3.3. Market Restrains
- 3.3.1. ; High Cost Of Connectivity Equipments
- 3.4. Market Trends
- 3.4.1. Active Electronically Scanned Array Segment to Dominate the Market During the Forecast Period
- 4. Market Factor Analysis
- 4.1. Porters Five Forces
- 4.2. Supply/Value Chain
- 4.3. PESTEL analysis
- 4.4. Market Entropy
- 4.5. Patent/Trademark Analysis
- 5. Global Electronically Scanned Array Radar Market Analysis, Insights and Forecast, 2019-2031
- 5.1. Market Analysis, Insights and Forecast - by Production Analysis
- 5.2. Market Analysis, Insights and Forecast - by Consumption Analysis
- 5.3. Market Analysis, Insights and Forecast - by Import Market Analysis (Value & Volume)
- 5.4. Market Analysis, Insights and Forecast - by Export Market Analysis (Value & Volume)
- 5.5. Market Analysis, Insights and Forecast - by Price Trend Analysis
- 5.6. Market Analysis, Insights and Forecast - by Region
- 5.6.1. North America
- 5.6.2. South America
- 5.6.3. Europe
- 5.6.4. Middle East & Africa
- 5.6.5. Asia Pacific
- 5.1. Market Analysis, Insights and Forecast - by Production Analysis
- 6. North America Electronically Scanned Array Radar Market Analysis, Insights and Forecast, 2019-2031
- 6.1. Market Analysis, Insights and Forecast - by Production Analysis
- 6.2. Market Analysis, Insights and Forecast - by Consumption Analysis
- 6.3. Market Analysis, Insights and Forecast - by Import Market Analysis (Value & Volume)
- 6.4. Market Analysis, Insights and Forecast - by Export Market Analysis (Value & Volume)
- 6.5. Market Analysis, Insights and Forecast - by Price Trend Analysis
- 6.1. Market Analysis, Insights and Forecast - by Production Analysis
- 7. South America Electronically Scanned Array Radar Market Analysis, Insights and Forecast, 2019-2031
- 7.1. Market Analysis, Insights and Forecast - by Production Analysis
- 7.2. Market Analysis, Insights and Forecast - by Consumption Analysis
- 7.3. Market Analysis, Insights and Forecast - by Import Market Analysis (Value & Volume)
- 7.4. Market Analysis, Insights and Forecast - by Export Market Analysis (Value & Volume)
- 7.5. Market Analysis, Insights and Forecast - by Price Trend Analysis
- 7.1. Market Analysis, Insights and Forecast - by Production Analysis
- 8. Europe Electronically Scanned Array Radar Market Analysis, Insights and Forecast, 2019-2031
- 8.1. Market Analysis, Insights and Forecast - by Production Analysis
- 8.2. Market Analysis, Insights and Forecast - by Consumption Analysis
- 8.3. Market Analysis, Insights and Forecast - by Import Market Analysis (Value & Volume)
- 8.4. Market Analysis, Insights and Forecast - by Export Market Analysis (Value & Volume)
- 8.5. Market Analysis, Insights and Forecast - by Price Trend Analysis
- 8.1. Market Analysis, Insights and Forecast - by Production Analysis
- 9. Middle East & Africa Electronically Scanned Array Radar Market Analysis, Insights and Forecast, 2019-2031
- 9.1. Market Analysis, Insights and Forecast - by Production Analysis
- 9.2. Market Analysis, Insights and Forecast - by Consumption Analysis
- 9.3. Market Analysis, Insights and Forecast - by Import Market Analysis (Value & Volume)
- 9.4. Market Analysis, Insights and Forecast - by Export Market Analysis (Value & Volume)
- 9.5. Market Analysis, Insights and Forecast - by Price Trend Analysis
- 9.1. Market Analysis, Insights and Forecast - by Production Analysis
- 10. Asia Pacific Electronically Scanned Array Radar Market Analysis, Insights and Forecast, 2019-2031
- 10.1. Market Analysis, Insights and Forecast - by Production Analysis
- 10.2. Market Analysis, Insights and Forecast - by Consumption Analysis
- 10.3. Market Analysis, Insights and Forecast - by Import Market Analysis (Value & Volume)
- 10.4. Market Analysis, Insights and Forecast - by Export Market Analysis (Value & Volume)
- 10.5. Market Analysis, Insights and Forecast - by Price Trend Analysis
- 10.1. Market Analysis, Insights and Forecast - by Production Analysis
- 11. North America Electronically Scanned Array Radar Market Analysis, Insights and Forecast, 2019-2031
- 11.1. Market Analysis, Insights and Forecast - By Country/Sub-region
- 11.1.1 United States
- 11.1.2 Canada
- 12. Europe Electronically Scanned Array Radar Market Analysis, Insights and Forecast, 2019-2031
- 12.1. Market Analysis, Insights and Forecast - By Country/Sub-region
- 12.1.1 United Kingdom
- 12.1.2 France
- 12.1.3 Germany
- 12.1.4 Russia
- 12.1.5 Rest of Europe
- 13. Asia Pacific Electronically Scanned Array Radar Market Analysis, Insights and Forecast, 2019-2031
- 13.1. Market Analysis, Insights and Forecast - By Country/Sub-region
- 13.1.1 China
- 13.1.2 India
- 13.1.3 Japan
- 13.1.4 South Korea
- 13.1.5 Rest of Asia Pacific
- 14. Latin America Electronically Scanned Array Radar Market Analysis, Insights and Forecast, 2019-2031
- 14.1. Market Analysis, Insights and Forecast - By Country/Sub-region
- 14.1.1 Brazil
- 14.1.2 Mexico
- 14.1.3 Rest of Latin America
- 15. Middle East and Africa Electronically Scanned Array Radar Market Analysis, Insights and Forecast, 2019-2031
- 15.1. Market Analysis, Insights and Forecast - By Country/Sub-region
- 15.1.1 Saudi Arabia
- 15.1.2 United Arab Emirates
- 15.1.3 Turkey
- 15.1.4 Rest of Middle East and Africa
- 16. Competitive Analysis
- 16.1. Global Market Share Analysis 2024
- 16.2. Company Profiles
- 16.2.1 Raytheon Technologies Corporation
- 16.2.1.1. Overview
- 16.2.1.2. Products
- 16.2.1.3. SWOT Analysis
- 16.2.1.4. Recent Developments
- 16.2.1.5. Financials (Based on Availability)
- 16.2.2 THALES
- 16.2.2.1. Overview
- 16.2.2.2. Products
- 16.2.2.3. SWOT Analysis
- 16.2.2.4. Recent Developments
- 16.2.2.5. Financials (Based on Availability)
- 16.2.3 Leonardo SpA
- 16.2.3.1. Overview
- 16.2.3.2. Products
- 16.2.3.3. SWOT Analysis
- 16.2.3.4. Recent Developments
- 16.2.3.5. Financials (Based on Availability)
- 16.2.4 Lockheed Martin Corporation
- 16.2.4.1. Overview
- 16.2.4.2. Products
- 16.2.4.3. SWOT Analysis
- 16.2.4.4. Recent Developments
- 16.2.4.5. Financials (Based on Availability)
- 16.2.5 Hensoldt AG
- 16.2.5.1. Overview
- 16.2.5.2. Products
- 16.2.5.3. SWOT Analysis
- 16.2.5.4. Recent Developments
- 16.2.5.5. Financials (Based on Availability)
- 16.2.6 RADA Electronic Industries Ltd
- 16.2.6.1. Overview
- 16.2.6.2. Products
- 16.2.6.3. SWOT Analysis
- 16.2.6.4. Recent Developments
- 16.2.6.5. Financials (Based on Availability)
- 16.2.7 Mitsubishi Electric Corporation
- 16.2.7.1. Overview
- 16.2.7.2. Products
- 16.2.7.3. SWOT Analysis
- 16.2.7.4. Recent Developments
- 16.2.7.5. Financials (Based on Availability)
- 16.2.8 Israel Aerospace Industries
- 16.2.8.1. Overview
- 16.2.8.2. Products
- 16.2.8.3. SWOT Analysis
- 16.2.8.4. Recent Developments
- 16.2.8.5. Financials (Based on Availability)
- 16.2.9 ASELSAN A
- 16.2.9.1. Overview
- 16.2.9.2. Products
- 16.2.9.3. SWOT Analysis
- 16.2.9.4. Recent Developments
- 16.2.9.5. Financials (Based on Availability)
- 16.2.10 CEA Technologies
- 16.2.10.1. Overview
- 16.2.10.2. Products
- 16.2.10.3. SWOT Analysis
- 16.2.10.4. Recent Developments
- 16.2.10.5. Financials (Based on Availability)
- 16.2.11 Northrop Grumman Corporation
- 16.2.11.1. Overview
- 16.2.11.2. Products
- 16.2.11.3. SWOT Analysis
- 16.2.11.4. Recent Developments
- 16.2.11.5. Financials (Based on Availability)
- 16.2.12 Saab AB
- 16.2.12.1. Overview
- 16.2.12.2. Products
- 16.2.12.3. SWOT Analysis
- 16.2.12.4. Recent Developments
- 16.2.12.5. Financials (Based on Availability)
- 16.2.1 Raytheon Technologies Corporation
List of Figures
- Figure 1: Global Electronically Scanned Array Radar Market Revenue Breakdown (Million, %) by Region 2024 & 2032
- Figure 2: North America Electronically Scanned Array Radar Market Revenue (Million), by Country 2024 & 2032
- Figure 3: North America Electronically Scanned Array Radar Market Revenue Share (%), by Country 2024 & 2032
- Figure 4: Europe Electronically Scanned Array Radar Market Revenue (Million), by Country 2024 & 2032
- Figure 5: Europe Electronically Scanned Array Radar Market Revenue Share (%), by Country 2024 & 2032
- Figure 6: Asia Pacific Electronically Scanned Array Radar Market Revenue (Million), by Country 2024 & 2032
- Figure 7: Asia Pacific Electronically Scanned Array Radar Market Revenue Share (%), by Country 2024 & 2032
- Figure 8: Latin America Electronically Scanned Array Radar Market Revenue (Million), by Country 2024 & 2032
- Figure 9: Latin America Electronically Scanned Array Radar Market Revenue Share (%), by Country 2024 & 2032
- Figure 10: Middle East and Africa Electronically Scanned Array Radar Market Revenue (Million), by Country 2024 & 2032
- Figure 11: Middle East and Africa Electronically Scanned Array Radar Market Revenue Share (%), by Country 2024 & 2032
- Figure 12: North America Electronically Scanned Array Radar Market Revenue (Million), by Production Analysis 2024 & 2032
- Figure 13: North America Electronically Scanned Array Radar Market Revenue Share (%), by Production Analysis 2024 & 2032
- Figure 14: North America Electronically Scanned Array Radar Market Revenue (Million), by Consumption Analysis 2024 & 2032
- Figure 15: North America Electronically Scanned Array Radar Market Revenue Share (%), by Consumption Analysis 2024 & 2032
- Figure 16: North America Electronically Scanned Array Radar Market Revenue (Million), by Import Market Analysis (Value & Volume) 2024 & 2032
- Figure 17: North America Electronically Scanned Array Radar Market Revenue Share (%), by Import Market Analysis (Value & Volume) 2024 & 2032
- Figure 18: North America Electronically Scanned Array Radar Market Revenue (Million), by Export Market Analysis (Value & Volume) 2024 & 2032
- Figure 19: North America Electronically Scanned Array Radar Market Revenue Share (%), by Export Market Analysis (Value & Volume) 2024 & 2032
- Figure 20: North America Electronically Scanned Array Radar Market Revenue (Million), by Price Trend Analysis 2024 & 2032
- Figure 21: North America Electronically Scanned Array Radar Market Revenue Share (%), by Price Trend Analysis 2024 & 2032
- Figure 22: North America Electronically Scanned Array Radar Market Revenue (Million), by Country 2024 & 2032
- Figure 23: North America Electronically Scanned Array Radar Market Revenue Share (%), by Country 2024 & 2032
- Figure 24: South America Electronically Scanned Array Radar Market Revenue (Million), by Production Analysis 2024 & 2032
- Figure 25: South America Electronically Scanned Array Radar Market Revenue Share (%), by Production Analysis 2024 & 2032
- Figure 26: South America Electronically Scanned Array Radar Market Revenue (Million), by Consumption Analysis 2024 & 2032
- Figure 27: South America Electronically Scanned Array Radar Market Revenue Share (%), by Consumption Analysis 2024 & 2032
- Figure 28: South America Electronically Scanned Array Radar Market Revenue (Million), by Import Market Analysis (Value & Volume) 2024 & 2032
- Figure 29: South America Electronically Scanned Array Radar Market Revenue Share (%), by Import Market Analysis (Value & Volume) 2024 & 2032
- Figure 30: South America Electronically Scanned Array Radar Market Revenue (Million), by Export Market Analysis (Value & Volume) 2024 & 2032
- Figure 31: South America Electronically Scanned Array Radar Market Revenue Share (%), by Export Market Analysis (Value & Volume) 2024 & 2032
- Figure 32: South America Electronically Scanned Array Radar Market Revenue (Million), by Price Trend Analysis 2024 & 2032
- Figure 33: South America Electronically Scanned Array Radar Market Revenue Share (%), by Price Trend Analysis 2024 & 2032
- Figure 34: South America Electronically Scanned Array Radar Market Revenue (Million), by Country 2024 & 2032
- Figure 35: South America Electronically Scanned Array Radar Market Revenue Share (%), by Country 2024 & 2032
- Figure 36: Europe Electronically Scanned Array Radar Market Revenue (Million), by Production Analysis 2024 & 2032
- Figure 37: Europe Electronically Scanned Array Radar Market Revenue Share (%), by Production Analysis 2024 & 2032
- Figure 38: Europe Electronically Scanned Array Radar Market Revenue (Million), by Consumption Analysis 2024 & 2032
- Figure 39: Europe Electronically Scanned Array Radar Market Revenue Share (%), by Consumption Analysis 2024 & 2032
- Figure 40: Europe Electronically Scanned Array Radar Market Revenue (Million), by Import Market Analysis (Value & Volume) 2024 & 2032
- Figure 41: Europe Electronically Scanned Array Radar Market Revenue Share (%), by Import Market Analysis (Value & Volume) 2024 & 2032
- Figure 42: Europe Electronically Scanned Array Radar Market Revenue (Million), by Export Market Analysis (Value & Volume) 2024 & 2032
- Figure 43: Europe Electronically Scanned Array Radar Market Revenue Share (%), by Export Market Analysis (Value & Volume) 2024 & 2032
- Figure 44: Europe Electronically Scanned Array Radar Market Revenue (Million), by Price Trend Analysis 2024 & 2032
- Figure 45: Europe Electronically Scanned Array Radar Market Revenue Share (%), by Price Trend Analysis 2024 & 2032
- Figure 46: Europe Electronically Scanned Array Radar Market Revenue (Million), by Country 2024 & 2032
- Figure 47: Europe Electronically Scanned Array Radar Market Revenue Share (%), by Country 2024 & 2032
- Figure 48: Middle East & Africa Electronically Scanned Array Radar Market Revenue (Million), by Production Analysis 2024 & 2032
- Figure 49: Middle East & Africa Electronically Scanned Array Radar Market Revenue Share (%), by Production Analysis 2024 & 2032
- Figure 50: Middle East & Africa Electronically Scanned Array Radar Market Revenue (Million), by Consumption Analysis 2024 & 2032
- Figure 51: Middle East & Africa Electronically Scanned Array Radar Market Revenue Share (%), by Consumption Analysis 2024 & 2032
- Figure 52: Middle East & Africa Electronically Scanned Array Radar Market Revenue (Million), by Import Market Analysis (Value & Volume) 2024 & 2032
- Figure 53: Middle East & Africa Electronically Scanned Array Radar Market Revenue Share (%), by Import Market Analysis (Value & Volume) 2024 & 2032
- Figure 54: Middle East & Africa Electronically Scanned Array Radar Market Revenue (Million), by Export Market Analysis (Value & Volume) 2024 & 2032
- Figure 55: Middle East & Africa Electronically Scanned Array Radar Market Revenue Share (%), by Export Market Analysis (Value & Volume) 2024 & 2032
- Figure 56: Middle East & Africa Electronically Scanned Array Radar Market Revenue (Million), by Price Trend Analysis 2024 & 2032
- Figure 57: Middle East & Africa Electronically Scanned Array Radar Market Revenue Share (%), by Price Trend Analysis 2024 & 2032
- Figure 58: Middle East & Africa Electronically Scanned Array Radar Market Revenue (Million), by Country 2024 & 2032
- Figure 59: Middle East & Africa Electronically Scanned Array Radar Market Revenue Share (%), by Country 2024 & 2032
- Figure 60: Asia Pacific Electronically Scanned Array Radar Market Revenue (Million), by Production Analysis 2024 & 2032
- Figure 61: Asia Pacific Electronically Scanned Array Radar Market Revenue Share (%), by Production Analysis 2024 & 2032
- Figure 62: Asia Pacific Electronically Scanned Array Radar Market Revenue (Million), by Consumption Analysis 2024 & 2032
- Figure 63: Asia Pacific Electronically Scanned Array Radar Market Revenue Share (%), by Consumption Analysis 2024 & 2032
- Figure 64: Asia Pacific Electronically Scanned Array Radar Market Revenue (Million), by Import Market Analysis (Value & Volume) 2024 & 2032
- Figure 65: Asia Pacific Electronically Scanned Array Radar Market Revenue Share (%), by Import Market Analysis (Value & Volume) 2024 & 2032
- Figure 66: Asia Pacific Electronically Scanned Array Radar Market Revenue (Million), by Export Market Analysis (Value & Volume) 2024 & 2032
- Figure 67: Asia Pacific Electronically Scanned Array Radar Market Revenue Share (%), by Export Market Analysis (Value & Volume) 2024 & 2032
- Figure 68: Asia Pacific Electronically Scanned Array Radar Market Revenue (Million), by Price Trend Analysis 2024 & 2032
- Figure 69: Asia Pacific Electronically Scanned Array Radar Market Revenue Share (%), by Price Trend Analysis 2024 & 2032
- Figure 70: Asia Pacific Electronically Scanned Array Radar Market Revenue (Million), by Country 2024 & 2032
- Figure 71: Asia Pacific Electronically Scanned Array Radar Market Revenue Share (%), by Country 2024 & 2032
List of Tables
- Table 1: Global Electronically Scanned Array Radar Market Revenue Million Forecast, by Region 2019 & 2032
- Table 2: Global Electronically Scanned Array Radar Market Revenue Million Forecast, by Production Analysis 2019 & 2032
- Table 3: Global Electronically Scanned Array Radar Market Revenue Million Forecast, by Consumption Analysis 2019 & 2032
- Table 4: Global Electronically Scanned Array Radar Market Revenue Million Forecast, by Import Market Analysis (Value & Volume) 2019 & 2032
- Table 5: Global Electronically Scanned Array Radar Market Revenue Million Forecast, by Export Market Analysis (Value & Volume) 2019 & 2032
- Table 6: Global Electronically Scanned Array Radar Market Revenue Million Forecast, by Price Trend Analysis 2019 & 2032
- Table 7: Global Electronically Scanned Array Radar Market Revenue Million Forecast, by Region 2019 & 2032
- Table 8: Global Electronically Scanned Array Radar Market Revenue Million Forecast, by Country 2019 & 2032
- Table 9: United States Electronically Scanned Array Radar Market Revenue (Million) Forecast, by Application 2019 & 2032
- Table 10: Canada Electronically Scanned Array Radar Market Revenue (Million) Forecast, by Application 2019 & 2032
- Table 11: Global Electronically Scanned Array Radar Market Revenue Million Forecast, by Country 2019 & 2032
- Table 12: United Kingdom Electronically Scanned Array Radar Market Revenue (Million) Forecast, by Application 2019 & 2032
- Table 13: France Electronically Scanned Array Radar Market Revenue (Million) Forecast, by Application 2019 & 2032
- Table 14: Germany Electronically Scanned Array Radar Market Revenue (Million) Forecast, by Application 2019 & 2032
- Table 15: Russia Electronically Scanned Array Radar Market Revenue (Million) Forecast, by Application 2019 & 2032
- Table 16: Rest of Europe Electronically Scanned Array Radar Market Revenue (Million) Forecast, by Application 2019 & 2032
- Table 17: Global Electronically Scanned Array Radar Market Revenue Million Forecast, by Country 2019 & 2032
- Table 18: China Electronically Scanned Array Radar Market Revenue (Million) Forecast, by Application 2019 & 2032
- Table 19: India Electronically Scanned Array Radar Market Revenue (Million) Forecast, by Application 2019 & 2032
- Table 20: Japan Electronically Scanned Array Radar Market Revenue (Million) Forecast, by Application 2019 & 2032
- Table 21: South Korea Electronically Scanned Array Radar Market Revenue (Million) Forecast, by Application 2019 & 2032
- Table 22: Rest of Asia Pacific Electronically Scanned Array Radar Market Revenue (Million) Forecast, by Application 2019 & 2032
- Table 23: Global Electronically Scanned Array Radar Market Revenue Million Forecast, by Country 2019 & 2032
- Table 24: Brazil Electronically Scanned Array Radar Market Revenue (Million) Forecast, by Application 2019 & 2032
- Table 25: Mexico Electronically Scanned Array Radar Market Revenue (Million) Forecast, by Application 2019 & 2032
- Table 26: Rest of Latin America Electronically Scanned Array Radar Market Revenue (Million) Forecast, by Application 2019 & 2032
- Table 27: Global Electronically Scanned Array Radar Market Revenue Million Forecast, by Country 2019 & 2032
- Table 28: Saudi Arabia Electronically Scanned Array Radar Market Revenue (Million) Forecast, by Application 2019 & 2032
- Table 29: United Arab Emirates Electronically Scanned Array Radar Market Revenue (Million) Forecast, by Application 2019 & 2032
- Table 30: Turkey Electronically Scanned Array Radar Market Revenue (Million) Forecast, by Application 2019 & 2032
- Table 31: Rest of Middle East and Africa Electronically Scanned Array Radar Market Revenue (Million) Forecast, by Application 2019 & 2032
- Table 32: Global Electronically Scanned Array Radar Market Revenue Million Forecast, by Production Analysis 2019 & 2032
- Table 33: Global Electronically Scanned Array Radar Market Revenue Million Forecast, by Consumption Analysis 2019 & 2032
- Table 34: Global Electronically Scanned Array Radar Market Revenue Million Forecast, by Import Market Analysis (Value & Volume) 2019 & 2032
- Table 35: Global Electronically Scanned Array Radar Market Revenue Million Forecast, by Export Market Analysis (Value & Volume) 2019 & 2032
- Table 36: Global Electronically Scanned Array Radar Market Revenue Million Forecast, by Price Trend Analysis 2019 & 2032
- Table 37: Global Electronically Scanned Array Radar Market Revenue Million Forecast, by Country 2019 & 2032
- Table 38: United States Electronically Scanned Array Radar Market Revenue (Million) Forecast, by Application 2019 & 2032
- Table 39: Canada Electronically Scanned Array Radar Market Revenue (Million) Forecast, by Application 2019 & 2032
- Table 40: Mexico Electronically Scanned Array Radar Market Revenue (Million) Forecast, by Application 2019 & 2032
- Table 41: Global Electronically Scanned Array Radar Market Revenue Million Forecast, by Production Analysis 2019 & 2032
- Table 42: Global Electronically Scanned Array Radar Market Revenue Million Forecast, by Consumption Analysis 2019 & 2032
- Table 43: Global Electronically Scanned Array Radar Market Revenue Million Forecast, by Import Market Analysis (Value & Volume) 2019 & 2032
- Table 44: Global Electronically Scanned Array Radar Market Revenue Million Forecast, by Export Market Analysis (Value & Volume) 2019 & 2032
- Table 45: Global Electronically Scanned Array Radar Market Revenue Million Forecast, by Price Trend Analysis 2019 & 2032
- Table 46: Global Electronically Scanned Array Radar Market Revenue Million Forecast, by Country 2019 & 2032
- Table 47: Brazil Electronically Scanned Array Radar Market Revenue (Million) Forecast, by Application 2019 & 2032
- Table 48: Argentina Electronically Scanned Array Radar Market Revenue (Million) Forecast, by Application 2019 & 2032
- Table 49: Rest of South America Electronically Scanned Array Radar Market Revenue (Million) Forecast, by Application 2019 & 2032
- Table 50: Global Electronically Scanned Array Radar Market Revenue Million Forecast, by Production Analysis 2019 & 2032
- Table 51: Global Electronically Scanned Array Radar Market Revenue Million Forecast, by Consumption Analysis 2019 & 2032
- Table 52: Global Electronically Scanned Array Radar Market Revenue Million Forecast, by Import Market Analysis (Value & Volume) 2019 & 2032
- Table 53: Global Electronically Scanned Array Radar Market Revenue Million Forecast, by Export Market Analysis (Value & Volume) 2019 & 2032
- Table 54: Global Electronically Scanned Array Radar Market Revenue Million Forecast, by Price Trend Analysis 2019 & 2032
- Table 55: Global Electronically Scanned Array Radar Market Revenue Million Forecast, by Country 2019 & 2032
- Table 56: United Kingdom Electronically Scanned Array Radar Market Revenue (Million) Forecast, by Application 2019 & 2032
- Table 57: Germany Electronically Scanned Array Radar Market Revenue (Million) Forecast, by Application 2019 & 2032
- Table 58: France Electronically Scanned Array Radar Market Revenue (Million) Forecast, by Application 2019 & 2032
- Table 59: Italy Electronically Scanned Array Radar Market Revenue (Million) Forecast, by Application 2019 & 2032
- Table 60: Spain Electronically Scanned Array Radar Market Revenue (Million) Forecast, by Application 2019 & 2032
- Table 61: Russia Electronically Scanned Array Radar Market Revenue (Million) Forecast, by Application 2019 & 2032
- Table 62: Benelux Electronically Scanned Array Radar Market Revenue (Million) Forecast, by Application 2019 & 2032
- Table 63: Nordics Electronically Scanned Array Radar Market Revenue (Million) Forecast, by Application 2019 & 2032
- Table 64: Rest of Europe Electronically Scanned Array Radar Market Revenue (Million) Forecast, by Application 2019 & 2032
- Table 65: Global Electronically Scanned Array Radar Market Revenue Million Forecast, by Production Analysis 2019 & 2032
- Table 66: Global Electronically Scanned Array Radar Market Revenue Million Forecast, by Consumption Analysis 2019 & 2032
- Table 67: Global Electronically Scanned Array Radar Market Revenue Million Forecast, by Import Market Analysis (Value & Volume) 2019 & 2032
- Table 68: Global Electronically Scanned Array Radar Market Revenue Million Forecast, by Export Market Analysis (Value & Volume) 2019 & 2032
- Table 69: Global Electronically Scanned Array Radar Market Revenue Million Forecast, by Price Trend Analysis 2019 & 2032
- Table 70: Global Electronically Scanned Array Radar Market Revenue Million Forecast, by Country 2019 & 2032
- Table 71: Turkey Electronically Scanned Array Radar Market Revenue (Million) Forecast, by Application 2019 & 2032
- Table 72: Israel Electronically Scanned Array Radar Market Revenue (Million) Forecast, by Application 2019 & 2032
- Table 73: GCC Electronically Scanned Array Radar Market Revenue (Million) Forecast, by Application 2019 & 2032
- Table 74: North Africa Electronically Scanned Array Radar Market Revenue (Million) Forecast, by Application 2019 & 2032
- Table 75: South Africa Electronically Scanned Array Radar Market Revenue (Million) Forecast, by Application 2019 & 2032
- Table 76: Rest of Middle East & Africa Electronically Scanned Array Radar Market Revenue (Million) Forecast, by Application 2019 & 2032
- Table 77: Global Electronically Scanned Array Radar Market Revenue Million Forecast, by Production Analysis 2019 & 2032
- Table 78: Global Electronically Scanned Array Radar Market Revenue Million Forecast, by Consumption Analysis 2019 & 2032
- Table 79: Global Electronically Scanned Array Radar Market Revenue Million Forecast, by Import Market Analysis (Value & Volume) 2019 & 2032
- Table 80: Global Electronically Scanned Array Radar Market Revenue Million Forecast, by Export Market Analysis (Value & Volume) 2019 & 2032
- Table 81: Global Electronically Scanned Array Radar Market Revenue Million Forecast, by Price Trend Analysis 2019 & 2032
- Table 82: Global Electronically Scanned Array Radar Market Revenue Million Forecast, by Country 2019 & 2032
- Table 83: China Electronically Scanned Array Radar Market Revenue (Million) Forecast, by Application 2019 & 2032
- Table 84: India Electronically Scanned Array Radar Market Revenue (Million) Forecast, by Application 2019 & 2032
- Table 85: Japan Electronically Scanned Array Radar Market Revenue (Million) Forecast, by Application 2019 & 2032
- Table 86: South Korea Electronically Scanned Array Radar Market Revenue (Million) Forecast, by Application 2019 & 2032
- Table 87: ASEAN Electronically Scanned Array Radar Market Revenue (Million) Forecast, by Application 2019 & 2032
- Table 88: Oceania Electronically Scanned Array Radar Market Revenue (Million) Forecast, by Application 2019 & 2032
- Table 89: Rest of Asia Pacific Electronically Scanned Array Radar Market Revenue (Million) Forecast, by Application 2019 & 2032
Frequently Asked Questions
1. What is the projected Compound Annual Growth Rate (CAGR) of the Electronically Scanned Array Radar Market?
The projected CAGR is approximately 6.45%.
2. Which companies are prominent players in the Electronically Scanned Array Radar Market?
Key companies in the market include Raytheon Technologies Corporation, THALES, Leonardo SpA, Lockheed Martin Corporation, Hensoldt AG, RADA Electronic Industries Ltd, Mitsubishi Electric Corporation, Israel Aerospace Industries, ASELSAN A, CEA Technologies, Northrop Grumman Corporation, Saab AB.
3. What are the main segments of the Electronically Scanned Array Radar Market?
The market segments include Production Analysis, Consumption Analysis, Import Market Analysis (Value & Volume), Export Market Analysis (Value & Volume), Price Trend Analysis.
4. Can you provide details about the market size?
The market size is estimated to be USD XX Million as of 2022.
5. What are some drivers contributing to market growth?
; Increasing Number Of Air Passengers; Use Of Portable Electronic Devices.
6. What are the notable trends driving market growth?
Active Electronically Scanned Array Segment to Dominate the Market During the Forecast Period.
7. Are there any restraints impacting market growth?
; High Cost Of Connectivity Equipments.
8. Can you provide examples of recent developments in the market?
In March 2023, The Indian Ministry of Defence (MoD) signed two contracts worth USD448.44m with the government-owned aerospace and defense electronics company Bharat Electronics Limited (BEL) to provide radar and warning receivers for Indian Air Force.
9. What pricing options are available for accessing the report?
Pricing options include single-user, multi-user, and enterprise licenses priced at USD 4750, USD 5250, and USD 8750 respectively.
10. Is the market size provided in terms of value or volume?
The market size is provided in terms of value, measured in Million.
11. Are there any specific market keywords associated with the report?
Yes, the market keyword associated with the report is "Electronically Scanned Array Radar Market," which aids in identifying and referencing the specific market segment covered.
12. How do I determine which pricing option suits my needs best?
The pricing options vary based on user requirements and access needs. Individual users may opt for single-user licenses, while businesses requiring broader access may choose multi-user or enterprise licenses for cost-effective access to the report.
13. Are there any additional resources or data provided in the Electronically Scanned Array Radar Market report?
While the report offers comprehensive insights, it's advisable to review the specific contents or supplementary materials provided to ascertain if additional resources or data are available.
14. How can I stay updated on further developments or reports in the Electronically Scanned Array Radar Market?
To stay informed about further developments, trends, and reports in the Electronically Scanned Array Radar Market, consider subscribing to industry newsletters, following relevant companies and organizations, or regularly checking reputable industry news sources and publications.
Methodology
Step 1 - Identification of Relevant Samples Size from Population Database


Step 2 - Approaches for Defining Global Market Size (Value, Volume* & Price*)

Note*: In applicable scenarios
Step 3 - Data Sources
Primary Research
- Web Analytics
- Survey Reports
- Research Institute
- Latest Research Reports
- Opinion Leaders
Secondary Research
- Annual Reports
- White Paper
- Latest Press Release
- Industry Association
- Paid Database
- Investor Presentations

Step 4 - Data Triangulation
Involves using different sources of information in order to increase the validity of a study
These sources are likely to be stakeholders in a program - participants, other researchers, program staff, other community members, and so on.
Then we put all data in single framework & apply various statistical tools to find out the dynamic on the market.
During the analysis stage, feedback from the stakeholder groups would be compared to determine areas of agreement as well as areas of divergence
