

Key Insights
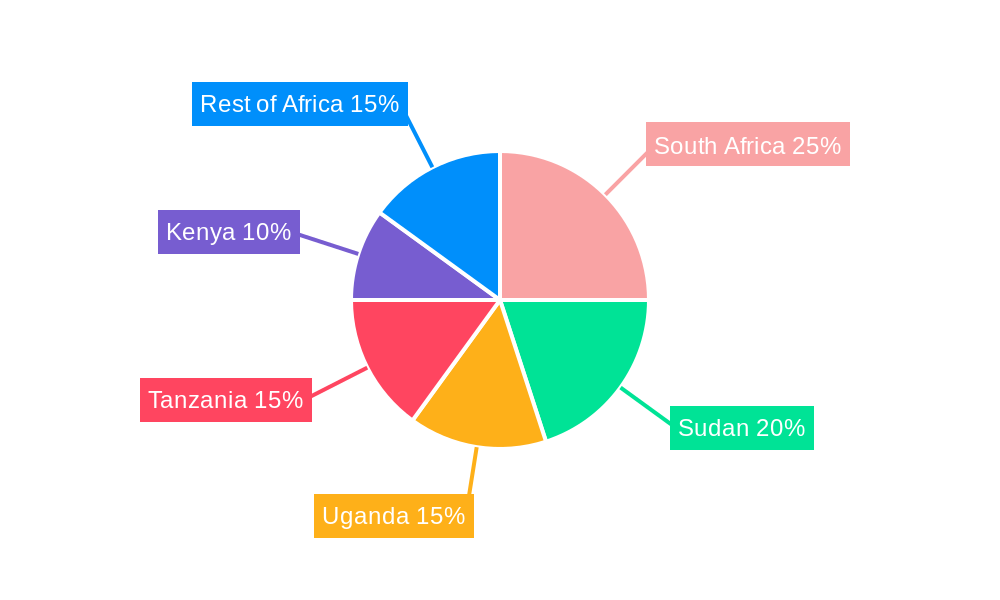
The East African oil and gas market, encompassing countries like South Africa, Sudan, Uganda, Tanzania, and Kenya, is experiencing significant growth, projected to maintain a CAGR exceeding 3% from 2025 to 2033. This expansion is fueled by several key drivers. Firstly, substantial hydrocarbon reserves, particularly in Uganda and Tanzania, are attracting significant investment and driving exploration and production activities. Secondly, growing domestic energy demand across the region, coupled with the increasing industrialization and urbanization, is creating a robust market for oil and gas products. Furthermore, supportive government policies aimed at fostering energy security and attracting foreign investment are playing a crucial role in market development. The upstream sector, comprising exploration and production, currently holds the largest market share, but the downstream sector, encompassing refining and distribution, is expected to witness considerable growth as refining capacity increases to meet rising local demand. Onshore development currently dominates, but offshore exploration is gaining momentum, particularly in deeper water areas with potential for significant discoveries.
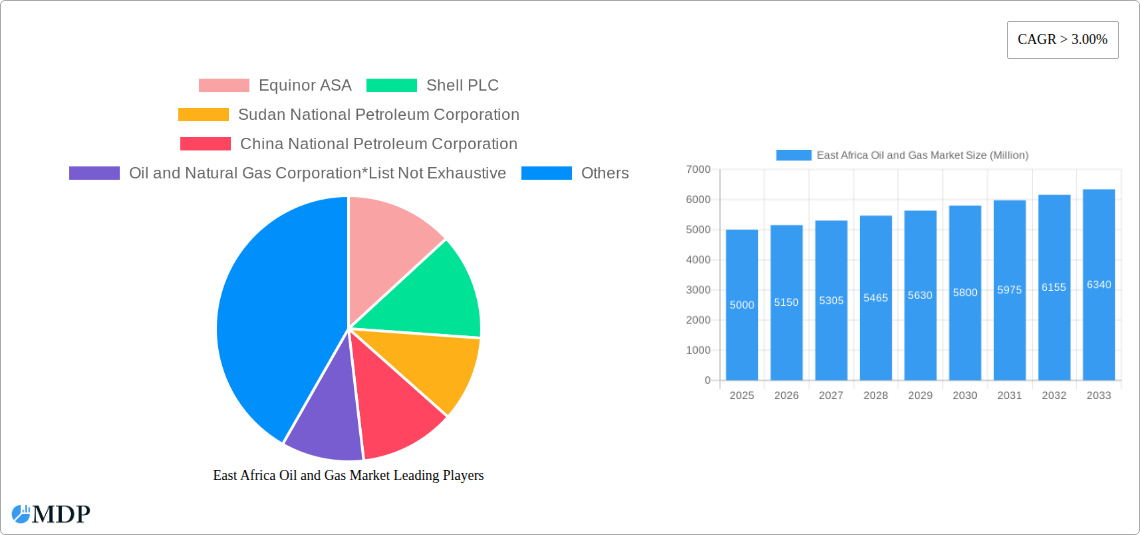
However, the market faces certain challenges. Infrastructure limitations, such as inadequate pipeline networks and transportation infrastructure, pose significant constraints on production and distribution. Furthermore, geopolitical instability in some regions and fluctuating global oil prices introduce considerable uncertainty. Competition among international and national oil companies for resources and market share also shapes the market dynamics. Despite these challenges, the long-term outlook for the East African oil and gas market remains positive. The ongoing exploration activities, coupled with the development of new infrastructure and the implementation of government policies, are expected to drive market growth and unlock the region's substantial hydrocarbon potential. The sector segmentation, encompassing upstream, midstream, and downstream activities, along with onshore and offshore developments, creates diverse investment opportunities. Key players include Equinor ASA, Shell PLC, Sudan National Petroleum Corporation, China National Petroleum Corporation, Oil and Natural Gas Corporation, and Tullow Oil PLC, although this list isn't exhaustive and many other players are involved.
East Africa Oil & Gas Market Report: 2019-2033
Uncover lucrative investment opportunities and navigate the complexities of the rapidly evolving East African oil and gas sector. This comprehensive report provides an in-depth analysis of the East Africa Oil & Gas market, covering the period from 2019 to 2033, with a focus on 2025. Benefit from detailed insights into market dynamics, industry trends, leading players, and emerging opportunities. Maximize your understanding of this dynamic market and make informed strategic decisions.
East Africa Oil and Gas Market Dynamics & Concentration
The East African oil and gas market exhibits a moderately concentrated structure, with a few major international players like Equinor ASA, Shell PLC, and Tullow Oil PLC competing alongside national oil companies such as the Sudan National Petroleum Corporation and China National Petroleum Corporation. The market share of these dominant players is estimated at xx% in 2025, with a gradual shift expected towards a more balanced landscape by 2033.
Innovation is driven by the need for enhanced oil recovery techniques in mature fields and exploration in frontier areas. Stringent regulatory frameworks, varying across countries, significantly influence operational costs and investment decisions. The market faces potential substitution pressures from renewable energy sources, albeit gradually. End-user trends are primarily shaped by regional economic growth and energy demand, with industrial and power generation sectors accounting for the majority of consumption.
M&A activity has been relatively moderate in recent years, with xx deals recorded between 2019 and 2024. Future M&A activity is predicted to increase, driven by consolidation and resource optimization strategies.
- Market Concentration (2025): xx% held by major players.
- M&A Deal Count (2019-2024): xx
- Projected M&A Activity (2025-2033): Increased due to consolidation.
East Africa Oil and Gas Market Industry Trends & Analysis
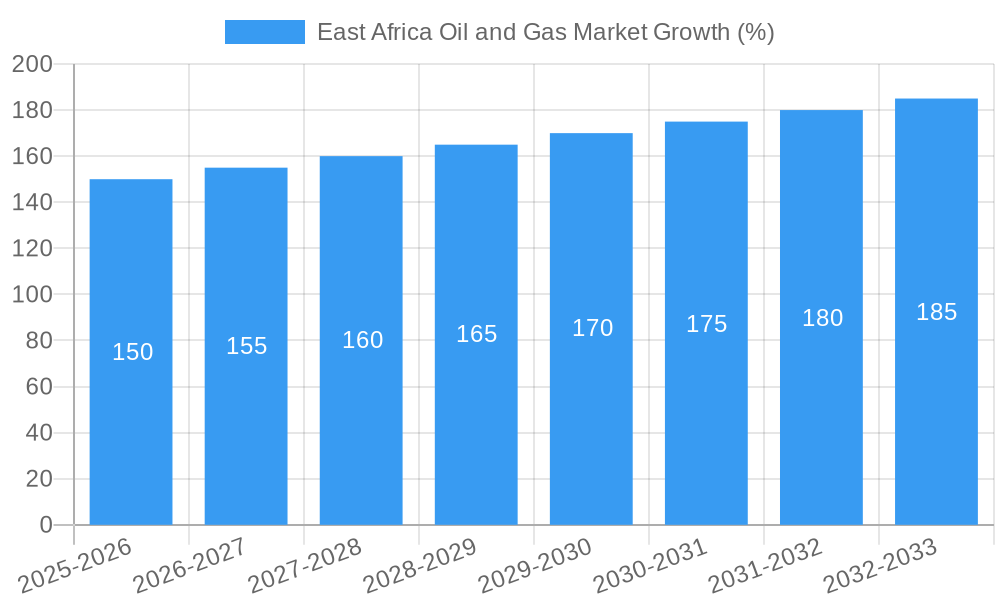
The East African oil and gas market is characterized by fluctuating growth, influenced by global oil prices, geopolitical stability, and investment decisions. The Compound Annual Growth Rate (CAGR) for the forecast period (2025-2033) is estimated at xx%, driven primarily by increasing energy demand from a growing population and industrialization. This growth, however, faces challenges such as fluctuating oil prices, regulatory hurdles, and the growing pressure to transition to renewable energy sources. Technological advancements, particularly in exploration and extraction, are playing a crucial role in improving efficiency and profitability. Market penetration of new technologies is gradually increasing, with a projected xx% adoption rate by 2033.
Consumer preferences are largely shaped by affordability and reliability of energy sources. The competitive landscape is marked by the interplay of international oil companies and national oil companies, each with distinct strategies and priorities. This dynamic interplay contributes to the market’s overall volatility, presenting both opportunities and challenges for investors and operators.
Leading Markets & Segments in East Africa Oil and Gas Market
The Upstream sector currently dominates the East African oil and gas market, accounting for approximately xx% of the total market value in 2025. Onshore developments currently lead in terms of investment and production, although offshore exploration is gaining momentum.
Key Drivers for Upstream Sector Dominance:
- Significant proven reserves in several countries.
- Relatively lower exploration and development costs compared to offshore.
- Government incentives and supportive regulatory frameworks (varying by country).
Country-Specific Analysis:
- Uganda: Major contributor due to the EACOP project and other onshore discoveries.
- Tanzania: Growing importance due to its role in the EACOP pipeline and offshore exploration activities.
- Mozambique: Emergence as a key player with significant offshore gas discoveries.
The Midstream and Downstream segments are expected to see significant growth, driven by increasing refining capacity and infrastructure development. However, these segments face challenges related to pipeline infrastructure and regional market access.
East Africa Oil and Gas Market Product Developments
Recent product innovations focus on enhancing oil recovery rates from mature fields, improving exploration techniques for deeper reservoirs, and developing more efficient refining processes. The adoption of digital technologies, including advanced analytics and automation, is improving operational efficiency and safety. These developments are largely driven by the need to optimize production costs and enhance environmental sustainability. The market fit of these new technologies is highly dependent on the regulatory environment and the economic viability of their implementation.
Key Drivers of East Africa Oil and Gas Market Growth
Several key factors drive growth in the East African oil and gas market:
- Rising Energy Demand: A rapidly growing population and industrialization are fueling energy demand.
- Significant Reserves: The region holds significant proven and potential reserves of oil and gas.
- Government Support: Several governments are actively promoting exploration and development through supportive policies and investment incentives.
- Technological Advancements: Innovations in exploration and production technologies are improving efficiency and reducing costs.
Challenges in the East Africa Oil and Gas Market Market
The East African oil and gas sector faces several challenges:
- Geopolitical Risks: Political instability in some regions can disrupt operations and investments.
- Infrastructure Gaps: Limited pipeline and transportation infrastructure increases operational costs.
- Regulatory Uncertainties: Inconsistent and evolving regulations across countries can hinder investment decisions. This uncertainty creates significant risk for investment with a projected impact of xx% reduction in overall investment in xx year.
- Environmental Concerns: Growing environmental awareness and regulations are driving the need for sustainable practices.
Emerging Opportunities in East Africa Oil and Gas Market
Significant long-term growth opportunities exist, driven by:
- Exploration in Frontier Areas: Untapped potential exists in several unexplored areas.
- Regional Integration: Improved regional cooperation can facilitate infrastructure development and market access.
- Gas Monetization: Growing demand for natural gas for power generation and industrial uses presents a significant opportunity.
- Focus on Energy Transition: The potential for developing carbon capture and storage technologies and exploring cleaner energy sources.
Leading Players in the East Africa Oil and Gas Market Sector
- Equinor ASA
- Shell PLC
- Sudan National Petroleum Corporation
- China National Petroleum Corporation
- Oil and Natural Gas Corporation
- Tullow Oil PLC *List Not Exhaustive
Key Milestones in East Africa Oil and Gas Market Industry
- November 2022: The ACP-EU Joint Parliamentary Assembly approved the EACOP pipeline project, unlocking significant investment and development in Uganda and Tanzania.
- October 2022: Sasol's exploration plans in Mozambique signal a renewed interest in the country's oil and gas potential.
Strategic Outlook for East Africa Oil and Gas Market Market
The East African oil and gas market holds significant long-term potential. Strategic investments in infrastructure development, exploration in frontier areas, and partnerships with regional players will be crucial for unlocking this potential. The focus on sustainable development and energy transition will also shape the sector's future trajectory, creating both opportunities and challenges for operators and investors alike. The market’s future hinges on effectively managing environmental concerns while capitalizing on increasing energy demand and technological advancements.
East Africa Oil and Gas Market Segmentation
-
1. Sector
- 1.1. Upstream
- 1.2. Midstream
- 1.3. Downstream
-
2. Location of Development
- 2.1. Onshore
- 2.2. Offshore
-
3. Geography
- 3.1. Mozambique
- 3.2. Tanzania
- 3.3. South Sudan
- 3.4. Kenya
- 3.5. Rest of East Africa
East Africa Oil and Gas Market Segmentation By Geography
- 1. Mozambique
- 2. Tanzania
- 3. South Sudan
- 4. Kenya
- 5. Rest of East Africa
East Africa Oil and Gas Market REPORT HIGHLIGHTS
| Aspects | Details |
|---|---|
| Study Period | 2019-2033 |
| Base Year | 2024 |
| Estimated Year | 2025 |
| Forecast Period | 2025-2033 |
| Historical Period | 2019-2024 |
| Growth Rate | CAGR of > 3.00% from 2019-2033 |
| Segmentation |
|
Table of Contents
- 1. Introduction
- 1.1. Research Scope
- 1.2. Market Segmentation
- 1.3. Research Methodology
- 1.4. Definitions and Assumptions
- 2. Executive Summary
- 2.1. Introduction
- 3. Market Dynamics
- 3.1. Introduction
- 3.2. Market Drivers
- 3.2.1. 4.; Modernization and Upgrades of Existing Military Aircraft Fleets4.; Increasing Defense Budgets
- 3.3. Market Restrains
- 3.3.1. 4.; Shift Toward Unmanned Aircraft
- 3.4. Market Trends
- 3.4.1. Midstream Sector to Witness Significant Growth
- 4. Market Factor Analysis
- 4.1. Porters Five Forces
- 4.2. Supply/Value Chain
- 4.3. PESTEL analysis
- 4.4. Market Entropy
- 4.5. Patent/Trademark Analysis
- 5. East Africa Oil and Gas Market Analysis, Insights and Forecast, 2019-2031
- 5.1. Market Analysis, Insights and Forecast - by Sector
- 5.1.1. Upstream
- 5.1.2. Midstream
- 5.1.3. Downstream
- 5.2. Market Analysis, Insights and Forecast - by Location of Development
- 5.2.1. Onshore
- 5.2.2. Offshore
- 5.3. Market Analysis, Insights and Forecast - by Geography
- 5.3.1. Mozambique
- 5.3.2. Tanzania
- 5.3.3. South Sudan
- 5.3.4. Kenya
- 5.3.5. Rest of East Africa
- 5.4. Market Analysis, Insights and Forecast - by Region
- 5.4.1. Mozambique
- 5.4.2. Tanzania
- 5.4.3. South Sudan
- 5.4.4. Kenya
- 5.4.5. Rest of East Africa
- 5.1. Market Analysis, Insights and Forecast - by Sector
- 6. Mozambique East Africa Oil and Gas Market Analysis, Insights and Forecast, 2019-2031
- 6.1. Market Analysis, Insights and Forecast - by Sector
- 6.1.1. Upstream
- 6.1.2. Midstream
- 6.1.3. Downstream
- 6.2. Market Analysis, Insights and Forecast - by Location of Development
- 6.2.1. Onshore
- 6.2.2. Offshore
- 6.3. Market Analysis, Insights and Forecast - by Geography
- 6.3.1. Mozambique
- 6.3.2. Tanzania
- 6.3.3. South Sudan
- 6.3.4. Kenya
- 6.3.5. Rest of East Africa
- 6.1. Market Analysis, Insights and Forecast - by Sector
- 7. Tanzania East Africa Oil and Gas Market Analysis, Insights and Forecast, 2019-2031
- 7.1. Market Analysis, Insights and Forecast - by Sector
- 7.1.1. Upstream
- 7.1.2. Midstream
- 7.1.3. Downstream
- 7.2. Market Analysis, Insights and Forecast - by Location of Development
- 7.2.1. Onshore
- 7.2.2. Offshore
- 7.3. Market Analysis, Insights and Forecast - by Geography
- 7.3.1. Mozambique
- 7.3.2. Tanzania
- 7.3.3. South Sudan
- 7.3.4. Kenya
- 7.3.5. Rest of East Africa
- 7.1. Market Analysis, Insights and Forecast - by Sector
- 8. South Sudan East Africa Oil and Gas Market Analysis, Insights and Forecast, 2019-2031
- 8.1. Market Analysis, Insights and Forecast - by Sector
- 8.1.1. Upstream
- 8.1.2. Midstream
- 8.1.3. Downstream
- 8.2. Market Analysis, Insights and Forecast - by Location of Development
- 8.2.1. Onshore
- 8.2.2. Offshore
- 8.3. Market Analysis, Insights and Forecast - by Geography
- 8.3.1. Mozambique
- 8.3.2. Tanzania
- 8.3.3. South Sudan
- 8.3.4. Kenya
- 8.3.5. Rest of East Africa
- 8.1. Market Analysis, Insights and Forecast - by Sector
- 9. Kenya East Africa Oil and Gas Market Analysis, Insights and Forecast, 2019-2031
- 9.1. Market Analysis, Insights and Forecast - by Sector
- 9.1.1. Upstream
- 9.1.2. Midstream
- 9.1.3. Downstream
- 9.2. Market Analysis, Insights and Forecast - by Location of Development
- 9.2.1. Onshore
- 9.2.2. Offshore
- 9.3. Market Analysis, Insights and Forecast - by Geography
- 9.3.1. Mozambique
- 9.3.2. Tanzania
- 9.3.3. South Sudan
- 9.3.4. Kenya
- 9.3.5. Rest of East Africa
- 9.1. Market Analysis, Insights and Forecast - by Sector
- 10. Rest of East Africa East Africa Oil and Gas Market Analysis, Insights and Forecast, 2019-2031
- 10.1. Market Analysis, Insights and Forecast - by Sector
- 10.1.1. Upstream
- 10.1.2. Midstream
- 10.1.3. Downstream
- 10.2. Market Analysis, Insights and Forecast - by Location of Development
- 10.2.1. Onshore
- 10.2.2. Offshore
- 10.3. Market Analysis, Insights and Forecast - by Geography
- 10.3.1. Mozambique
- 10.3.2. Tanzania
- 10.3.3. South Sudan
- 10.3.4. Kenya
- 10.3.5. Rest of East Africa
- 10.1. Market Analysis, Insights and Forecast - by Sector
- 11. South Africa East Africa Oil and Gas Market Analysis, Insights and Forecast, 2019-2031
- 12. Sudan East Africa Oil and Gas Market Analysis, Insights and Forecast, 2019-2031
- 13. Uganda East Africa Oil and Gas Market Analysis, Insights and Forecast, 2019-2031
- 14. Tanzania East Africa Oil and Gas Market Analysis, Insights and Forecast, 2019-2031
- 15. Kenya East Africa Oil and Gas Market Analysis, Insights and Forecast, 2019-2031
- 16. Rest of Africa East Africa Oil and Gas Market Analysis, Insights and Forecast, 2019-2031
- 17. Competitive Analysis
- 17.1. Market Share Analysis 2024
- 17.2. Company Profiles
- 17.2.1 Equinor ASA
- 17.2.1.1. Overview
- 17.2.1.2. Products
- 17.2.1.3. SWOT Analysis
- 17.2.1.4. Recent Developments
- 17.2.1.5. Financials (Based on Availability)
- 17.2.2 Shell PLC
- 17.2.2.1. Overview
- 17.2.2.2. Products
- 17.2.2.3. SWOT Analysis
- 17.2.2.4. Recent Developments
- 17.2.2.5. Financials (Based on Availability)
- 17.2.3 Sudan National Petroleum Corporation
- 17.2.3.1. Overview
- 17.2.3.2. Products
- 17.2.3.3. SWOT Analysis
- 17.2.3.4. Recent Developments
- 17.2.3.5. Financials (Based on Availability)
- 17.2.4 China National Petroleum Corporation
- 17.2.4.1. Overview
- 17.2.4.2. Products
- 17.2.4.3. SWOT Analysis
- 17.2.4.4. Recent Developments
- 17.2.4.5. Financials (Based on Availability)
- 17.2.5 Oil and Natural Gas Corporation*List Not Exhaustive
- 17.2.5.1. Overview
- 17.2.5.2. Products
- 17.2.5.3. SWOT Analysis
- 17.2.5.4. Recent Developments
- 17.2.5.5. Financials (Based on Availability)
- 17.2.6 Tullow Oil PLC
- 17.2.6.1. Overview
- 17.2.6.2. Products
- 17.2.6.3. SWOT Analysis
- 17.2.6.4. Recent Developments
- 17.2.6.5. Financials (Based on Availability)
- 17.2.1 Equinor ASA
List of Figures
- Figure 1: East Africa Oil and Gas Market Revenue Breakdown (Million, %) by Product 2024 & 2032
- Figure 2: East Africa Oil and Gas Market Share (%) by Company 2024
List of Tables
- Table 1: East Africa Oil and Gas Market Revenue Million Forecast, by Region 2019 & 2032
- Table 2: East Africa Oil and Gas Market Volume K Tons Forecast, by Region 2019 & 2032
- Table 3: East Africa Oil and Gas Market Revenue Million Forecast, by Sector 2019 & 2032
- Table 4: East Africa Oil and Gas Market Volume K Tons Forecast, by Sector 2019 & 2032
- Table 5: East Africa Oil and Gas Market Revenue Million Forecast, by Location of Development 2019 & 2032
- Table 6: East Africa Oil and Gas Market Volume K Tons Forecast, by Location of Development 2019 & 2032
- Table 7: East Africa Oil and Gas Market Revenue Million Forecast, by Geography 2019 & 2032
- Table 8: East Africa Oil and Gas Market Volume K Tons Forecast, by Geography 2019 & 2032
- Table 9: East Africa Oil and Gas Market Revenue Million Forecast, by Region 2019 & 2032
- Table 10: East Africa Oil and Gas Market Volume K Tons Forecast, by Region 2019 & 2032
- Table 11: East Africa Oil and Gas Market Revenue Million Forecast, by Country 2019 & 2032
- Table 12: East Africa Oil and Gas Market Volume K Tons Forecast, by Country 2019 & 2032
- Table 13: South Africa East Africa Oil and Gas Market Revenue (Million) Forecast, by Application 2019 & 2032
- Table 14: South Africa East Africa Oil and Gas Market Volume (K Tons) Forecast, by Application 2019 & 2032
- Table 15: Sudan East Africa Oil and Gas Market Revenue (Million) Forecast, by Application 2019 & 2032
- Table 16: Sudan East Africa Oil and Gas Market Volume (K Tons) Forecast, by Application 2019 & 2032
- Table 17: Uganda East Africa Oil and Gas Market Revenue (Million) Forecast, by Application 2019 & 2032
- Table 18: Uganda East Africa Oil and Gas Market Volume (K Tons) Forecast, by Application 2019 & 2032
- Table 19: Tanzania East Africa Oil and Gas Market Revenue (Million) Forecast, by Application 2019 & 2032
- Table 20: Tanzania East Africa Oil and Gas Market Volume (K Tons) Forecast, by Application 2019 & 2032
- Table 21: Kenya East Africa Oil and Gas Market Revenue (Million) Forecast, by Application 2019 & 2032
- Table 22: Kenya East Africa Oil and Gas Market Volume (K Tons) Forecast, by Application 2019 & 2032
- Table 23: Rest of Africa East Africa Oil and Gas Market Revenue (Million) Forecast, by Application 2019 & 2032
- Table 24: Rest of Africa East Africa Oil and Gas Market Volume (K Tons) Forecast, by Application 2019 & 2032
- Table 25: East Africa Oil and Gas Market Revenue Million Forecast, by Sector 2019 & 2032
- Table 26: East Africa Oil and Gas Market Volume K Tons Forecast, by Sector 2019 & 2032
- Table 27: East Africa Oil and Gas Market Revenue Million Forecast, by Location of Development 2019 & 2032
- Table 28: East Africa Oil and Gas Market Volume K Tons Forecast, by Location of Development 2019 & 2032
- Table 29: East Africa Oil and Gas Market Revenue Million Forecast, by Geography 2019 & 2032
- Table 30: East Africa Oil and Gas Market Volume K Tons Forecast, by Geography 2019 & 2032
- Table 31: East Africa Oil and Gas Market Revenue Million Forecast, by Country 2019 & 2032
- Table 32: East Africa Oil and Gas Market Volume K Tons Forecast, by Country 2019 & 2032
- Table 33: East Africa Oil and Gas Market Revenue Million Forecast, by Sector 2019 & 2032
- Table 34: East Africa Oil and Gas Market Volume K Tons Forecast, by Sector 2019 & 2032
- Table 35: East Africa Oil and Gas Market Revenue Million Forecast, by Location of Development 2019 & 2032
- Table 36: East Africa Oil and Gas Market Volume K Tons Forecast, by Location of Development 2019 & 2032
- Table 37: East Africa Oil and Gas Market Revenue Million Forecast, by Geography 2019 & 2032
- Table 38: East Africa Oil and Gas Market Volume K Tons Forecast, by Geography 2019 & 2032
- Table 39: East Africa Oil and Gas Market Revenue Million Forecast, by Country 2019 & 2032
- Table 40: East Africa Oil and Gas Market Volume K Tons Forecast, by Country 2019 & 2032
- Table 41: East Africa Oil and Gas Market Revenue Million Forecast, by Sector 2019 & 2032
- Table 42: East Africa Oil and Gas Market Volume K Tons Forecast, by Sector 2019 & 2032
- Table 43: East Africa Oil and Gas Market Revenue Million Forecast, by Location of Development 2019 & 2032
- Table 44: East Africa Oil and Gas Market Volume K Tons Forecast, by Location of Development 2019 & 2032
- Table 45: East Africa Oil and Gas Market Revenue Million Forecast, by Geography 2019 & 2032
- Table 46: East Africa Oil and Gas Market Volume K Tons Forecast, by Geography 2019 & 2032
- Table 47: East Africa Oil and Gas Market Revenue Million Forecast, by Country 2019 & 2032
- Table 48: East Africa Oil and Gas Market Volume K Tons Forecast, by Country 2019 & 2032
- Table 49: East Africa Oil and Gas Market Revenue Million Forecast, by Sector 2019 & 2032
- Table 50: East Africa Oil and Gas Market Volume K Tons Forecast, by Sector 2019 & 2032
- Table 51: East Africa Oil and Gas Market Revenue Million Forecast, by Location of Development 2019 & 2032
- Table 52: East Africa Oil and Gas Market Volume K Tons Forecast, by Location of Development 2019 & 2032
- Table 53: East Africa Oil and Gas Market Revenue Million Forecast, by Geography 2019 & 2032
- Table 54: East Africa Oil and Gas Market Volume K Tons Forecast, by Geography 2019 & 2032
- Table 55: East Africa Oil and Gas Market Revenue Million Forecast, by Country 2019 & 2032
- Table 56: East Africa Oil and Gas Market Volume K Tons Forecast, by Country 2019 & 2032
- Table 57: East Africa Oil and Gas Market Revenue Million Forecast, by Sector 2019 & 2032
- Table 58: East Africa Oil and Gas Market Volume K Tons Forecast, by Sector 2019 & 2032
- Table 59: East Africa Oil and Gas Market Revenue Million Forecast, by Location of Development 2019 & 2032
- Table 60: East Africa Oil and Gas Market Volume K Tons Forecast, by Location of Development 2019 & 2032
- Table 61: East Africa Oil and Gas Market Revenue Million Forecast, by Geography 2019 & 2032
- Table 62: East Africa Oil and Gas Market Volume K Tons Forecast, by Geography 2019 & 2032
- Table 63: East Africa Oil and Gas Market Revenue Million Forecast, by Country 2019 & 2032
- Table 64: East Africa Oil and Gas Market Volume K Tons Forecast, by Country 2019 & 2032
Frequently Asked Questions
1. What is the projected Compound Annual Growth Rate (CAGR) of the East Africa Oil and Gas Market?
The projected CAGR is approximately > 3.00%.
2. Which companies are prominent players in the East Africa Oil and Gas Market?
Key companies in the market include Equinor ASA, Shell PLC, Sudan National Petroleum Corporation, China National Petroleum Corporation, Oil and Natural Gas Corporation*List Not Exhaustive, Tullow Oil PLC.
3. What are the main segments of the East Africa Oil and Gas Market?
The market segments include Sector, Location of Development, Geography.
4. Can you provide details about the market size?
The market size is estimated to be USD XX Million as of 2022.
5. What are some drivers contributing to market growth?
4.; Modernization and Upgrades of Existing Military Aircraft Fleets4.; Increasing Defense Budgets.
6. What are the notable trends driving market growth?
Midstream Sector to Witness Significant Growth.
7. Are there any restraints impacting market growth?
4.; Shift Toward Unmanned Aircraft.
8. Can you provide examples of recent developments in the market?
November 2022: The African, Caribbean, Pacific, and European Union (ACP-EU) Joint Parliamentary Assembly overturned an earlier decision and voted to allow Uganda to develop the East African Crude Pipeline (EACOP) project. The 1,443-kilometer (897-mile)-long pipeline runs from Uganda's Western Region oil wells to Tanzania's seaport of Tanga.
9. What pricing options are available for accessing the report?
Pricing options include single-user, multi-user, and enterprise licenses priced at USD 4750, USD 5250, and USD 8750 respectively.
10. Is the market size provided in terms of value or volume?
The market size is provided in terms of value, measured in Million and volume, measured in K Tons.
11. Are there any specific market keywords associated with the report?
Yes, the market keyword associated with the report is "East Africa Oil and Gas Market," which aids in identifying and referencing the specific market segment covered.
12. How do I determine which pricing option suits my needs best?
The pricing options vary based on user requirements and access needs. Individual users may opt for single-user licenses, while businesses requiring broader access may choose multi-user or enterprise licenses for cost-effective access to the report.
13. Are there any additional resources or data provided in the East Africa Oil and Gas Market report?
While the report offers comprehensive insights, it's advisable to review the specific contents or supplementary materials provided to ascertain if additional resources or data are available.
14. How can I stay updated on further developments or reports in the East Africa Oil and Gas Market?
To stay informed about further developments, trends, and reports in the East Africa Oil and Gas Market, consider subscribing to industry newsletters, following relevant companies and organizations, or regularly checking reputable industry news sources and publications.
Methodology
Step 1 - Identification of Relevant Samples Size from Population Database


Step 2 - Approaches for Defining Global Market Size (Value, Volume* & Price*)

Note*: In applicable scenarios
Step 3 - Data Sources
Primary Research
- Web Analytics
- Survey Reports
- Research Institute
- Latest Research Reports
- Opinion Leaders
Secondary Research
- Annual Reports
- White Paper
- Latest Press Release
- Industry Association
- Paid Database
- Investor Presentations

Step 4 - Data Triangulation
Involves using different sources of information in order to increase the validity of a study
These sources are likely to be stakeholders in a program - participants, other researchers, program staff, other community members, and so on.
Then we put all data in single framework & apply various statistical tools to find out the dynamic on the market.
During the analysis stage, feedback from the stakeholder groups would be compared to determine areas of agreement as well as areas of divergence
