

Key Insights
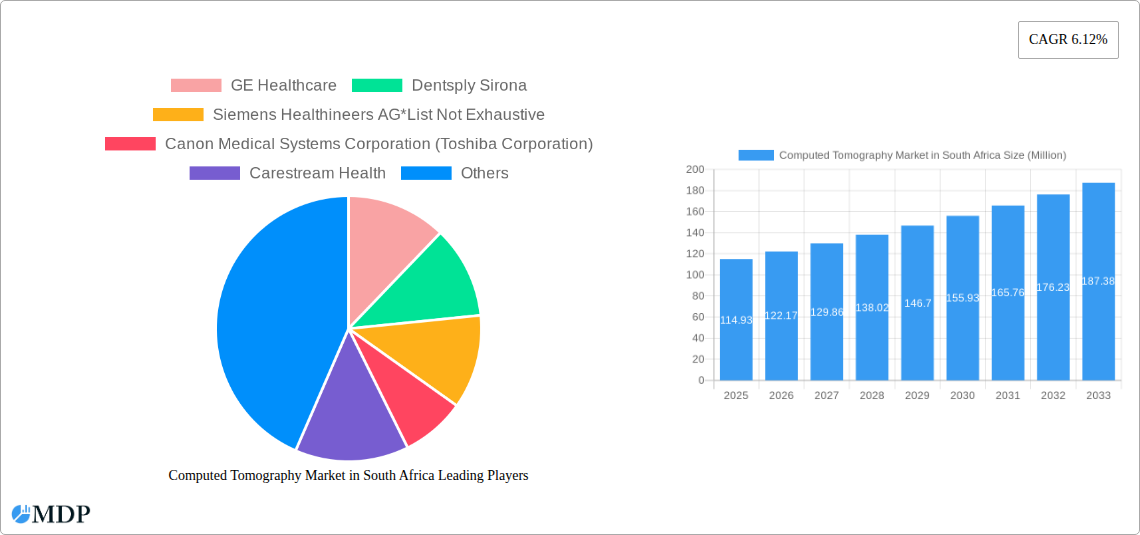
The South African computed tomography (CT) market, valued at approximately $114.93 million in 2025, is projected to experience robust growth, driven by factors such as increasing prevalence of chronic diseases (cancer, cardiovascular diseases, neurological disorders), rising healthcare expenditure, and technological advancements leading to improved image quality and faster scan times. The market is segmented by type (low, medium, and high slice CT scanners), application (oncology, neurology, cardiovascular, musculoskeletal, and other applications), and end-user (hospitals and diagnostic centers). The high slice CT scanner segment is expected to dominate due to its superior imaging capabilities and diagnostic accuracy. Hospitals constitute the largest end-user segment, reflecting their crucial role in providing advanced diagnostic services. Key players like GE Healthcare, Siemens Healthineers, and Canon Medical Systems are vying for market share, investing in innovation and expanding their service networks. Growth will be influenced by government healthcare initiatives, private sector investment in healthcare infrastructure, and the ongoing training and development of skilled radiologists and technicians. Challenges include the high cost of equipment and maintenance, and the need for addressing healthcare disparities across different regions within South Africa. The market's growth trajectory suggests a positive outlook for the next decade, with the potential for increased market penetration and expansion in underserved areas.
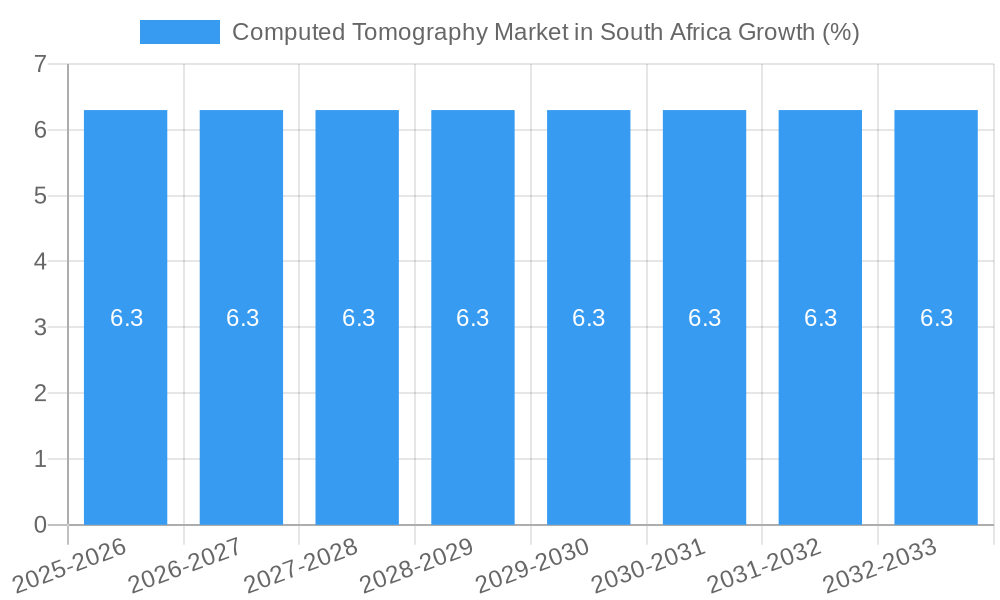
The South African CT market’s 6.12% CAGR (2025-2033) indicates steady growth. This growth will be fueled by rising demand for advanced diagnostics among an aging population and increasing awareness of preventative healthcare. The market will see competitive activity from established multinational companies, alongside opportunities for local distributors and service providers. However, limitations such as infrastructure constraints in certain regions and potential regulatory hurdles could moderate growth. The ongoing development of artificial intelligence (AI)-powered image analysis tools within CT technology is expected to further increase efficiency and diagnostic accuracy, driving further investment and market expansion. Focusing on strategic partnerships between healthcare providers and technology companies will be crucial for maximizing the benefits of this growing market. Future market success hinges on enhancing accessibility, affordability, and skilled personnel training to fully leverage the potential of CT technology in South Africa.
Computed Tomography Market in South Africa: A Comprehensive Market Report (2019-2033)
This comprehensive report provides an in-depth analysis of the Computed Tomography (CT) market in South Africa, offering valuable insights for industry stakeholders, investors, and market entrants. Covering the period from 2019 to 2033, with a focus on 2025, this report unveils market dynamics, trends, leading players, and future growth prospects. The report leverages robust data and insightful analysis to paint a clear picture of this vital healthcare sector in South Africa.
Computed Tomography Market in South Africa Market Dynamics & Concentration
The South African CT market is characterized by moderate concentration, with key players like GE Healthcare, Dentsply Sirona, Siemens Healthineers AG, Canon Medical Systems Corporation (Toshiba Corporation), Carestream Health, Koninklijke Philips NV, and Fujifilm Holdings Corporation vying for market share. The market's dynamism is influenced by several factors:
- Innovation Drivers: Continuous advancements in CT technology, such as multi-slice CT scanners and AI-powered image analysis, are driving market growth. The demand for faster, higher-resolution imaging is a key driver.
- Regulatory Framework: The South African regulatory environment plays a significant role, impacting market access and pricing strategies. Stringent regulations concerning medical device approvals and healthcare reimbursements influence market dynamics.
- Product Substitutes: While CT remains a dominant imaging modality, the presence of alternative technologies like MRI and ultrasound creates competitive pressures. The choice between these modalities depends largely on the specific clinical application.
- End-User Trends: Hospitals constitute the largest end-user segment, followed by diagnostic centers. Growth is driven by increasing healthcare spending and a rising prevalence of chronic diseases requiring CT scans.
- M&A Activities: The market has witnessed notable mergers and acquisitions, such as Life Healthcare’s acquisition of East Coast Radiology in 2022, indicating consolidation and expansion strategies among key players. The estimated number of M&A deals in the past five years is xx. The estimated market share of the top 3 players in 2025 is xx%.
Computed Tomography Market in South Africa Industry Trends & Analysis
The South African CT market exhibits a steady growth trajectory, driven by several factors. The market’s Compound Annual Growth Rate (CAGR) from 2025 to 2033 is estimated at xx%. Market penetration is increasing, driven by:
- Rising Prevalence of Chronic Diseases: The increasing incidence of cancer, cardiovascular diseases, and neurological disorders fuels the demand for CT scans for diagnosis and treatment monitoring.
- Technological Advancements: The introduction of advanced CT technologies, including multi-slice scanners and advanced image reconstruction techniques, has improved diagnostic accuracy and efficiency.
- Government Initiatives: Government initiatives aimed at improving healthcare infrastructure and access to advanced medical technologies are stimulating market growth.
- Increasing Healthcare Expenditure: A rising disposable income and increased government spending on healthcare contribute to higher healthcare expenditure, supporting CT market expansion.
- Competitive Dynamics: Intense competition among key players drives innovation and fosters price competitiveness, benefiting end-users.
Leading Markets & Segments in Computed Tomography Market in South Africa
The South African CT market is broadly segmented by type (Low Slice, Medium Slice, High Slice), application (Oncology, Neurology, Cardiovascular, Musculoskeletal, Other Applications), and end-user (Hospitals, Diagnostic Centers, Other End Users).
- By Type: High-slice CT scanners hold the largest market share due to their superior image quality and speed. The segment is projected to grow at a CAGR of xx% during the forecast period.
- By Application: Oncology applications account for a significant portion of the market, driven by the increasing incidence of cancer. Cardiovascular applications are also a major segment due to the high prevalence of heart disease.
- By End-User: Hospitals dominate the market, owing to their higher diagnostic capabilities and volume of patients. Growth in this segment is primarily driven by investments in advanced medical infrastructure.
Key Drivers for Dominant Segments:
- Oncology: High prevalence of cancer, improved diagnostic accuracy of CT scans for cancer detection and staging.
- Hospitals: High patient volume, advanced diagnostic capabilities, availability of skilled professionals.
- High-Slice CT: Superior image quality, faster scan times, enhanced diagnostic capabilities.
Computed Tomography Market in South Africa Product Developments
Recent product developments focus on improving image quality, reducing radiation dose, and integrating AI for automated image analysis. Manufacturers are incorporating advanced features like iterative reconstruction techniques, metal artifact reduction algorithms, and improved user interfaces to enhance diagnostic accuracy and workflow efficiency. These innovations are aimed at improving patient care and addressing market demand for sophisticated CT imaging solutions.
Key Drivers of Computed Tomography Market in South Africa Growth
The South African CT market's growth is fueled by several key factors:
- Technological advancements: The continuous development of advanced CT scanners with improved image quality and reduced radiation exposure.
- Increasing prevalence of chronic diseases: The rise in cancer, cardiovascular diseases, and other chronic conditions requiring CT scans for diagnosis and treatment.
- Government initiatives to improve healthcare infrastructure: Investments in healthcare infrastructure and improved access to diagnostic imaging facilities are bolstering market growth.
Challenges in the Computed Tomography Market in South Africa Market
The market faces challenges such as:
- High cost of CT scanners: The high initial investment cost of advanced CT scanners can be a barrier for smaller hospitals and clinics.
- Limited skilled professionals: A shortage of trained radiologists and technicians can hinder the efficient utilization of CT scanners.
- Reimbursement policies: Reimbursement policies and insurance coverage for CT scans can impact market growth.
Emerging Opportunities in Computed Tomography Market in South Africa
The South African CT market presents promising opportunities. The increasing adoption of AI in medical imaging, strategic partnerships between healthcare providers and technology companies, and the expansion of private healthcare facilities present significant growth catalysts. Furthermore, government initiatives to promote healthcare access and affordability could unlock substantial market potential.
Leading Players in the Computed Tomography Market in South Africa Sector
- GE Healthcare
- Dentsply Sirona
- Siemens Healthineers AG
- Canon Medical Systems Corporation (Toshiba Corporation)
- Carestream Health
- Koninklijke Philips NV
- Fujifilm Holdings Corporation
Key Milestones in Computed Tomography Market in South Africa Industry
- August 2021: IFC and Bergman, Ross, and Partners Incorporated (BRP) partnered to enhance medical diagnostic services, including CT scan capabilities. This partnership boosted the availability of advanced diagnostic services.
- February 2022: Life Healthcare's acquisition of East Coast Radiology's imaging operations expanded its CT services in the Eastern Cape, increasing market consolidation.
Strategic Outlook for Computed Tomography Market in South Africa Market
The future of the South African CT market looks bright, with significant growth potential driven by technological innovation, increasing healthcare spending, and the rising prevalence of chronic diseases. Strategic partnerships, investments in advanced technologies, and focus on improving access to quality healthcare will be crucial for market players to capitalize on emerging opportunities. The market is poised for continued expansion, presenting substantial growth potential for both established and new entrants.
Computed Tomography Market in South Africa Segmentation
-
1. Type
- 1.1. Low Slice
- 1.2. Medium Slice
- 1.3. High Slice
-
2. Application
- 2.1. Oncology
- 2.2. Neurology
- 2.3. Cardiovascular
- 2.4. Musculoskeletal
- 2.5. Other Applications
-
3. End User
- 3.1. Hospitals
- 3.2. Diagnostic Centers
- 3.3. Other End Users
Computed Tomography Market in South Africa Segmentation By Geography
-
1. North America
- 1.1. United States
- 1.2. Canada
- 1.3. Mexico
-
2. South America
- 2.1. Brazil
- 2.2. Argentina
- 2.3. Rest of South America
-
3. Europe
- 3.1. United Kingdom
- 3.2. Germany
- 3.3. France
- 3.4. Italy
- 3.5. Spain
- 3.6. Russia
- 3.7. Benelux
- 3.8. Nordics
- 3.9. Rest of Europe
-
4. Middle East & Africa
- 4.1. Turkey
- 4.2. Israel
- 4.3. GCC
- 4.4. North Africa
- 4.5. South Africa
- 4.6. Rest of Middle East & Africa
-
5. Asia Pacific
- 5.1. China
- 5.2. India
- 5.3. Japan
- 5.4. South Korea
- 5.5. ASEAN
- 5.6. Oceania
- 5.7. Rest of Asia Pacific
Computed Tomography Market in South Africa REPORT HIGHLIGHTS
| Aspects | Details |
|---|---|
| Study Period | 2019-2033 |
| Base Year | 2024 |
| Estimated Year | 2025 |
| Forecast Period | 2025-2033 |
| Historical Period | 2019-2024 |
| Growth Rate | CAGR of 6.12% from 2019-2033 |
| Segmentation |
|
Table of Contents
- 1. Introduction
- 1.1. Research Scope
- 1.2. Market Segmentation
- 1.3. Research Methodology
- 1.4. Definitions and Assumptions
- 2. Executive Summary
- 2.1. Introduction
- 3. Market Dynamics
- 3.1. Introduction
- 3.2. Market Drivers
- 3.2.1. Increasing Prevalence of Chronic Diseases; Rising Geriatric Population; Increasing Technological Advancements
- 3.3. Market Restrains
- 3.3.1. Lack Of Proper Reimbursement And Stringent Regulatory Approval Procedures; High Cost of Equipment
- 3.4. Market Trends
- 3.4.1. Oncology Segment is Expected to Hold a Significant Market Share Over the Forecast Period
- 4. Market Factor Analysis
- 4.1. Porters Five Forces
- 4.2. Supply/Value Chain
- 4.3. PESTEL analysis
- 4.4. Market Entropy
- 4.5. Patent/Trademark Analysis
- 5. Global Computed Tomography Market in South Africa Analysis, Insights and Forecast, 2019-2031
- 5.1. Market Analysis, Insights and Forecast - by Type
- 5.1.1. Low Slice
- 5.1.2. Medium Slice
- 5.1.3. High Slice
- 5.2. Market Analysis, Insights and Forecast - by Application
- 5.2.1. Oncology
- 5.2.2. Neurology
- 5.2.3. Cardiovascular
- 5.2.4. Musculoskeletal
- 5.2.5. Other Applications
- 5.3. Market Analysis, Insights and Forecast - by End User
- 5.3.1. Hospitals
- 5.3.2. Diagnostic Centers
- 5.3.3. Other End Users
- 5.4. Market Analysis, Insights and Forecast - by Region
- 5.4.1. North America
- 5.4.2. South America
- 5.4.3. Europe
- 5.4.4. Middle East & Africa
- 5.4.5. Asia Pacific
- 5.1. Market Analysis, Insights and Forecast - by Type
- 6. North America Computed Tomography Market in South Africa Analysis, Insights and Forecast, 2019-2031
- 6.1. Market Analysis, Insights and Forecast - by Type
- 6.1.1. Low Slice
- 6.1.2. Medium Slice
- 6.1.3. High Slice
- 6.2. Market Analysis, Insights and Forecast - by Application
- 6.2.1. Oncology
- 6.2.2. Neurology
- 6.2.3. Cardiovascular
- 6.2.4. Musculoskeletal
- 6.2.5. Other Applications
- 6.3. Market Analysis, Insights and Forecast - by End User
- 6.3.1. Hospitals
- 6.3.2. Diagnostic Centers
- 6.3.3. Other End Users
- 6.1. Market Analysis, Insights and Forecast - by Type
- 7. South America Computed Tomography Market in South Africa Analysis, Insights and Forecast, 2019-2031
- 7.1. Market Analysis, Insights and Forecast - by Type
- 7.1.1. Low Slice
- 7.1.2. Medium Slice
- 7.1.3. High Slice
- 7.2. Market Analysis, Insights and Forecast - by Application
- 7.2.1. Oncology
- 7.2.2. Neurology
- 7.2.3. Cardiovascular
- 7.2.4. Musculoskeletal
- 7.2.5. Other Applications
- 7.3. Market Analysis, Insights and Forecast - by End User
- 7.3.1. Hospitals
- 7.3.2. Diagnostic Centers
- 7.3.3. Other End Users
- 7.1. Market Analysis, Insights and Forecast - by Type
- 8. Europe Computed Tomography Market in South Africa Analysis, Insights and Forecast, 2019-2031
- 8.1. Market Analysis, Insights and Forecast - by Type
- 8.1.1. Low Slice
- 8.1.2. Medium Slice
- 8.1.3. High Slice
- 8.2. Market Analysis, Insights and Forecast - by Application
- 8.2.1. Oncology
- 8.2.2. Neurology
- 8.2.3. Cardiovascular
- 8.2.4. Musculoskeletal
- 8.2.5. Other Applications
- 8.3. Market Analysis, Insights and Forecast - by End User
- 8.3.1. Hospitals
- 8.3.2. Diagnostic Centers
- 8.3.3. Other End Users
- 8.1. Market Analysis, Insights and Forecast - by Type
- 9. Middle East & Africa Computed Tomography Market in South Africa Analysis, Insights and Forecast, 2019-2031
- 9.1. Market Analysis, Insights and Forecast - by Type
- 9.1.1. Low Slice
- 9.1.2. Medium Slice
- 9.1.3. High Slice
- 9.2. Market Analysis, Insights and Forecast - by Application
- 9.2.1. Oncology
- 9.2.2. Neurology
- 9.2.3. Cardiovascular
- 9.2.4. Musculoskeletal
- 9.2.5. Other Applications
- 9.3. Market Analysis, Insights and Forecast - by End User
- 9.3.1. Hospitals
- 9.3.2. Diagnostic Centers
- 9.3.3. Other End Users
- 9.1. Market Analysis, Insights and Forecast - by Type
- 10. Asia Pacific Computed Tomography Market in South Africa Analysis, Insights and Forecast, 2019-2031
- 10.1. Market Analysis, Insights and Forecast - by Type
- 10.1.1. Low Slice
- 10.1.2. Medium Slice
- 10.1.3. High Slice
- 10.2. Market Analysis, Insights and Forecast - by Application
- 10.2.1. Oncology
- 10.2.2. Neurology
- 10.2.3. Cardiovascular
- 10.2.4. Musculoskeletal
- 10.2.5. Other Applications
- 10.3. Market Analysis, Insights and Forecast - by End User
- 10.3.1. Hospitals
- 10.3.2. Diagnostic Centers
- 10.3.3. Other End Users
- 10.1. Market Analysis, Insights and Forecast - by Type
- 11. South Africa Computed Tomography Market in South Africa Analysis, Insights and Forecast, 2019-2031
- 12. Sudan Computed Tomography Market in South Africa Analysis, Insights and Forecast, 2019-2031
- 13. Uganda Computed Tomography Market in South Africa Analysis, Insights and Forecast, 2019-2031
- 14. Tanzania Computed Tomography Market in South Africa Analysis, Insights and Forecast, 2019-2031
- 15. Kenya Computed Tomography Market in South Africa Analysis, Insights and Forecast, 2019-2031
- 16. Rest of Africa Computed Tomography Market in South Africa Analysis, Insights and Forecast, 2019-2031
- 17. Competitive Analysis
- 17.1. Global Market Share Analysis 2024
- 17.2. Company Profiles
- 17.2.1 GE Healthcare
- 17.2.1.1. Overview
- 17.2.1.2. Products
- 17.2.1.3. SWOT Analysis
- 17.2.1.4. Recent Developments
- 17.2.1.5. Financials (Based on Availability)
- 17.2.2 Dentsply Sirona
- 17.2.2.1. Overview
- 17.2.2.2. Products
- 17.2.2.3. SWOT Analysis
- 17.2.2.4. Recent Developments
- 17.2.2.5. Financials (Based on Availability)
- 17.2.3 Siemens Healthineers AG*List Not Exhaustive
- 17.2.3.1. Overview
- 17.2.3.2. Products
- 17.2.3.3. SWOT Analysis
- 17.2.3.4. Recent Developments
- 17.2.3.5. Financials (Based on Availability)
- 17.2.4 Canon Medical Systems Corporation (Toshiba Corporation)
- 17.2.4.1. Overview
- 17.2.4.2. Products
- 17.2.4.3. SWOT Analysis
- 17.2.4.4. Recent Developments
- 17.2.4.5. Financials (Based on Availability)
- 17.2.5 Carestream Health
- 17.2.5.1. Overview
- 17.2.5.2. Products
- 17.2.5.3. SWOT Analysis
- 17.2.5.4. Recent Developments
- 17.2.5.5. Financials (Based on Availability)
- 17.2.6 Koninklijke Philips NV
- 17.2.6.1. Overview
- 17.2.6.2. Products
- 17.2.6.3. SWOT Analysis
- 17.2.6.4. Recent Developments
- 17.2.6.5. Financials (Based on Availability)
- 17.2.7 Fujifilm Holdings Corporation
- 17.2.7.1. Overview
- 17.2.7.2. Products
- 17.2.7.3. SWOT Analysis
- 17.2.7.4. Recent Developments
- 17.2.7.5. Financials (Based on Availability)
- 17.2.1 GE Healthcare
List of Figures
- Figure 1: Global Computed Tomography Market in South Africa Revenue Breakdown (Million, %) by Region 2024 & 2032
- Figure 2: Africa Computed Tomography Market in South Africa Revenue (Million), by Country 2024 & 2032
- Figure 3: Africa Computed Tomography Market in South Africa Revenue Share (%), by Country 2024 & 2032
- Figure 4: North America Computed Tomography Market in South Africa Revenue (Million), by Type 2024 & 2032
- Figure 5: North America Computed Tomography Market in South Africa Revenue Share (%), by Type 2024 & 2032
- Figure 6: North America Computed Tomography Market in South Africa Revenue (Million), by Application 2024 & 2032
- Figure 7: North America Computed Tomography Market in South Africa Revenue Share (%), by Application 2024 & 2032
- Figure 8: North America Computed Tomography Market in South Africa Revenue (Million), by End User 2024 & 2032
- Figure 9: North America Computed Tomography Market in South Africa Revenue Share (%), by End User 2024 & 2032
- Figure 10: North America Computed Tomography Market in South Africa Revenue (Million), by Country 2024 & 2032
- Figure 11: North America Computed Tomography Market in South Africa Revenue Share (%), by Country 2024 & 2032
- Figure 12: South America Computed Tomography Market in South Africa Revenue (Million), by Type 2024 & 2032
- Figure 13: South America Computed Tomography Market in South Africa Revenue Share (%), by Type 2024 & 2032
- Figure 14: South America Computed Tomography Market in South Africa Revenue (Million), by Application 2024 & 2032
- Figure 15: South America Computed Tomography Market in South Africa Revenue Share (%), by Application 2024 & 2032
- Figure 16: South America Computed Tomography Market in South Africa Revenue (Million), by End User 2024 & 2032
- Figure 17: South America Computed Tomography Market in South Africa Revenue Share (%), by End User 2024 & 2032
- Figure 18: South America Computed Tomography Market in South Africa Revenue (Million), by Country 2024 & 2032
- Figure 19: South America Computed Tomography Market in South Africa Revenue Share (%), by Country 2024 & 2032
- Figure 20: Europe Computed Tomography Market in South Africa Revenue (Million), by Type 2024 & 2032
- Figure 21: Europe Computed Tomography Market in South Africa Revenue Share (%), by Type 2024 & 2032
- Figure 22: Europe Computed Tomography Market in South Africa Revenue (Million), by Application 2024 & 2032
- Figure 23: Europe Computed Tomography Market in South Africa Revenue Share (%), by Application 2024 & 2032
- Figure 24: Europe Computed Tomography Market in South Africa Revenue (Million), by End User 2024 & 2032
- Figure 25: Europe Computed Tomography Market in South Africa Revenue Share (%), by End User 2024 & 2032
- Figure 26: Europe Computed Tomography Market in South Africa Revenue (Million), by Country 2024 & 2032
- Figure 27: Europe Computed Tomography Market in South Africa Revenue Share (%), by Country 2024 & 2032
- Figure 28: Middle East & Africa Computed Tomography Market in South Africa Revenue (Million), by Type 2024 & 2032
- Figure 29: Middle East & Africa Computed Tomography Market in South Africa Revenue Share (%), by Type 2024 & 2032
- Figure 30: Middle East & Africa Computed Tomography Market in South Africa Revenue (Million), by Application 2024 & 2032
- Figure 31: Middle East & Africa Computed Tomography Market in South Africa Revenue Share (%), by Application 2024 & 2032
- Figure 32: Middle East & Africa Computed Tomography Market in South Africa Revenue (Million), by End User 2024 & 2032
- Figure 33: Middle East & Africa Computed Tomography Market in South Africa Revenue Share (%), by End User 2024 & 2032
- Figure 34: Middle East & Africa Computed Tomography Market in South Africa Revenue (Million), by Country 2024 & 2032
- Figure 35: Middle East & Africa Computed Tomography Market in South Africa Revenue Share (%), by Country 2024 & 2032
- Figure 36: Asia Pacific Computed Tomography Market in South Africa Revenue (Million), by Type 2024 & 2032
- Figure 37: Asia Pacific Computed Tomography Market in South Africa Revenue Share (%), by Type 2024 & 2032
- Figure 38: Asia Pacific Computed Tomography Market in South Africa Revenue (Million), by Application 2024 & 2032
- Figure 39: Asia Pacific Computed Tomography Market in South Africa Revenue Share (%), by Application 2024 & 2032
- Figure 40: Asia Pacific Computed Tomography Market in South Africa Revenue (Million), by End User 2024 & 2032
- Figure 41: Asia Pacific Computed Tomography Market in South Africa Revenue Share (%), by End User 2024 & 2032
- Figure 42: Asia Pacific Computed Tomography Market in South Africa Revenue (Million), by Country 2024 & 2032
- Figure 43: Asia Pacific Computed Tomography Market in South Africa Revenue Share (%), by Country 2024 & 2032
List of Tables
- Table 1: Global Computed Tomography Market in South Africa Revenue Million Forecast, by Region 2019 & 2032
- Table 2: Global Computed Tomography Market in South Africa Revenue Million Forecast, by Type 2019 & 2032
- Table 3: Global Computed Tomography Market in South Africa Revenue Million Forecast, by Application 2019 & 2032
- Table 4: Global Computed Tomography Market in South Africa Revenue Million Forecast, by End User 2019 & 2032
- Table 5: Global Computed Tomography Market in South Africa Revenue Million Forecast, by Region 2019 & 2032
- Table 6: Global Computed Tomography Market in South Africa Revenue Million Forecast, by Country 2019 & 2032
- Table 7: South Africa Computed Tomography Market in South Africa Revenue (Million) Forecast, by Application 2019 & 2032
- Table 8: Sudan Computed Tomography Market in South Africa Revenue (Million) Forecast, by Application 2019 & 2032
- Table 9: Uganda Computed Tomography Market in South Africa Revenue (Million) Forecast, by Application 2019 & 2032
- Table 10: Tanzania Computed Tomography Market in South Africa Revenue (Million) Forecast, by Application 2019 & 2032
- Table 11: Kenya Computed Tomography Market in South Africa Revenue (Million) Forecast, by Application 2019 & 2032
- Table 12: Rest of Africa Computed Tomography Market in South Africa Revenue (Million) Forecast, by Application 2019 & 2032
- Table 13: Global Computed Tomography Market in South Africa Revenue Million Forecast, by Type 2019 & 2032
- Table 14: Global Computed Tomography Market in South Africa Revenue Million Forecast, by Application 2019 & 2032
- Table 15: Global Computed Tomography Market in South Africa Revenue Million Forecast, by End User 2019 & 2032
- Table 16: Global Computed Tomography Market in South Africa Revenue Million Forecast, by Country 2019 & 2032
- Table 17: United States Computed Tomography Market in South Africa Revenue (Million) Forecast, by Application 2019 & 2032
- Table 18: Canada Computed Tomography Market in South Africa Revenue (Million) Forecast, by Application 2019 & 2032
- Table 19: Mexico Computed Tomography Market in South Africa Revenue (Million) Forecast, by Application 2019 & 2032
- Table 20: Global Computed Tomography Market in South Africa Revenue Million Forecast, by Type 2019 & 2032
- Table 21: Global Computed Tomography Market in South Africa Revenue Million Forecast, by Application 2019 & 2032
- Table 22: Global Computed Tomography Market in South Africa Revenue Million Forecast, by End User 2019 & 2032
- Table 23: Global Computed Tomography Market in South Africa Revenue Million Forecast, by Country 2019 & 2032
- Table 24: Brazil Computed Tomography Market in South Africa Revenue (Million) Forecast, by Application 2019 & 2032
- Table 25: Argentina Computed Tomography Market in South Africa Revenue (Million) Forecast, by Application 2019 & 2032
- Table 26: Rest of South America Computed Tomography Market in South Africa Revenue (Million) Forecast, by Application 2019 & 2032
- Table 27: Global Computed Tomography Market in South Africa Revenue Million Forecast, by Type 2019 & 2032
- Table 28: Global Computed Tomography Market in South Africa Revenue Million Forecast, by Application 2019 & 2032
- Table 29: Global Computed Tomography Market in South Africa Revenue Million Forecast, by End User 2019 & 2032
- Table 30: Global Computed Tomography Market in South Africa Revenue Million Forecast, by Country 2019 & 2032
- Table 31: United Kingdom Computed Tomography Market in South Africa Revenue (Million) Forecast, by Application 2019 & 2032
- Table 32: Germany Computed Tomography Market in South Africa Revenue (Million) Forecast, by Application 2019 & 2032
- Table 33: France Computed Tomography Market in South Africa Revenue (Million) Forecast, by Application 2019 & 2032
- Table 34: Italy Computed Tomography Market in South Africa Revenue (Million) Forecast, by Application 2019 & 2032
- Table 35: Spain Computed Tomography Market in South Africa Revenue (Million) Forecast, by Application 2019 & 2032
- Table 36: Russia Computed Tomography Market in South Africa Revenue (Million) Forecast, by Application 2019 & 2032
- Table 37: Benelux Computed Tomography Market in South Africa Revenue (Million) Forecast, by Application 2019 & 2032
- Table 38: Nordics Computed Tomography Market in South Africa Revenue (Million) Forecast, by Application 2019 & 2032
- Table 39: Rest of Europe Computed Tomography Market in South Africa Revenue (Million) Forecast, by Application 2019 & 2032
- Table 40: Global Computed Tomography Market in South Africa Revenue Million Forecast, by Type 2019 & 2032
- Table 41: Global Computed Tomography Market in South Africa Revenue Million Forecast, by Application 2019 & 2032
- Table 42: Global Computed Tomography Market in South Africa Revenue Million Forecast, by End User 2019 & 2032
- Table 43: Global Computed Tomography Market in South Africa Revenue Million Forecast, by Country 2019 & 2032
- Table 44: Turkey Computed Tomography Market in South Africa Revenue (Million) Forecast, by Application 2019 & 2032
- Table 45: Israel Computed Tomography Market in South Africa Revenue (Million) Forecast, by Application 2019 & 2032
- Table 46: GCC Computed Tomography Market in South Africa Revenue (Million) Forecast, by Application 2019 & 2032
- Table 47: North Africa Computed Tomography Market in South Africa Revenue (Million) Forecast, by Application 2019 & 2032
- Table 48: South Africa Computed Tomography Market in South Africa Revenue (Million) Forecast, by Application 2019 & 2032
- Table 49: Rest of Middle East & Africa Computed Tomography Market in South Africa Revenue (Million) Forecast, by Application 2019 & 2032
- Table 50: Global Computed Tomography Market in South Africa Revenue Million Forecast, by Type 2019 & 2032
- Table 51: Global Computed Tomography Market in South Africa Revenue Million Forecast, by Application 2019 & 2032
- Table 52: Global Computed Tomography Market in South Africa Revenue Million Forecast, by End User 2019 & 2032
- Table 53: Global Computed Tomography Market in South Africa Revenue Million Forecast, by Country 2019 & 2032
- Table 54: China Computed Tomography Market in South Africa Revenue (Million) Forecast, by Application 2019 & 2032
- Table 55: India Computed Tomography Market in South Africa Revenue (Million) Forecast, by Application 2019 & 2032
- Table 56: Japan Computed Tomography Market in South Africa Revenue (Million) Forecast, by Application 2019 & 2032
- Table 57: South Korea Computed Tomography Market in South Africa Revenue (Million) Forecast, by Application 2019 & 2032
- Table 58: ASEAN Computed Tomography Market in South Africa Revenue (Million) Forecast, by Application 2019 & 2032
- Table 59: Oceania Computed Tomography Market in South Africa Revenue (Million) Forecast, by Application 2019 & 2032
- Table 60: Rest of Asia Pacific Computed Tomography Market in South Africa Revenue (Million) Forecast, by Application 2019 & 2032
Frequently Asked Questions
1. What is the projected Compound Annual Growth Rate (CAGR) of the Computed Tomography Market in South Africa?
The projected CAGR is approximately 6.12%.
2. Which companies are prominent players in the Computed Tomography Market in South Africa?
Key companies in the market include GE Healthcare, Dentsply Sirona, Siemens Healthineers AG*List Not Exhaustive, Canon Medical Systems Corporation (Toshiba Corporation), Carestream Health, Koninklijke Philips NV, Fujifilm Holdings Corporation.
3. What are the main segments of the Computed Tomography Market in South Africa?
The market segments include Type, Application, End User.
4. Can you provide details about the market size?
The market size is estimated to be USD 114.93 Million as of 2022.
5. What are some drivers contributing to market growth?
Increasing Prevalence of Chronic Diseases; Rising Geriatric Population; Increasing Technological Advancements.
6. What are the notable trends driving market growth?
Oncology Segment is Expected to Hold a Significant Market Share Over the Forecast Period.
7. Are there any restraints impacting market growth?
Lack Of Proper Reimbursement And Stringent Regulatory Approval Procedures; High Cost of Equipment.
8. Can you provide examples of recent developments in the market?
In February 2022, in an effort to expand and diversify its portfolio across its southern African operations, Life Healthcare, a healthcare provider in South Africa acquired the non-clinical imaging operations of East Coast Radiology, a radiology practice operating at four of Life Healthcare's Eastern Cape hospitals.
9. What pricing options are available for accessing the report?
Pricing options include single-user, multi-user, and enterprise licenses priced at USD 3800, USD 4500, and USD 5800 respectively.
10. Is the market size provided in terms of value or volume?
The market size is provided in terms of value, measured in Million.
11. Are there any specific market keywords associated with the report?
Yes, the market keyword associated with the report is "Computed Tomography Market in South Africa," which aids in identifying and referencing the specific market segment covered.
12. How do I determine which pricing option suits my needs best?
The pricing options vary based on user requirements and access needs. Individual users may opt for single-user licenses, while businesses requiring broader access may choose multi-user or enterprise licenses for cost-effective access to the report.
13. Are there any additional resources or data provided in the Computed Tomography Market in South Africa report?
While the report offers comprehensive insights, it's advisable to review the specific contents or supplementary materials provided to ascertain if additional resources or data are available.
14. How can I stay updated on further developments or reports in the Computed Tomography Market in South Africa?
To stay informed about further developments, trends, and reports in the Computed Tomography Market in South Africa, consider subscribing to industry newsletters, following relevant companies and organizations, or regularly checking reputable industry news sources and publications.
Methodology
Step 1 - Identification of Relevant Samples Size from Population Database


Step 2 - Approaches for Defining Global Market Size (Value, Volume* & Price*)

Note*: In applicable scenarios
Step 3 - Data Sources
Primary Research
- Web Analytics
- Survey Reports
- Research Institute
- Latest Research Reports
- Opinion Leaders
Secondary Research
- Annual Reports
- White Paper
- Latest Press Release
- Industry Association
- Paid Database
- Investor Presentations

Step 4 - Data Triangulation
Involves using different sources of information in order to increase the validity of a study
These sources are likely to be stakeholders in a program - participants, other researchers, program staff, other community members, and so on.
Then we put all data in single framework & apply various statistical tools to find out the dynamic on the market.
During the analysis stage, feedback from the stakeholder groups would be compared to determine areas of agreement as well as areas of divergence
