

Key Insights
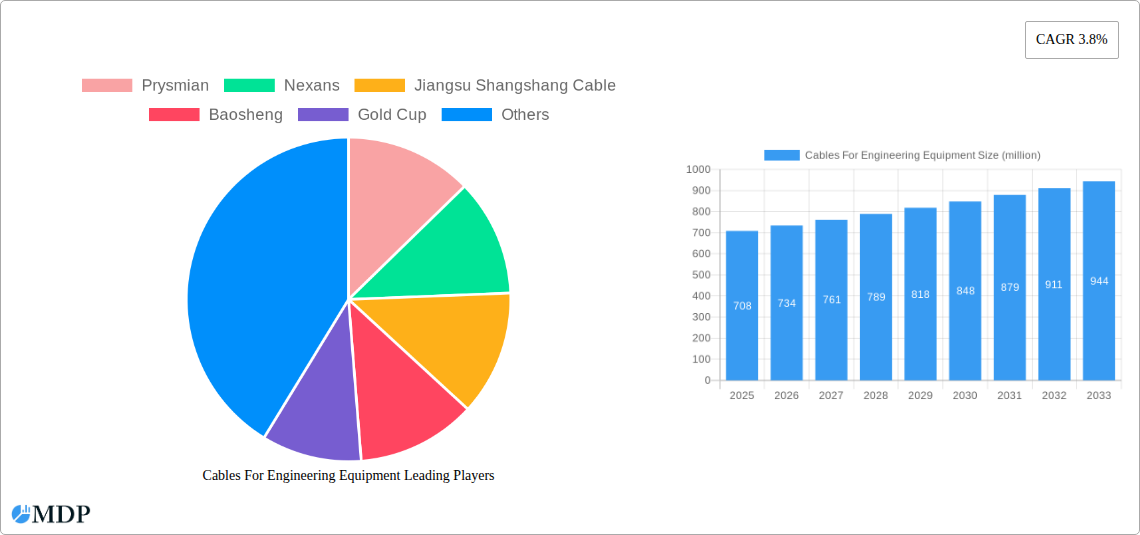
The global market for cables for engineering equipment is projected to reach \$708 million in 2025, exhibiting a Compound Annual Growth Rate (CAGR) of 3.8% from 2025 to 2033. This growth is fueled by several key factors. Increased infrastructure development globally, particularly in emerging economies, is driving demand for robust and reliable cabling solutions in construction, mining, and heavy machinery. Furthermore, the ongoing trend toward automation and electrification within engineering equipment is significantly boosting cable adoption. Advancements in cable technology, such as the development of higher-voltage, more durable, and lighter-weight cables, are also contributing to market expansion. Competitive pressures from numerous manufacturers, including Prysmian, Nexans, and several prominent Chinese players like Jiangsu Shangshang Cable and Baosheng, are leading to innovation and price optimization within the market. However, fluctuating raw material prices, particularly for copper and aluminum, represent a significant constraint on market growth. Stringent regulatory requirements regarding cable safety and performance in different regions also pose challenges for manufacturers. The market segmentation is likely diverse, encompassing various cable types based on voltage rating, material composition, application, and geographical region.
The forecast period (2025-2033) anticipates continued expansion, driven by factors mentioned above. While challenges related to raw material costs and regulations will persist, technological advancements and the ongoing global infrastructure boom are expected to outweigh these constraints. The market is likely to see further consolidation among key players, with larger companies potentially acquiring smaller ones to gain market share and enhance their product portfolios. Regional variations in growth are anticipated, with regions experiencing rapid industrialization and infrastructure development showing higher growth rates. The continued focus on sustainability and environmental considerations will also influence market trends, driving demand for environmentally friendly cable materials and manufacturing processes. Companies are likely investing in research and development to create more efficient and sustainable cable solutions to meet these evolving needs.
Cables For Engineering Equipment Market Report: A Comprehensive Analysis (2019-2033)
This comprehensive report provides an in-depth analysis of the global Cables for Engineering Equipment market, projecting a market valuation exceeding $XX million by 2033. The study covers the period from 2019 to 2033, with a focus on the 2025-2033 forecast period and a base year of 2025. This report is a must-read for industry stakeholders, investors, and anyone seeking to understand the dynamics and future potential of this crucial sector. It provides actionable insights and strategic recommendations for navigating the complexities of this evolving market.
Cables For Engineering Equipment Market Dynamics & Concentration
The global Cables for Engineering Equipment market exhibits a moderately concentrated landscape, with key players like Prysmian, Nexans, and Jiangsu Shangshang Cable holding significant market share. The market share of these top three players is estimated at approximately XX%. However, several regional players contribute substantially to the overall market volume. Innovation, driven by the demand for higher performance cables in demanding environments, is a significant growth driver. Stringent safety and performance standards imposed by regulatory bodies influence product development and adoption. Product substitution, primarily driven by the emergence of advanced materials and technologies, is also observed. The market is experiencing increased M&A activity, with an estimated XX merger and acquisition deals completed between 2019 and 2024, further shaping the market landscape. End-user trends towards automation and smart technologies are influencing demand for specialized cables with increased functionalities.
- Market Concentration: Top 3 players hold approximately XX% market share.
- Innovation Drivers: Demand for higher performance cables in harsh environments.
- Regulatory Frameworks: Stringent safety and performance standards.
- Product Substitutes: Advanced materials and technologies.
- M&A Activity: XX deals between 2019 and 2024.
- End-User Trends: Automation and smart technologies.
Cables For Engineering Equipment Industry Trends & Analysis
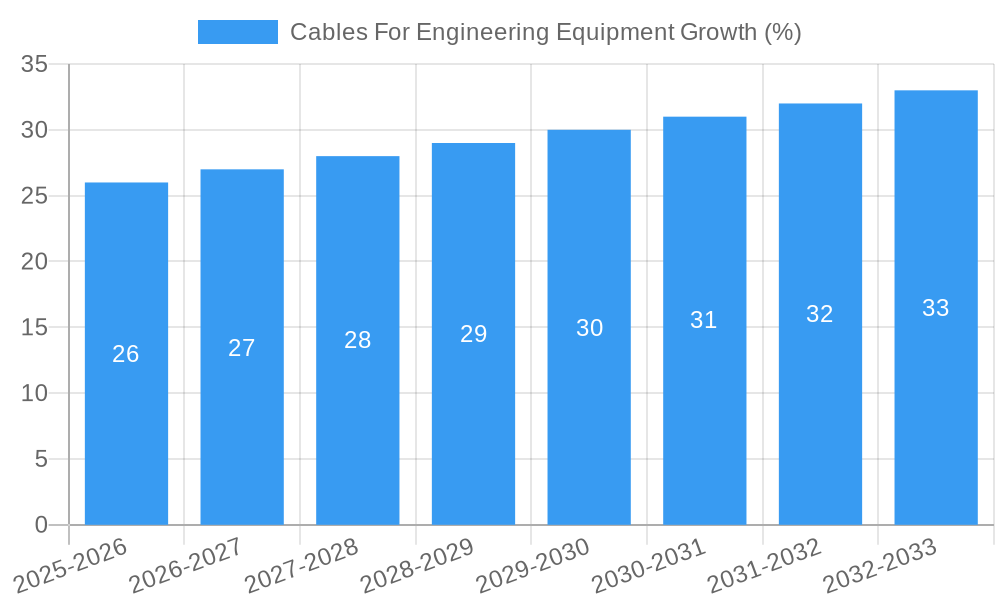
The Cables for Engineering Equipment market is expected to exhibit a robust Compound Annual Growth Rate (CAGR) of XX% during the forecast period (2025-2033). This growth is propelled by several factors, including the burgeoning construction and infrastructure development sector globally, particularly in developing economies. Technological advancements, such as the adoption of high-temperature resistant and radiation-resistant cables, are driving innovation and expanding market applications. Consumer preference shifts towards energy-efficient solutions are stimulating demand for specialized cables designed to minimize energy losses. The competitive landscape is dynamic, with existing players investing heavily in R&D and expansion, while new entrants are striving to carve out their niche. Market penetration of advanced cable technologies, like those utilizing fiber optics, is gradually increasing, driving market expansion.
Leading Markets & Segments in Cables For Engineering Equipment
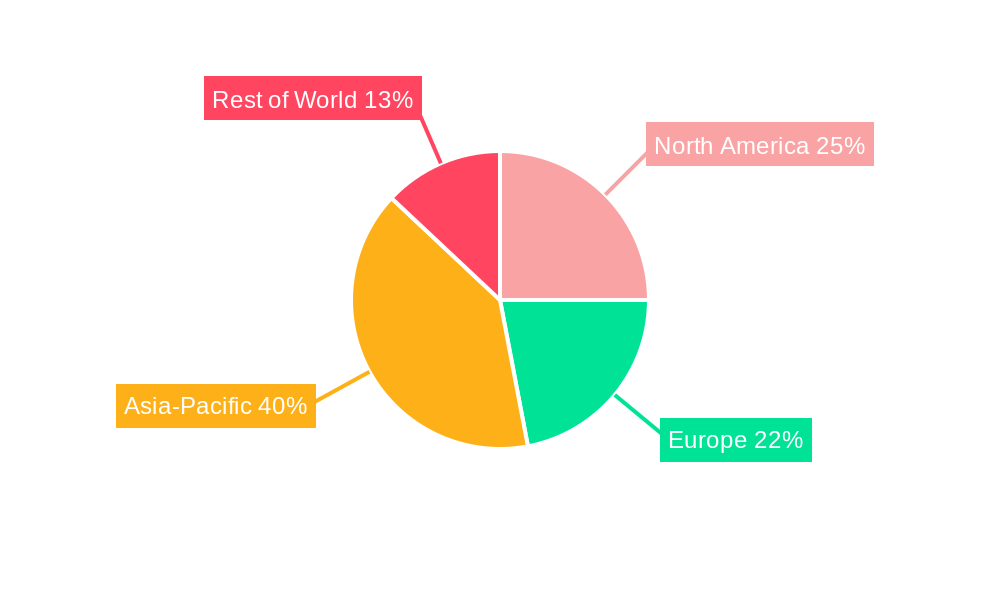
The Asia-Pacific region currently dominates the Cables for Engineering Equipment market, driven primarily by robust infrastructure development and industrial growth in countries like China and India. This dominance is attributed to several key factors:
- Economic Growth: Rapid economic expansion, leading to increased investments in infrastructure projects.
- Government Initiatives: Supportive government policies and substantial investments in infrastructure.
- Industrialization: Rapid industrialization and urbanization driving demand for electrical infrastructure.
North America and Europe also contribute significantly to the market, although their growth rate is comparatively slower than that of the Asia-Pacific region. Specific segments exhibiting strong growth include high-voltage cables and specialized cables for robotics and automation applications.
Cables For Engineering Equipment Product Developments
Recent product developments focus on enhancing cable performance in extreme conditions, incorporating advanced materials such as high-temperature polymers and specialized insulation to improve durability and longevity. The integration of smart sensors and data analytics capabilities in cables is also gaining traction, enabling real-time monitoring and predictive maintenance. These innovations aim to improve efficiency and safety in various engineering equipment applications, offering competitive advantages and expanding market reach.
Key Drivers of Cables For Engineering Equipment Growth
The Cables for Engineering Equipment market’s growth is driven by a confluence of factors: Technological advancements leading to improved cable performance and efficiency are paramount. Growing infrastructure development globally necessitates the use of these cables in various engineering projects. Favorable government policies and investment incentives further fuel market expansion.
Challenges in the Cables For Engineering Equipment Market
The market faces several challenges including stringent regulatory compliance requirements, impacting production costs and timelines. Supply chain disruptions and material price fluctuations pose significant risks. Intense competition from established players and new entrants necessitates constant innovation and cost optimization strategies. These factors cumulatively impact market growth and profitability by an estimated XX%.
Emerging Opportunities in Cables For Engineering Equipment
Long-term growth is fueled by emerging technologies like 5G infrastructure development, requiring robust and high-performance cabling solutions. Strategic partnerships and collaborations between cable manufacturers and engineering equipment companies can create synergistic opportunities. Expanding into new markets, particularly in emerging economies with substantial infrastructure development projects, offers significant growth potential.
Leading Players in the Cables for Engineering Equipment Sector
- Prysmian
- Nexans
- Jiangsu Shangshang Cable
- Baosheng
- Gold Cup
- Shanghai Qifan Cable
- Southwire
- Jiangnan Group
- Taiyang
- Zhejiang Wanma
- TF Kable
- Hangzhou Cable
- Hunan Valin Wire & Cable
- ZMS Cables
- Huatong
- Qingdao Hanhe Cable
- SKL
- Anhui Lingyu Cable
- Tratos
- Bitner
Key Milestones in Cables For Engineering Equipment Industry
- 2020: Introduction of a new generation of high-temperature resistant cables by Prysmian.
- 2022: Merger between two regional cable manufacturers resulting in increased market share.
- 2023: Launch of a new cable designed for use in renewable energy applications by Nexans.
- 2024: Implementation of stricter safety standards impacting the industry.
Strategic Outlook for Cables For Engineering Equipment Market
The Cables for Engineering Equipment market is poised for continued growth, driven by technological advancements and increasing demand from various sectors. Strategic focus on developing innovative, high-performance cables, expanding into new markets, and forging strategic partnerships will be crucial for companies seeking to capitalize on the market's potential. Companies adapting to evolving regulatory requirements and supply chain challenges will gain a competitive edge.
Cables For Engineering Equipment Segmentation
-
1. Application
- 1.1. undefined
-
2. Type
- 2.1. undefined
Cables For Engineering Equipment Segmentation By Geography
- 1. undefined
- 2. undefined
- 3. undefined
- 4. undefined
- 5. undefined
Cables For Engineering Equipment REPORT HIGHLIGHTS
| Aspects | Details |
|---|---|
| Study Period | 2019-2033 |
| Base Year | 2024 |
| Estimated Year | 2025 |
| Forecast Period | 2025-2033 |
| Historical Period | 2019-2024 |
| Growth Rate | CAGR of 3.8% from 2019-2033 |
| Segmentation |
|
Table of Contents
- 1. Introduction
- 1.1. Research Scope
- 1.2. Market Segmentation
- 1.3. Research Methodology
- 1.4. Definitions and Assumptions
- 2. Executive Summary
- 2.1. Introduction
- 3. Market Dynamics
- 3.1. Introduction
- 3.2. Market Drivers
- 3.3. Market Restrains
- 3.4. Market Trends
- 4. Market Factor Analysis
- 4.1. Porters Five Forces
- 4.2. Supply/Value Chain
- 4.3. PESTEL analysis
- 4.4. Market Entropy
- 4.5. Patent/Trademark Analysis
- 5. Global Cables For Engineering Equipment Analysis, Insights and Forecast, 2019-2031
- 5.1. Market Analysis, Insights and Forecast - by Application
- 5.1.1.
- 5.2. Market Analysis, Insights and Forecast - by Type
- 5.2.1.
- 5.3. Market Analysis, Insights and Forecast - by Region
- 5.3.1.
- 5.3.2.
- 5.3.3.
- 5.3.4.
- 5.3.5.
- 5.1. Market Analysis, Insights and Forecast - by Application
- 6. undefined Cables For Engineering Equipment Analysis, Insights and Forecast, 2019-2031
- 6.1. Market Analysis, Insights and Forecast - by Application
- 6.1.1.
- 6.2. Market Analysis, Insights and Forecast - by Type
- 6.2.1.
- 6.1. Market Analysis, Insights and Forecast - by Application
- 7. undefined Cables For Engineering Equipment Analysis, Insights and Forecast, 2019-2031
- 7.1. Market Analysis, Insights and Forecast - by Application
- 7.1.1.
- 7.2. Market Analysis, Insights and Forecast - by Type
- 7.2.1.
- 7.1. Market Analysis, Insights and Forecast - by Application
- 8. undefined Cables For Engineering Equipment Analysis, Insights and Forecast, 2019-2031
- 8.1. Market Analysis, Insights and Forecast - by Application
- 8.1.1.
- 8.2. Market Analysis, Insights and Forecast - by Type
- 8.2.1.
- 8.1. Market Analysis, Insights and Forecast - by Application
- 9. undefined Cables For Engineering Equipment Analysis, Insights and Forecast, 2019-2031
- 9.1. Market Analysis, Insights and Forecast - by Application
- 9.1.1.
- 9.2. Market Analysis, Insights and Forecast - by Type
- 9.2.1.
- 9.1. Market Analysis, Insights and Forecast - by Application
- 10. undefined Cables For Engineering Equipment Analysis, Insights and Forecast, 2019-2031
- 10.1. Market Analysis, Insights and Forecast - by Application
- 10.1.1.
- 10.2. Market Analysis, Insights and Forecast - by Type
- 10.2.1.
- 10.1. Market Analysis, Insights and Forecast - by Application
- 11. Competitive Analysis
- 11.1. Global Market Share Analysis 2024
- 11.2. Company Profiles
- 11.2.1 Prysmian
- 11.2.1.1. Overview
- 11.2.1.2. Products
- 11.2.1.3. SWOT Analysis
- 11.2.1.4. Recent Developments
- 11.2.1.5. Financials (Based on Availability)
- 11.2.2 Nexans
- 11.2.2.1. Overview
- 11.2.2.2. Products
- 11.2.2.3. SWOT Analysis
- 11.2.2.4. Recent Developments
- 11.2.2.5. Financials (Based on Availability)
- 11.2.3 Jiangsu Shangshang Cable
- 11.2.3.1. Overview
- 11.2.3.2. Products
- 11.2.3.3. SWOT Analysis
- 11.2.3.4. Recent Developments
- 11.2.3.5. Financials (Based on Availability)
- 11.2.4 Baosheng
- 11.2.4.1. Overview
- 11.2.4.2. Products
- 11.2.4.3. SWOT Analysis
- 11.2.4.4. Recent Developments
- 11.2.4.5. Financials (Based on Availability)
- 11.2.5 Gold Cup
- 11.2.5.1. Overview
- 11.2.5.2. Products
- 11.2.5.3. SWOT Analysis
- 11.2.5.4. Recent Developments
- 11.2.5.5. Financials (Based on Availability)
- 11.2.6 Shanghai Qifan Cable
- 11.2.6.1. Overview
- 11.2.6.2. Products
- 11.2.6.3. SWOT Analysis
- 11.2.6.4. Recent Developments
- 11.2.6.5. Financials (Based on Availability)
- 11.2.7 Southwire
- 11.2.7.1. Overview
- 11.2.7.2. Products
- 11.2.7.3. SWOT Analysis
- 11.2.7.4. Recent Developments
- 11.2.7.5. Financials (Based on Availability)
- 11.2.8 Jiangnan Group
- 11.2.8.1. Overview
- 11.2.8.2. Products
- 11.2.8.3. SWOT Analysis
- 11.2.8.4. Recent Developments
- 11.2.8.5. Financials (Based on Availability)
- 11.2.9 Taiyang
- 11.2.9.1. Overview
- 11.2.9.2. Products
- 11.2.9.3. SWOT Analysis
- 11.2.9.4. Recent Developments
- 11.2.9.5. Financials (Based on Availability)
- 11.2.10 Zhejiang Wanma
- 11.2.10.1. Overview
- 11.2.10.2. Products
- 11.2.10.3. SWOT Analysis
- 11.2.10.4. Recent Developments
- 11.2.10.5. Financials (Based on Availability)
- 11.2.11 TF Kable
- 11.2.11.1. Overview
- 11.2.11.2. Products
- 11.2.11.3. SWOT Analysis
- 11.2.11.4. Recent Developments
- 11.2.11.5. Financials (Based on Availability)
- 11.2.12 Hangzhou Cable
- 11.2.12.1. Overview
- 11.2.12.2. Products
- 11.2.12.3. SWOT Analysis
- 11.2.12.4. Recent Developments
- 11.2.12.5. Financials (Based on Availability)
- 11.2.13 Hunan Valin Wire & Cable
- 11.2.13.1. Overview
- 11.2.13.2. Products
- 11.2.13.3. SWOT Analysis
- 11.2.13.4. Recent Developments
- 11.2.13.5. Financials (Based on Availability)
- 11.2.14 ZMS Cables
- 11.2.14.1. Overview
- 11.2.14.2. Products
- 11.2.14.3. SWOT Analysis
- 11.2.14.4. Recent Developments
- 11.2.14.5. Financials (Based on Availability)
- 11.2.15 Huatong
- 11.2.15.1. Overview
- 11.2.15.2. Products
- 11.2.15.3. SWOT Analysis
- 11.2.15.4. Recent Developments
- 11.2.15.5. Financials (Based on Availability)
- 11.2.16 Qingdao Hanhe Cable
- 11.2.16.1. Overview
- 11.2.16.2. Products
- 11.2.16.3. SWOT Analysis
- 11.2.16.4. Recent Developments
- 11.2.16.5. Financials (Based on Availability)
- 11.2.17 SKL
- 11.2.17.1. Overview
- 11.2.17.2. Products
- 11.2.17.3. SWOT Analysis
- 11.2.17.4. Recent Developments
- 11.2.17.5. Financials (Based on Availability)
- 11.2.18 Anhui Lingyu Cable
- 11.2.18.1. Overview
- 11.2.18.2. Products
- 11.2.18.3. SWOT Analysis
- 11.2.18.4. Recent Developments
- 11.2.18.5. Financials (Based on Availability)
- 11.2.19 Tratos
- 11.2.19.1. Overview
- 11.2.19.2. Products
- 11.2.19.3. SWOT Analysis
- 11.2.19.4. Recent Developments
- 11.2.19.5. Financials (Based on Availability)
- 11.2.20 Bitner
- 11.2.20.1. Overview
- 11.2.20.2. Products
- 11.2.20.3. SWOT Analysis
- 11.2.20.4. Recent Developments
- 11.2.20.5. Financials (Based on Availability)
- 11.2.1 Prysmian
List of Figures
- Figure 1: Global Cables For Engineering Equipment Revenue Breakdown (million, %) by Region 2024 & 2032
- Figure 2: undefined Cables For Engineering Equipment Revenue (million), by Application 2024 & 2032
- Figure 3: undefined Cables For Engineering Equipment Revenue Share (%), by Application 2024 & 2032
- Figure 4: undefined Cables For Engineering Equipment Revenue (million), by Type 2024 & 2032
- Figure 5: undefined Cables For Engineering Equipment Revenue Share (%), by Type 2024 & 2032
- Figure 6: undefined Cables For Engineering Equipment Revenue (million), by Country 2024 & 2032
- Figure 7: undefined Cables For Engineering Equipment Revenue Share (%), by Country 2024 & 2032
- Figure 8: undefined Cables For Engineering Equipment Revenue (million), by Application 2024 & 2032
- Figure 9: undefined Cables For Engineering Equipment Revenue Share (%), by Application 2024 & 2032
- Figure 10: undefined Cables For Engineering Equipment Revenue (million), by Type 2024 & 2032
- Figure 11: undefined Cables For Engineering Equipment Revenue Share (%), by Type 2024 & 2032
- Figure 12: undefined Cables For Engineering Equipment Revenue (million), by Country 2024 & 2032
- Figure 13: undefined Cables For Engineering Equipment Revenue Share (%), by Country 2024 & 2032
- Figure 14: undefined Cables For Engineering Equipment Revenue (million), by Application 2024 & 2032
- Figure 15: undefined Cables For Engineering Equipment Revenue Share (%), by Application 2024 & 2032
- Figure 16: undefined Cables For Engineering Equipment Revenue (million), by Type 2024 & 2032
- Figure 17: undefined Cables For Engineering Equipment Revenue Share (%), by Type 2024 & 2032
- Figure 18: undefined Cables For Engineering Equipment Revenue (million), by Country 2024 & 2032
- Figure 19: undefined Cables For Engineering Equipment Revenue Share (%), by Country 2024 & 2032
- Figure 20: undefined Cables For Engineering Equipment Revenue (million), by Application 2024 & 2032
- Figure 21: undefined Cables For Engineering Equipment Revenue Share (%), by Application 2024 & 2032
- Figure 22: undefined Cables For Engineering Equipment Revenue (million), by Type 2024 & 2032
- Figure 23: undefined Cables For Engineering Equipment Revenue Share (%), by Type 2024 & 2032
- Figure 24: undefined Cables For Engineering Equipment Revenue (million), by Country 2024 & 2032
- Figure 25: undefined Cables For Engineering Equipment Revenue Share (%), by Country 2024 & 2032
- Figure 26: undefined Cables For Engineering Equipment Revenue (million), by Application 2024 & 2032
- Figure 27: undefined Cables For Engineering Equipment Revenue Share (%), by Application 2024 & 2032
- Figure 28: undefined Cables For Engineering Equipment Revenue (million), by Type 2024 & 2032
- Figure 29: undefined Cables For Engineering Equipment Revenue Share (%), by Type 2024 & 2032
- Figure 30: undefined Cables For Engineering Equipment Revenue (million), by Country 2024 & 2032
- Figure 31: undefined Cables For Engineering Equipment Revenue Share (%), by Country 2024 & 2032
List of Tables
- Table 1: Global Cables For Engineering Equipment Revenue million Forecast, by Region 2019 & 2032
- Table 2: Global Cables For Engineering Equipment Revenue million Forecast, by Application 2019 & 2032
- Table 3: Global Cables For Engineering Equipment Revenue million Forecast, by Type 2019 & 2032
- Table 4: Global Cables For Engineering Equipment Revenue million Forecast, by Region 2019 & 2032
- Table 5: Global Cables For Engineering Equipment Revenue million Forecast, by Application 2019 & 2032
- Table 6: Global Cables For Engineering Equipment Revenue million Forecast, by Type 2019 & 2032
- Table 7: Global Cables For Engineering Equipment Revenue million Forecast, by Country 2019 & 2032
- Table 8: Global Cables For Engineering Equipment Revenue million Forecast, by Application 2019 & 2032
- Table 9: Global Cables For Engineering Equipment Revenue million Forecast, by Type 2019 & 2032
- Table 10: Global Cables For Engineering Equipment Revenue million Forecast, by Country 2019 & 2032
- Table 11: Global Cables For Engineering Equipment Revenue million Forecast, by Application 2019 & 2032
- Table 12: Global Cables For Engineering Equipment Revenue million Forecast, by Type 2019 & 2032
- Table 13: Global Cables For Engineering Equipment Revenue million Forecast, by Country 2019 & 2032
- Table 14: Global Cables For Engineering Equipment Revenue million Forecast, by Application 2019 & 2032
- Table 15: Global Cables For Engineering Equipment Revenue million Forecast, by Type 2019 & 2032
- Table 16: Global Cables For Engineering Equipment Revenue million Forecast, by Country 2019 & 2032
- Table 17: Global Cables For Engineering Equipment Revenue million Forecast, by Application 2019 & 2032
- Table 18: Global Cables For Engineering Equipment Revenue million Forecast, by Type 2019 & 2032
- Table 19: Global Cables For Engineering Equipment Revenue million Forecast, by Country 2019 & 2032
Frequently Asked Questions
1. What is the projected Compound Annual Growth Rate (CAGR) of the Cables For Engineering Equipment?
The projected CAGR is approximately 3.8%.
2. Which companies are prominent players in the Cables For Engineering Equipment?
Key companies in the market include Prysmian, Nexans, Jiangsu Shangshang Cable, Baosheng, Gold Cup, Shanghai Qifan Cable, Southwire, Jiangnan Group, Taiyang, Zhejiang Wanma, TF Kable, Hangzhou Cable, Hunan Valin Wire & Cable, ZMS Cables, Huatong, Qingdao Hanhe Cable, SKL, Anhui Lingyu Cable, Tratos, Bitner.
3. What are the main segments of the Cables For Engineering Equipment?
The market segments include Application, Type.
4. Can you provide details about the market size?
The market size is estimated to be USD 708 million as of 2022.
5. What are some drivers contributing to market growth?
N/A
6. What are the notable trends driving market growth?
N/A
7. Are there any restraints impacting market growth?
N/A
8. Can you provide examples of recent developments in the market?
N/A
9. What pricing options are available for accessing the report?
Pricing options include single-user, multi-user, and enterprise licenses priced at USD 2900.00, USD 4350.00, and USD 5800.00 respectively.
10. Is the market size provided in terms of value or volume?
The market size is provided in terms of value, measured in million.
11. Are there any specific market keywords associated with the report?
Yes, the market keyword associated with the report is "Cables For Engineering Equipment," which aids in identifying and referencing the specific market segment covered.
12. How do I determine which pricing option suits my needs best?
The pricing options vary based on user requirements and access needs. Individual users may opt for single-user licenses, while businesses requiring broader access may choose multi-user or enterprise licenses for cost-effective access to the report.
13. Are there any additional resources or data provided in the Cables For Engineering Equipment report?
While the report offers comprehensive insights, it's advisable to review the specific contents or supplementary materials provided to ascertain if additional resources or data are available.
14. How can I stay updated on further developments or reports in the Cables For Engineering Equipment?
To stay informed about further developments, trends, and reports in the Cables For Engineering Equipment, consider subscribing to industry newsletters, following relevant companies and organizations, or regularly checking reputable industry news sources and publications.
Methodology
Step 1 - Identification of Relevant Samples Size from Population Database


Step 2 - Approaches for Defining Global Market Size (Value, Volume* & Price*)

Note*: In applicable scenarios
Step 3 - Data Sources
Primary Research
- Web Analytics
- Survey Reports
- Research Institute
- Latest Research Reports
- Opinion Leaders
Secondary Research
- Annual Reports
- White Paper
- Latest Press Release
- Industry Association
- Paid Database
- Investor Presentations

Step 4 - Data Triangulation
Involves using different sources of information in order to increase the validity of a study
These sources are likely to be stakeholders in a program - participants, other researchers, program staff, other community members, and so on.
Then we put all data in single framework & apply various statistical tools to find out the dynamic on the market.
During the analysis stage, feedback from the stakeholder groups would be compared to determine areas of agreement as well as areas of divergence
