

Key Insights
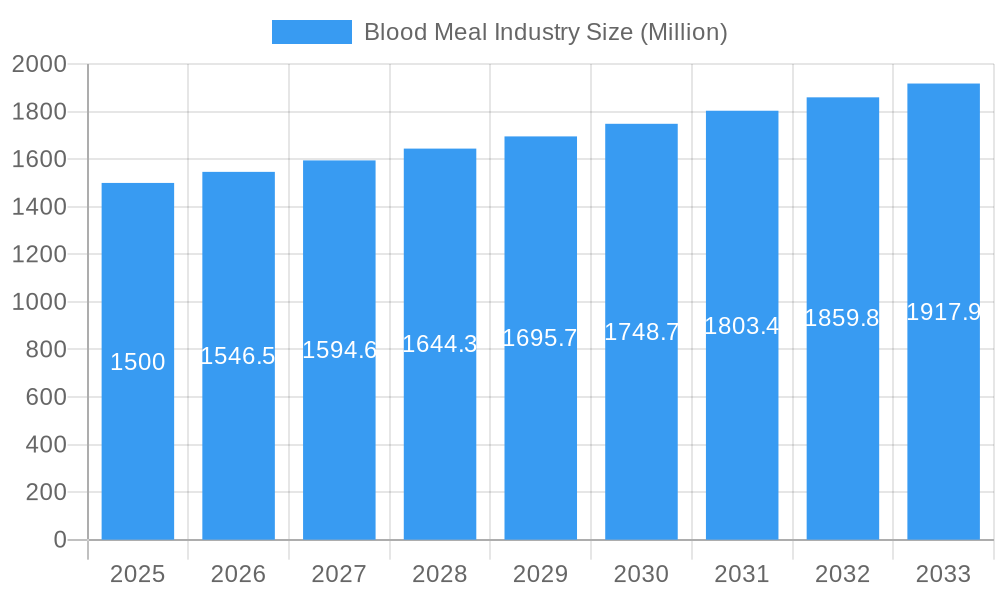
The global blood meal market, valued at approximately 1.29 billion in 2025, is poised for significant expansion, driven by the escalating demand for sustainable and cost-effective animal feed alternatives. The projected Compound Annual Growth Rate (CAGR) of 3.63% from 2025 to 2033 underscores a period of consistent market development, primarily propelled by the poultry and swine feed sectors. Key growth catalysts include a rising global population, increased meat consumption, and a growing appreciation for blood meal's nutritional advantages as a protein source. Significant regional market leadership is anticipated in North America and Asia Pacific, owing to substantial livestock populations and well-established processing infrastructure. However, market expansion may be constrained by stringent regulations concerning blood-borne diseases and potential inconsistencies in product quality. Volatile raw material availability and pricing also present challenges to profitability. Analysis of market segments indicates a strong reliance on porcine and poultry blood sources, mirroring the prominence of these animal industries worldwide. Emerging opportunities lie in diversifying blood meal applications beyond animal feed, such as its use as a natural pest deterrent and organic fertilizer, thereby tapping into the expanding sustainable agriculture market. The competitive landscape is characterized by a mix of large multinational corporations and regional entities, signaling potential for industry consolidation and specialization.
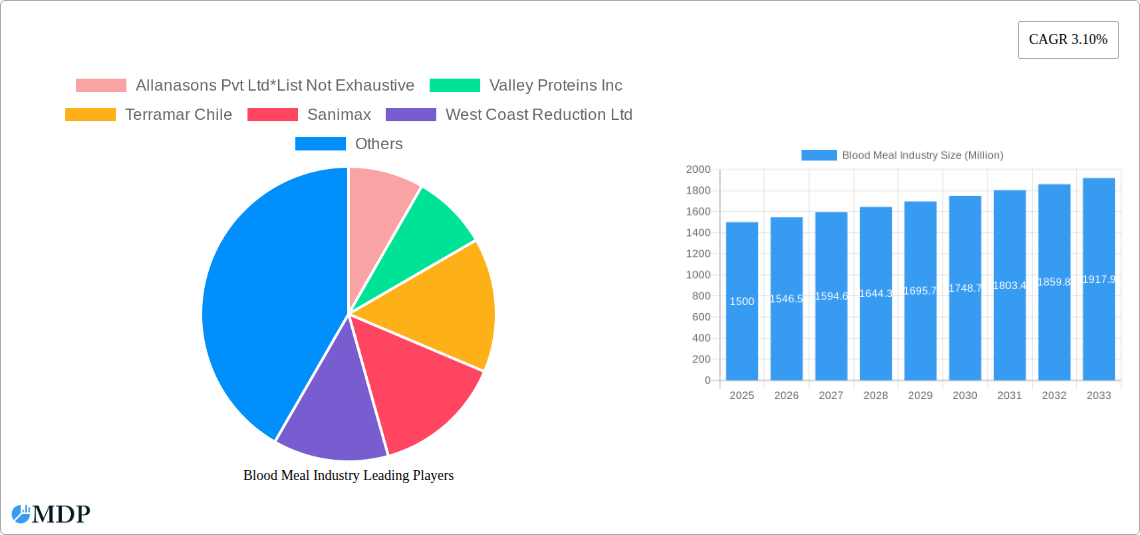
Blood Meal Industry Market Size (In Billion)
The market's consistent growth trajectory presents attractive prospects for industry participants. However, achieving sustained success necessitates addressing regulatory complexities, ensuring consistent product quality, and capitalizing on the growing market for sustainable agricultural inputs. Innovations in processing technologies and the development of value-added products will be instrumental in bolstering market competitiveness and optimizing profitability. Further research into alternative applications for blood meal beyond traditional feed could unlock new avenues for growth and solidify its value as a crucial agricultural resource. Strategic alliances and collaborations among stakeholders, including livestock producers, feed manufacturers, and regulatory agencies, can foster sustainable practices and contribute to the overall advancement and resilience of the blood meal market.
Blood Meal Industry Company Market Share
Blood Meal Market Analysis: Trends, Opportunities, and Forecasts (2019-2033)
This comprehensive report delivers an in-depth examination of the global blood meal industry, providing essential insights for stakeholders navigating this evolving market. Covering market dynamics, concentration, key players, and future prospects, this report offers a robust framework for informed strategic decisions. The analysis spans from 2019 to 2033, with 2025 designated as the base year and the forecast period extending from 2025 to 2033. The historical period reviewed is 2019-2024. The report forecasts a market value of 1.29 billion by 2033, highlighting considerable growth potential.
Blood Meal Industry Market Dynamics & Concentration
The blood meal industry is characterized by a moderately concentrated market structure, with several key players dominating the global landscape. Market share is largely influenced by production capacity, geographical reach, and the ability to secure consistent and sustainable sourcing of raw materials. Innovation within the industry is primarily driven by the increasing demand for sustainable and cost-effective protein sources, particularly in animal feed. Regulatory frameworks surrounding blood meal production and usage vary significantly across regions, impacting market dynamics and creating opportunities for businesses that can adapt to specific regional regulations. Several key factors influence the market's competitive intensity:
- Market Share Distribution: The top five players hold approximately 60% of the global market share, with Darling Ingredients, Valley Proteins Inc., and Sanimax leading the pack. This concentration reflects the high capital investments required for blood meal production facilities and the complexities of securing raw material supplies.
- Innovation Drivers: The development of new technologies in blood meal processing, focusing on efficiency, quality, and sustainability, is a major driver. These innovations are geared towards increasing protein yield, improving the nutritional value of the final product, and reducing environmental impact.
- Regulatory Frameworks: Government regulations vary concerning blood-meal usage in animal feed, which impacts production and distribution channels. Compliance requirements are costly and can be a barrier to entry for small companies.
- Product Substitutes: Competitors include soybean meal and other protein alternatives, creating pricing pressure in the market. However, the unique nutritional profile and affordability of blood meal continue to fuel demand in specific segments.
- End-User Trends: Growing demand for high-protein animal feed, especially in rapidly expanding aquaculture and poultry industries, is a major growth driver.
- M&A Activities: The sector has experienced significant M&A activity, including Darling Ingredient's acquisition of Fasa Group for USD 560 Million in 2022. This trend signals the industry's consolidation and quest for wider geographical presence and product diversification. An estimated xx M&A deals occurred between 2019 and 2024.
Blood Meal Industry Industry Trends & Analysis
The blood meal market is witnessing robust growth, primarily driven by increasing global demand for animal feed and the growing acceptance of sustainable and cost-effective feed ingredients. The Compound Annual Growth Rate (CAGR) from 2019-2024 stood at xx%, and is projected to be xx% from 2025-2033. This growth is fueled by several factors:
- Technological advancements in blood meal processing and purification are leading to improved product quality, enhancing its value proposition to customers.
- Shifting consumer preferences toward sustainably produced animal products are increasing the appeal of blood meal as a byproduct utilization strategy.
- Stringent environmental regulations are promoting efficient and environmentally responsible waste management practices, which aligns well with the blood meal industry's role in transforming a byproduct into a valuable resource.
- Intensified competition is spurring innovation and efficiency gains within the industry. Companies are constantly striving to optimize their operations and enhance the quality of their offerings to gain a competitive edge.
- Market penetration in emerging economies is rapidly increasing as the demand for affordable protein sources in animal agriculture grows.
Leading Markets & Segments in Blood Meal Industry
The leading markets for blood meal vary based on the application. For example, the poultry feed segment holds the largest market share, driven primarily by the robust growth of the poultry industry in Asia and Latin America. Regionally, North America and Europe maintain a significant market presence due to well-established infrastructure and high per capita consumption of animal protein.
Source: Poultry blood currently holds the largest market share among the various sources (porcine, poultry, ruminant) due to the sheer volume of poultry production globally. However, porcine blood is a significant contributor, particularly in regions with high pork consumption. Ruminant blood has the smallest market share due to religious restrictions and sourcing complexities.
Application: Poultry feed dominates the application segment, followed by porcine feed and aqua feed. The utilization of blood meal in organic fertilizers and natural pest deterrents is a relatively nascent but promising segment, poised for substantial growth in the coming years.
Key Drivers: Economic policies promoting sustainable agricultural practices, efficient transportation networks, and the availability of skilled labor significantly influence regional market dynamics. In specific regions, government initiatives supporting the animal feed industry are crucial catalysts for blood meal adoption.
Dominance Analysis: North America and Europe have historically held a significant share of the blood meal market due to well-established livestock industries and advanced processing technologies. However, rapidly developing economies in Asia and Latin America are witnessing a surge in demand, contributing to market expansion in these regions.
Blood Meal Industry Product Developments
Recent product developments emphasize improved processing techniques resulting in higher protein content and better digestibility in blood meal. Enhanced processing also aims to reduce undesirable odors and improve palatability for animal feed applications. The growing interest in using blood meal as a component in organic fertilizers and natural pest deterrents is also driving new product formulations tailored to these specific applications. This reflects the trend of shifting consumer preferences toward environmentally friendly products and resource utilization.
Key Drivers of Blood Meal Industry Growth
Several factors are accelerating the growth of the blood meal industry:
- Growing demand for affordable and sustainable animal feed: This is particularly prominent in rapidly developing economies with expanding livestock populations.
- Technological advancements: Improved processing techniques are yielding higher-quality blood meal with enhanced nutritional profiles.
- Stringent environmental regulations: The emphasis on sustainable waste management solutions enhances the value proposition of blood meal as a byproduct utilization strategy.
Challenges in the Blood Meal Industry Market
Significant challenges impede the growth of this sector:
- Fluctuating raw material availability: The supply of blood depends heavily on the agricultural sector's activities, which can impact blood meal production.
- Strict regulatory compliance: Adhering to quality and safety regulations increases operational costs, especially for small and medium-sized enterprises.
- Competition from alternative protein sources: Soybean meal and other protein alternatives present significant competitive pressure.
Emerging Opportunities in Blood Meal Industry
Future growth will be fueled by:
- Expanding application in organic farming: The use of blood meal as a natural fertilizer offers an opportunity for significant market expansion.
- Strategic collaborations: Partnerships between blood meal producers and animal feed manufacturers can create economies of scale and enhance market access.
- Expansion into new markets: Untapped potential exists in developing economies where demand for affordable protein sources remains high.
Leading Players in the Blood Meal Industry Sector
- Allanasons Pvt Ltd *List Not Exhaustive
- Valley Proteins Inc
- Terramar Chile
- Sanimax
- West Coast Reduction Ltd
- Darling Ingredients
- Boyer Valley Company LLC
- Agro-industrial Complex Backa Topola LTD
- The Fetrell Company
Key Milestones in Blood Meal Industry Industry
- May 2022: Darling Ingredients acquired Fasa Group for USD 560 million, significantly expanding its market reach and product portfolio. This acquisition demonstrates the industry's consolidation trend and reflects the strategic importance of geographic expansion.
- January 2020: Darling Ingredients acquired 100% equity in EnviroFlight, furthering its investment in sustainable and innovative protein solutions. This highlights the increasing focus on sustainability and technological advancement within the blood meal sector.
Strategic Outlook for Blood Meal Industry Market
The blood meal industry is poised for continued growth, driven by the increasing demand for sustainable and affordable protein sources, particularly in the animal feed sector. Strategic partnerships, technological advancements, and expansion into new markets will be crucial factors shaping the industry's future. The focus on producing high-quality blood meal with enhanced nutritional value will be pivotal in maintaining competitiveness and meeting the evolving needs of consumers. Opportunities abound for businesses that can effectively navigate regulatory landscapes, optimize production processes, and meet the growing demand for sustainable solutions.
Blood Meal Industry Segmentation
- 1. Production Analysis
- 2. Consumption Analysis
- 3. Import Market Analysis (Value & Volume)
- 4. Export Market Analysis (Value & Volume)
- 5. Price Trend Analysis
Blood Meal Industry Segmentation By Geography
-
1. North America
- 1.1. United States
- 1.2. Canada
- 1.3. Mexico
-
2. South America
- 2.1. Brazil
- 2.2. Argentina
- 2.3. Rest of South America
-
3. Europe
- 3.1. United Kingdom
- 3.2. Germany
- 3.3. France
- 3.4. Italy
- 3.5. Spain
- 3.6. Russia
- 3.7. Benelux
- 3.8. Nordics
- 3.9. Rest of Europe
-
4. Middle East & Africa
- 4.1. Turkey
- 4.2. Israel
- 4.3. GCC
- 4.4. North Africa
- 4.5. South Africa
- 4.6. Rest of Middle East & Africa
-
5. Asia Pacific
- 5.1. China
- 5.2. India
- 5.3. Japan
- 5.4. South Korea
- 5.5. ASEAN
- 5.6. Oceania
- 5.7. Rest of Asia Pacific
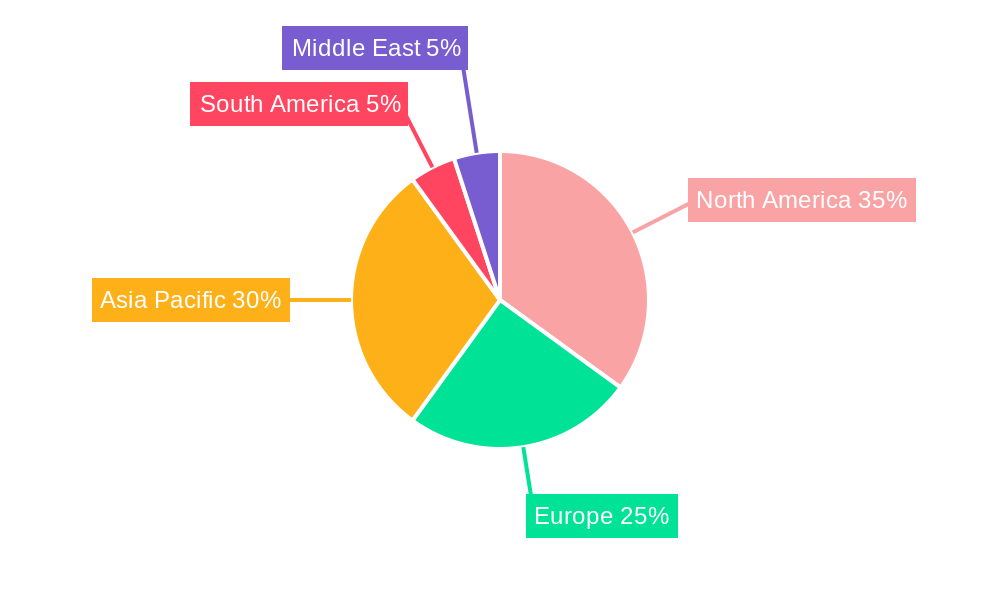
Blood Meal Industry Regional Market Share
Geographic Coverage of Blood Meal Industry
Blood Meal Industry REPORT HIGHLIGHTS
| Aspects | Details |
|---|---|
| Study Period | 2020-2034 |
| Base Year | 2025 |
| Estimated Year | 2026 |
| Forecast Period | 2026-2034 |
| Historical Period | 2020-2025 |
| Growth Rate | CAGR of 3.63% from 2020-2034 |
| Segmentation |
|
Table of Contents
- 1. Introduction
- 1.1. Research Scope
- 1.2. Market Segmentation
- 1.3. Research Methodology
- 1.4. Definitions and Assumptions
- 2. Executive Summary
- 2.1. Introduction
- 3. Market Dynamics
- 3.1. Introduction
- 3.2. Market Drivers
- 3.2.1. Adoption of Organic and Eco-friendly Farming Practices; Declining Area of Arable Land and Rising Food Security Concerns
- 3.3. Market Restrains
- 3.3.1. High Demand for Conventional and Synthetic Products; Lack of Awareness and Other Factors Limiting the Adoption of Agricultural Inoculants
- 3.4. Market Trends
- 3.4.1. Growing Demand for Animal Meat is creating Market Opportunities
- 4. Market Factor Analysis
- 4.1. Porters Five Forces
- 4.2. Supply/Value Chain
- 4.3. PESTEL analysis
- 4.4. Market Entropy
- 4.5. Patent/Trademark Analysis
- 5. Global Blood Meal Industry Analysis, Insights and Forecast, 2020-2032
- 5.1. Market Analysis, Insights and Forecast - by Production Analysis
- 5.2. Market Analysis, Insights and Forecast - by Consumption Analysis
- 5.3. Market Analysis, Insights and Forecast - by Import Market Analysis (Value & Volume)
- 5.4. Market Analysis, Insights and Forecast - by Export Market Analysis (Value & Volume)
- 5.5. Market Analysis, Insights and Forecast - by Price Trend Analysis
- 5.6. Market Analysis, Insights and Forecast - by Region
- 5.6.1. North America
- 5.6.2. South America
- 5.6.3. Europe
- 5.6.4. Middle East & Africa
- 5.6.5. Asia Pacific
- 5.1. Market Analysis, Insights and Forecast - by Production Analysis
- 6. North America Blood Meal Industry Analysis, Insights and Forecast, 2020-2032
- 6.1. Market Analysis, Insights and Forecast - by Production Analysis
- 6.2. Market Analysis, Insights and Forecast - by Consumption Analysis
- 6.3. Market Analysis, Insights and Forecast - by Import Market Analysis (Value & Volume)
- 6.4. Market Analysis, Insights and Forecast - by Export Market Analysis (Value & Volume)
- 6.5. Market Analysis, Insights and Forecast - by Price Trend Analysis
- 6.1. Market Analysis, Insights and Forecast - by Production Analysis
- 7. South America Blood Meal Industry Analysis, Insights and Forecast, 2020-2032
- 7.1. Market Analysis, Insights and Forecast - by Production Analysis
- 7.2. Market Analysis, Insights and Forecast - by Consumption Analysis
- 7.3. Market Analysis, Insights and Forecast - by Import Market Analysis (Value & Volume)
- 7.4. Market Analysis, Insights and Forecast - by Export Market Analysis (Value & Volume)
- 7.5. Market Analysis, Insights and Forecast - by Price Trend Analysis
- 7.1. Market Analysis, Insights and Forecast - by Production Analysis
- 8. Europe Blood Meal Industry Analysis, Insights and Forecast, 2020-2032
- 8.1. Market Analysis, Insights and Forecast - by Production Analysis
- 8.2. Market Analysis, Insights and Forecast - by Consumption Analysis
- 8.3. Market Analysis, Insights and Forecast - by Import Market Analysis (Value & Volume)
- 8.4. Market Analysis, Insights and Forecast - by Export Market Analysis (Value & Volume)
- 8.5. Market Analysis, Insights and Forecast - by Price Trend Analysis
- 8.1. Market Analysis, Insights and Forecast - by Production Analysis
- 9. Middle East & Africa Blood Meal Industry Analysis, Insights and Forecast, 2020-2032
- 9.1. Market Analysis, Insights and Forecast - by Production Analysis
- 9.2. Market Analysis, Insights and Forecast - by Consumption Analysis
- 9.3. Market Analysis, Insights and Forecast - by Import Market Analysis (Value & Volume)
- 9.4. Market Analysis, Insights and Forecast - by Export Market Analysis (Value & Volume)
- 9.5. Market Analysis, Insights and Forecast - by Price Trend Analysis
- 9.1. Market Analysis, Insights and Forecast - by Production Analysis
- 10. Asia Pacific Blood Meal Industry Analysis, Insights and Forecast, 2020-2032
- 10.1. Market Analysis, Insights and Forecast - by Production Analysis
- 10.2. Market Analysis, Insights and Forecast - by Consumption Analysis
- 10.3. Market Analysis, Insights and Forecast - by Import Market Analysis (Value & Volume)
- 10.4. Market Analysis, Insights and Forecast - by Export Market Analysis (Value & Volume)
- 10.5. Market Analysis, Insights and Forecast - by Price Trend Analysis
- 10.1. Market Analysis, Insights and Forecast - by Production Analysis
- 11. Competitive Analysis
- 11.1. Global Market Share Analysis 2025
- 11.2. Company Profiles
- 11.2.1 Allanasons Pvt Ltd*List Not Exhaustive
- 11.2.1.1. Overview
- 11.2.1.2. Products
- 11.2.1.3. SWOT Analysis
- 11.2.1.4. Recent Developments
- 11.2.1.5. Financials (Based on Availability)
- 11.2.2 Valley Proteins Inc
- 11.2.2.1. Overview
- 11.2.2.2. Products
- 11.2.2.3. SWOT Analysis
- 11.2.2.4. Recent Developments
- 11.2.2.5. Financials (Based on Availability)
- 11.2.3 Terramar Chile
- 11.2.3.1. Overview
- 11.2.3.2. Products
- 11.2.3.3. SWOT Analysis
- 11.2.3.4. Recent Developments
- 11.2.3.5. Financials (Based on Availability)
- 11.2.4 Sanimax
- 11.2.4.1. Overview
- 11.2.4.2. Products
- 11.2.4.3. SWOT Analysis
- 11.2.4.4. Recent Developments
- 11.2.4.5. Financials (Based on Availability)
- 11.2.5 West Coast Reduction Ltd
- 11.2.5.1. Overview
- 11.2.5.2. Products
- 11.2.5.3. SWOT Analysis
- 11.2.5.4. Recent Developments
- 11.2.5.5. Financials (Based on Availability)
- 11.2.6 Darling Ingredients
- 11.2.6.1. Overview
- 11.2.6.2. Products
- 11.2.6.3. SWOT Analysis
- 11.2.6.4. Recent Developments
- 11.2.6.5. Financials (Based on Availability)
- 11.2.7 Boyer Valley Company LLC
- 11.2.7.1. Overview
- 11.2.7.2. Products
- 11.2.7.3. SWOT Analysis
- 11.2.7.4. Recent Developments
- 11.2.7.5. Financials (Based on Availability)
- 11.2.8 Agro-industrial Complex Backa Topola LTD
- 11.2.8.1. Overview
- 11.2.8.2. Products
- 11.2.8.3. SWOT Analysis
- 11.2.8.4. Recent Developments
- 11.2.8.5. Financials (Based on Availability)
- 11.2.9 The Fetrell Company
- 11.2.9.1. Overview
- 11.2.9.2. Products
- 11.2.9.3. SWOT Analysis
- 11.2.9.4. Recent Developments
- 11.2.9.5. Financials (Based on Availability)
- 11.2.1 Allanasons Pvt Ltd*List Not Exhaustive
List of Figures
- Figure 1: Global Blood Meal Industry Revenue Breakdown (billion, %) by Region 2025 & 2033
- Figure 2: North America Blood Meal Industry Revenue (billion), by Production Analysis 2025 & 2033
- Figure 3: North America Blood Meal Industry Revenue Share (%), by Production Analysis 2025 & 2033
- Figure 4: North America Blood Meal Industry Revenue (billion), by Consumption Analysis 2025 & 2033
- Figure 5: North America Blood Meal Industry Revenue Share (%), by Consumption Analysis 2025 & 2033
- Figure 6: North America Blood Meal Industry Revenue (billion), by Import Market Analysis (Value & Volume) 2025 & 2033
- Figure 7: North America Blood Meal Industry Revenue Share (%), by Import Market Analysis (Value & Volume) 2025 & 2033
- Figure 8: North America Blood Meal Industry Revenue (billion), by Export Market Analysis (Value & Volume) 2025 & 2033
- Figure 9: North America Blood Meal Industry Revenue Share (%), by Export Market Analysis (Value & Volume) 2025 & 2033
- Figure 10: North America Blood Meal Industry Revenue (billion), by Price Trend Analysis 2025 & 2033
- Figure 11: North America Blood Meal Industry Revenue Share (%), by Price Trend Analysis 2025 & 2033
- Figure 12: North America Blood Meal Industry Revenue (billion), by Country 2025 & 2033
- Figure 13: North America Blood Meal Industry Revenue Share (%), by Country 2025 & 2033
- Figure 14: South America Blood Meal Industry Revenue (billion), by Production Analysis 2025 & 2033
- Figure 15: South America Blood Meal Industry Revenue Share (%), by Production Analysis 2025 & 2033
- Figure 16: South America Blood Meal Industry Revenue (billion), by Consumption Analysis 2025 & 2033
- Figure 17: South America Blood Meal Industry Revenue Share (%), by Consumption Analysis 2025 & 2033
- Figure 18: South America Blood Meal Industry Revenue (billion), by Import Market Analysis (Value & Volume) 2025 & 2033
- Figure 19: South America Blood Meal Industry Revenue Share (%), by Import Market Analysis (Value & Volume) 2025 & 2033
- Figure 20: South America Blood Meal Industry Revenue (billion), by Export Market Analysis (Value & Volume) 2025 & 2033
- Figure 21: South America Blood Meal Industry Revenue Share (%), by Export Market Analysis (Value & Volume) 2025 & 2033
- Figure 22: South America Blood Meal Industry Revenue (billion), by Price Trend Analysis 2025 & 2033
- Figure 23: South America Blood Meal Industry Revenue Share (%), by Price Trend Analysis 2025 & 2033
- Figure 24: South America Blood Meal Industry Revenue (billion), by Country 2025 & 2033
- Figure 25: South America Blood Meal Industry Revenue Share (%), by Country 2025 & 2033
- Figure 26: Europe Blood Meal Industry Revenue (billion), by Production Analysis 2025 & 2033
- Figure 27: Europe Blood Meal Industry Revenue Share (%), by Production Analysis 2025 & 2033
- Figure 28: Europe Blood Meal Industry Revenue (billion), by Consumption Analysis 2025 & 2033
- Figure 29: Europe Blood Meal Industry Revenue Share (%), by Consumption Analysis 2025 & 2033
- Figure 30: Europe Blood Meal Industry Revenue (billion), by Import Market Analysis (Value & Volume) 2025 & 2033
- Figure 31: Europe Blood Meal Industry Revenue Share (%), by Import Market Analysis (Value & Volume) 2025 & 2033
- Figure 32: Europe Blood Meal Industry Revenue (billion), by Export Market Analysis (Value & Volume) 2025 & 2033
- Figure 33: Europe Blood Meal Industry Revenue Share (%), by Export Market Analysis (Value & Volume) 2025 & 2033
- Figure 34: Europe Blood Meal Industry Revenue (billion), by Price Trend Analysis 2025 & 2033
- Figure 35: Europe Blood Meal Industry Revenue Share (%), by Price Trend Analysis 2025 & 2033
- Figure 36: Europe Blood Meal Industry Revenue (billion), by Country 2025 & 2033
- Figure 37: Europe Blood Meal Industry Revenue Share (%), by Country 2025 & 2033
- Figure 38: Middle East & Africa Blood Meal Industry Revenue (billion), by Production Analysis 2025 & 2033
- Figure 39: Middle East & Africa Blood Meal Industry Revenue Share (%), by Production Analysis 2025 & 2033
- Figure 40: Middle East & Africa Blood Meal Industry Revenue (billion), by Consumption Analysis 2025 & 2033
- Figure 41: Middle East & Africa Blood Meal Industry Revenue Share (%), by Consumption Analysis 2025 & 2033
- Figure 42: Middle East & Africa Blood Meal Industry Revenue (billion), by Import Market Analysis (Value & Volume) 2025 & 2033
- Figure 43: Middle East & Africa Blood Meal Industry Revenue Share (%), by Import Market Analysis (Value & Volume) 2025 & 2033
- Figure 44: Middle East & Africa Blood Meal Industry Revenue (billion), by Export Market Analysis (Value & Volume) 2025 & 2033
- Figure 45: Middle East & Africa Blood Meal Industry Revenue Share (%), by Export Market Analysis (Value & Volume) 2025 & 2033
- Figure 46: Middle East & Africa Blood Meal Industry Revenue (billion), by Price Trend Analysis 2025 & 2033
- Figure 47: Middle East & Africa Blood Meal Industry Revenue Share (%), by Price Trend Analysis 2025 & 2033
- Figure 48: Middle East & Africa Blood Meal Industry Revenue (billion), by Country 2025 & 2033
- Figure 49: Middle East & Africa Blood Meal Industry Revenue Share (%), by Country 2025 & 2033
- Figure 50: Asia Pacific Blood Meal Industry Revenue (billion), by Production Analysis 2025 & 2033
- Figure 51: Asia Pacific Blood Meal Industry Revenue Share (%), by Production Analysis 2025 & 2033
- Figure 52: Asia Pacific Blood Meal Industry Revenue (billion), by Consumption Analysis 2025 & 2033
- Figure 53: Asia Pacific Blood Meal Industry Revenue Share (%), by Consumption Analysis 2025 & 2033
- Figure 54: Asia Pacific Blood Meal Industry Revenue (billion), by Import Market Analysis (Value & Volume) 2025 & 2033
- Figure 55: Asia Pacific Blood Meal Industry Revenue Share (%), by Import Market Analysis (Value & Volume) 2025 & 2033
- Figure 56: Asia Pacific Blood Meal Industry Revenue (billion), by Export Market Analysis (Value & Volume) 2025 & 2033
- Figure 57: Asia Pacific Blood Meal Industry Revenue Share (%), by Export Market Analysis (Value & Volume) 2025 & 2033
- Figure 58: Asia Pacific Blood Meal Industry Revenue (billion), by Price Trend Analysis 2025 & 2033
- Figure 59: Asia Pacific Blood Meal Industry Revenue Share (%), by Price Trend Analysis 2025 & 2033
- Figure 60: Asia Pacific Blood Meal Industry Revenue (billion), by Country 2025 & 2033
- Figure 61: Asia Pacific Blood Meal Industry Revenue Share (%), by Country 2025 & 2033
List of Tables
- Table 1: Global Blood Meal Industry Revenue billion Forecast, by Production Analysis 2020 & 2033
- Table 2: Global Blood Meal Industry Revenue billion Forecast, by Consumption Analysis 2020 & 2033
- Table 3: Global Blood Meal Industry Revenue billion Forecast, by Import Market Analysis (Value & Volume) 2020 & 2033
- Table 4: Global Blood Meal Industry Revenue billion Forecast, by Export Market Analysis (Value & Volume) 2020 & 2033
- Table 5: Global Blood Meal Industry Revenue billion Forecast, by Price Trend Analysis 2020 & 2033
- Table 6: Global Blood Meal Industry Revenue billion Forecast, by Region 2020 & 2033
- Table 7: Global Blood Meal Industry Revenue billion Forecast, by Production Analysis 2020 & 2033
- Table 8: Global Blood Meal Industry Revenue billion Forecast, by Consumption Analysis 2020 & 2033
- Table 9: Global Blood Meal Industry Revenue billion Forecast, by Import Market Analysis (Value & Volume) 2020 & 2033
- Table 10: Global Blood Meal Industry Revenue billion Forecast, by Export Market Analysis (Value & Volume) 2020 & 2033
- Table 11: Global Blood Meal Industry Revenue billion Forecast, by Price Trend Analysis 2020 & 2033
- Table 12: Global Blood Meal Industry Revenue billion Forecast, by Country 2020 & 2033
- Table 13: United States Blood Meal Industry Revenue (billion) Forecast, by Application 2020 & 2033
- Table 14: Canada Blood Meal Industry Revenue (billion) Forecast, by Application 2020 & 2033
- Table 15: Mexico Blood Meal Industry Revenue (billion) Forecast, by Application 2020 & 2033
- Table 16: Global Blood Meal Industry Revenue billion Forecast, by Production Analysis 2020 & 2033
- Table 17: Global Blood Meal Industry Revenue billion Forecast, by Consumption Analysis 2020 & 2033
- Table 18: Global Blood Meal Industry Revenue billion Forecast, by Import Market Analysis (Value & Volume) 2020 & 2033
- Table 19: Global Blood Meal Industry Revenue billion Forecast, by Export Market Analysis (Value & Volume) 2020 & 2033
- Table 20: Global Blood Meal Industry Revenue billion Forecast, by Price Trend Analysis 2020 & 2033
- Table 21: Global Blood Meal Industry Revenue billion Forecast, by Country 2020 & 2033
- Table 22: Brazil Blood Meal Industry Revenue (billion) Forecast, by Application 2020 & 2033
- Table 23: Argentina Blood Meal Industry Revenue (billion) Forecast, by Application 2020 & 2033
- Table 24: Rest of South America Blood Meal Industry Revenue (billion) Forecast, by Application 2020 & 2033
- Table 25: Global Blood Meal Industry Revenue billion Forecast, by Production Analysis 2020 & 2033
- Table 26: Global Blood Meal Industry Revenue billion Forecast, by Consumption Analysis 2020 & 2033
- Table 27: Global Blood Meal Industry Revenue billion Forecast, by Import Market Analysis (Value & Volume) 2020 & 2033
- Table 28: Global Blood Meal Industry Revenue billion Forecast, by Export Market Analysis (Value & Volume) 2020 & 2033
- Table 29: Global Blood Meal Industry Revenue billion Forecast, by Price Trend Analysis 2020 & 2033
- Table 30: Global Blood Meal Industry Revenue billion Forecast, by Country 2020 & 2033
- Table 31: United Kingdom Blood Meal Industry Revenue (billion) Forecast, by Application 2020 & 2033
- Table 32: Germany Blood Meal Industry Revenue (billion) Forecast, by Application 2020 & 2033
- Table 33: France Blood Meal Industry Revenue (billion) Forecast, by Application 2020 & 2033
- Table 34: Italy Blood Meal Industry Revenue (billion) Forecast, by Application 2020 & 2033
- Table 35: Spain Blood Meal Industry Revenue (billion) Forecast, by Application 2020 & 2033
- Table 36: Russia Blood Meal Industry Revenue (billion) Forecast, by Application 2020 & 2033
- Table 37: Benelux Blood Meal Industry Revenue (billion) Forecast, by Application 2020 & 2033
- Table 38: Nordics Blood Meal Industry Revenue (billion) Forecast, by Application 2020 & 2033
- Table 39: Rest of Europe Blood Meal Industry Revenue (billion) Forecast, by Application 2020 & 2033
- Table 40: Global Blood Meal Industry Revenue billion Forecast, by Production Analysis 2020 & 2033
- Table 41: Global Blood Meal Industry Revenue billion Forecast, by Consumption Analysis 2020 & 2033
- Table 42: Global Blood Meal Industry Revenue billion Forecast, by Import Market Analysis (Value & Volume) 2020 & 2033
- Table 43: Global Blood Meal Industry Revenue billion Forecast, by Export Market Analysis (Value & Volume) 2020 & 2033
- Table 44: Global Blood Meal Industry Revenue billion Forecast, by Price Trend Analysis 2020 & 2033
- Table 45: Global Blood Meal Industry Revenue billion Forecast, by Country 2020 & 2033
- Table 46: Turkey Blood Meal Industry Revenue (billion) Forecast, by Application 2020 & 2033
- Table 47: Israel Blood Meal Industry Revenue (billion) Forecast, by Application 2020 & 2033
- Table 48: GCC Blood Meal Industry Revenue (billion) Forecast, by Application 2020 & 2033
- Table 49: North Africa Blood Meal Industry Revenue (billion) Forecast, by Application 2020 & 2033
- Table 50: South Africa Blood Meal Industry Revenue (billion) Forecast, by Application 2020 & 2033
- Table 51: Rest of Middle East & Africa Blood Meal Industry Revenue (billion) Forecast, by Application 2020 & 2033
- Table 52: Global Blood Meal Industry Revenue billion Forecast, by Production Analysis 2020 & 2033
- Table 53: Global Blood Meal Industry Revenue billion Forecast, by Consumption Analysis 2020 & 2033
- Table 54: Global Blood Meal Industry Revenue billion Forecast, by Import Market Analysis (Value & Volume) 2020 & 2033
- Table 55: Global Blood Meal Industry Revenue billion Forecast, by Export Market Analysis (Value & Volume) 2020 & 2033
- Table 56: Global Blood Meal Industry Revenue billion Forecast, by Price Trend Analysis 2020 & 2033
- Table 57: Global Blood Meal Industry Revenue billion Forecast, by Country 2020 & 2033
- Table 58: China Blood Meal Industry Revenue (billion) Forecast, by Application 2020 & 2033
- Table 59: India Blood Meal Industry Revenue (billion) Forecast, by Application 2020 & 2033
- Table 60: Japan Blood Meal Industry Revenue (billion) Forecast, by Application 2020 & 2033
- Table 61: South Korea Blood Meal Industry Revenue (billion) Forecast, by Application 2020 & 2033
- Table 62: ASEAN Blood Meal Industry Revenue (billion) Forecast, by Application 2020 & 2033
- Table 63: Oceania Blood Meal Industry Revenue (billion) Forecast, by Application 2020 & 2033
- Table 64: Rest of Asia Pacific Blood Meal Industry Revenue (billion) Forecast, by Application 2020 & 2033
Frequently Asked Questions
1. What is the projected Compound Annual Growth Rate (CAGR) of the Blood Meal Industry?
The projected CAGR is approximately 3.63%.
2. Which companies are prominent players in the Blood Meal Industry?
Key companies in the market include Allanasons Pvt Ltd*List Not Exhaustive, Valley Proteins Inc, Terramar Chile, Sanimax, West Coast Reduction Ltd, Darling Ingredients, Boyer Valley Company LLC, Agro-industrial Complex Backa Topola LTD, The Fetrell Company.
3. What are the main segments of the Blood Meal Industry?
The market segments include Production Analysis, Consumption Analysis, Import Market Analysis (Value & Volume), Export Market Analysis (Value & Volume), Price Trend Analysis.
4. Can you provide details about the market size?
The market size is estimated to be USD 1.29 billion as of 2022.
5. What are some drivers contributing to market growth?
Adoption of Organic and Eco-friendly Farming Practices; Declining Area of Arable Land and Rising Food Security Concerns.
6. What are the notable trends driving market growth?
Growing Demand for Animal Meat is creating Market Opportunities.
7. Are there any restraints impacting market growth?
High Demand for Conventional and Synthetic Products; Lack of Awareness and Other Factors Limiting the Adoption of Agricultural Inoculants.
8. Can you provide examples of recent developments in the market?
May 2022: Darling Ingredients acquired Fasa Group for USD 560 million to expand its geographical presence and new product offerings in the global blood meal market.
9. What pricing options are available for accessing the report?
Pricing options include single-user, multi-user, and enterprise licenses priced at USD 4750, USD 5250, and USD 8750 respectively.
10. Is the market size provided in terms of value or volume?
The market size is provided in terms of value, measured in billion.
11. Are there any specific market keywords associated with the report?
Yes, the market keyword associated with the report is "Blood Meal Industry," which aids in identifying and referencing the specific market segment covered.
12. How do I determine which pricing option suits my needs best?
The pricing options vary based on user requirements and access needs. Individual users may opt for single-user licenses, while businesses requiring broader access may choose multi-user or enterprise licenses for cost-effective access to the report.
13. Are there any additional resources or data provided in the Blood Meal Industry report?
While the report offers comprehensive insights, it's advisable to review the specific contents or supplementary materials provided to ascertain if additional resources or data are available.
14. How can I stay updated on further developments or reports in the Blood Meal Industry?
To stay informed about further developments, trends, and reports in the Blood Meal Industry, consider subscribing to industry newsletters, following relevant companies and organizations, or regularly checking reputable industry news sources and publications.
Methodology
Step 1 - Identification of Relevant Samples Size from Population Database


Step 2 - Approaches for Defining Global Market Size (Value, Volume* & Price*)

Note*: In applicable scenarios
Step 3 - Data Sources
Primary Research
- Web Analytics
- Survey Reports
- Research Institute
- Latest Research Reports
- Opinion Leaders
Secondary Research
- Annual Reports
- White Paper
- Latest Press Release
- Industry Association
- Paid Database
- Investor Presentations

Step 4 - Data Triangulation
Involves using different sources of information in order to increase the validity of a study
These sources are likely to be stakeholders in a program - participants, other researchers, program staff, other community members, and so on.
Then we put all data in single framework & apply various statistical tools to find out the dynamic on the market.
During the analysis stage, feedback from the stakeholder groups would be compared to determine areas of agreement as well as areas of divergence