

Key Insights
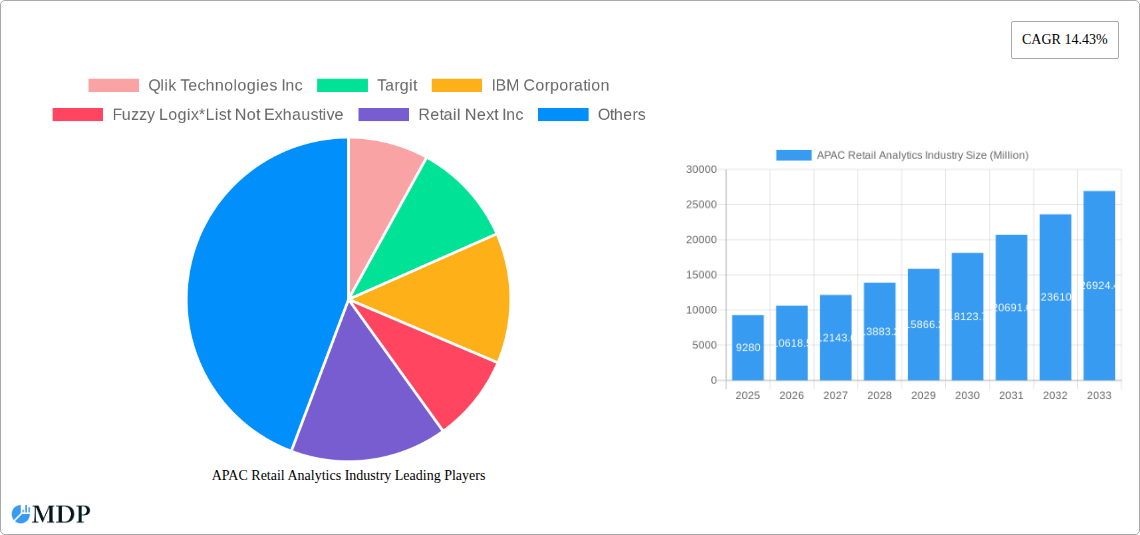
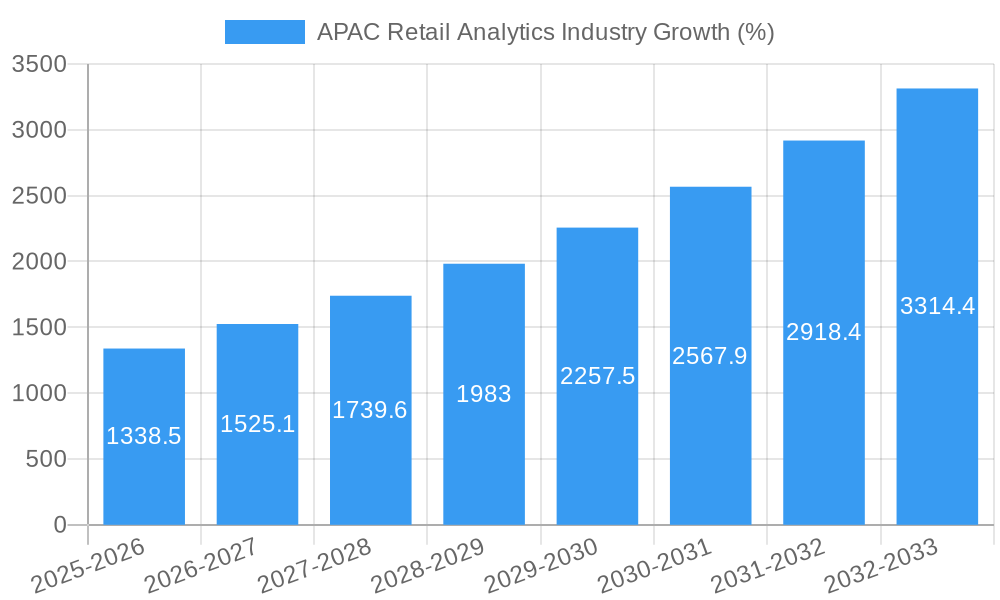
The APAC retail analytics market, valued at $9.28 billion in 2025, is experiencing robust growth, projected to expand at a Compound Annual Growth Rate (CAGR) of 14.43% from 2025 to 2033. This surge is driven by several factors. The increasing adoption of omnichannel strategies by retailers necessitates sophisticated analytics to understand customer behavior across diverse touchpoints. Furthermore, the rise of e-commerce and the resulting explosion of data create a significant demand for solutions capable of processing and interpreting this information for improved decision-making. Advanced analytics tools, including predictive modeling and machine learning, are enabling retailers to optimize pricing, personalize marketing campaigns, and streamline supply chain operations, leading to enhanced efficiency and profitability. The market is segmented by business type (SMEs and large organizations), deployment mode (on-premise and on-demand), type (solutions and services), and module type (covering strategy, marketing, finance, operations, merchandising, and supply chain). Large-scale organizations are currently driving a significant portion of the market, but the increasing digitalization of SMEs is expected to fuel growth in this segment. The on-demand deployment model is gaining popularity due to its scalability and cost-effectiveness. The strong presence of established players like IBM, SAP, and Oracle, alongside innovative startups, fosters healthy competition and innovation within the APAC region.
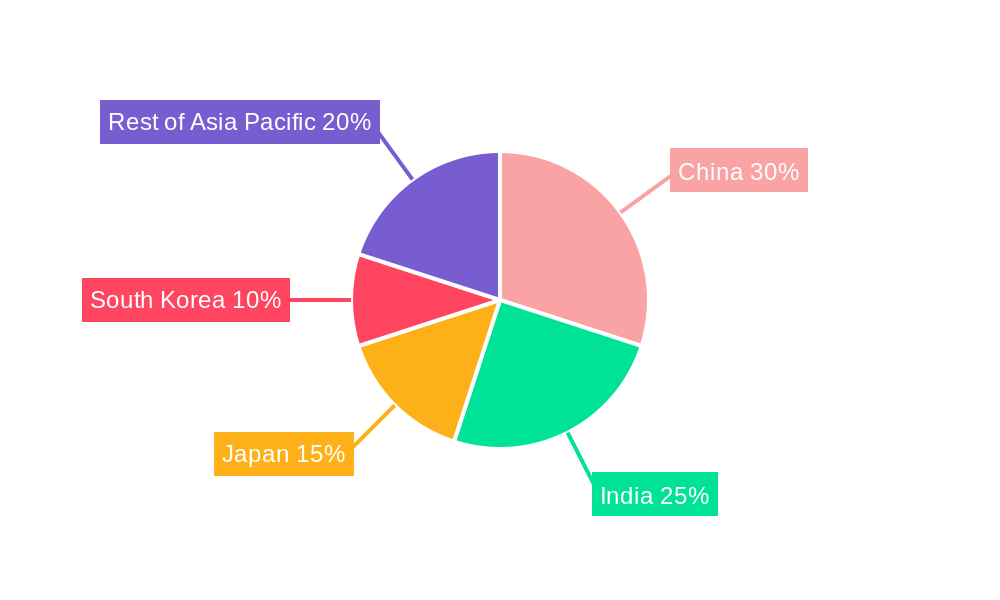
The growth trajectory is expected to be particularly strong in key markets like China, India, and Japan, reflecting their burgeoning retail sectors and increasing adoption of technology. However, challenges remain. Data security and privacy concerns, the need for skilled analytics professionals, and the integration complexities of existing legacy systems can impede adoption. Nevertheless, the overall outlook for the APAC retail analytics market remains exceptionally positive. The continuous advancements in artificial intelligence (AI) and big data technologies, coupled with the growing demand for data-driven decision-making, are poised to accelerate market expansion throughout the forecast period. The focus on enhancing customer experience and optimizing operational efficiency will further fuel this growth, making the APAC region a focal point for retail analytics investment and innovation.
APAC Retail Analytics Industry: Market Report 2019-2033
This comprehensive report provides an in-depth analysis of the APAC Retail Analytics industry, covering market dynamics, leading players, emerging trends, and future growth projections from 2019 to 2033. With a base year of 2025 and an estimated year of 2025, this report offers invaluable insights for businesses, investors, and stakeholders seeking to navigate this rapidly evolving sector. The report projects a market valued at xx Million by 2033.
APAC Retail Analytics Industry Market Dynamics & Concentration
The APAC retail analytics market is characterized by a dynamic interplay of factors influencing its growth and concentration. Market concentration is moderate, with several key players holding significant market share, but also a substantial number of smaller, specialized firms. Innovation is a key driver, fueled by advancements in big data technologies, artificial intelligence (AI), and machine learning (ML). Stringent data privacy regulations across different APAC nations are shaping the competitive landscape, necessitating compliance and influencing the adoption of analytics solutions. The market witnesses continuous product substitution as newer, more efficient solutions emerge, replacing legacy systems. End-user trends indicate a growing preference for cloud-based solutions and real-time analytics capabilities. Mergers and acquisitions (M&A) activity is significant, with xx M&A deals recorded between 2019 and 2024, mainly driven by larger players seeking to expand their market presence and capabilities. Market share analysis reveals that the top 5 players collectively hold approximately xx% of the market, with the remaining share distributed among numerous smaller players.
- Market Share: Top 5 players: xx% ; Others: xx%
- M&A Deal Count (2019-2024): xx
- Key Innovation Drivers: AI, ML, Big Data
- Regulatory Landscape: Varies significantly across countries, influencing data privacy and compliance.
APAC Retail Analytics Industry Industry Trends & Analysis
The APAC retail analytics market exhibits robust growth, driven by factors such as the increasing adoption of e-commerce, the rise of omnichannel retailing, and the growing need for data-driven decision-making among retailers. The market is experiencing technological disruptions, particularly with the increasing adoption of cloud computing, AI-powered analytics, and advanced visualization tools. Consumer preferences are shifting toward personalized experiences and seamless omnichannel interactions, creating a demand for sophisticated analytics solutions that can cater to individual customer needs. The competitive dynamics are intensely competitive, with both established players and new entrants vying for market share. The industry's CAGR from 2025 to 2033 is projected to be xx%, driven by increasing digitalization and the growing adoption of retail analytics across various business segments. Market penetration is expected to reach xx% by 2033.
Leading Markets & Segments in APAC Retail Analytics Industry
The APAC retail analytics market is characterized by diverse growth across various segments. While xx region shows the highest market dominance, substantial growth is observed in countries like China, India, and Japan.
By Business Type:
- Large-scale Organizations: Dominate the market due to higher budgets and greater need for advanced analytics. Key drivers include increased investment in digital transformation and a focus on data-driven decision-making.
- Small and Medium Enterprises (SMEs): Show significant growth potential, driven by increasing affordability of cloud-based solutions and a growing understanding of the benefits of data analytics. Key drivers include government initiatives to promote digitalization and access to affordable cloud services.
By Mode of Deployment:
- On-Demand: Experiences rapid growth due to its flexibility, scalability, and cost-effectiveness. Key drivers include the increasing adoption of cloud-based solutions and the preference for pay-as-you-go models.
- On-Premise: Remains relevant for organizations with stringent data security requirements or legacy systems. Key drivers include the need for high levels of data security and control.
By Type:
- Solutions: Analytics, visualization tools, and data management solutions are in high demand, with strong growth anticipated across all categories.
- Services: Integration, support, and consulting services are crucial for successful implementation and adoption of analytics solutions.
By Module Type:
- Marketing (Pricing, Loyalty, and Segment Analysis): A high-growth segment, driven by the growing need for personalized marketing and targeted promotions.
- Supply Chain Management (Inventory, Vendor, and Supply-Demand Modelling): This segment witnesses high demand as retailers focus on optimizing their supply chains for greater efficiency and resilience.
- Store Operations (Fraud Detection, Workforce Analytics): Growing rapidly as retailers seek to enhance operational efficiency and mitigate risks.
Other module types, including strategy & planning, financial management, and merchandising, also contribute significantly to the market growth, with the overall market showing promising prospects across all module categories.
APAC Retail Analytics Industry Product Developments
The APAC retail analytics market is witnessing rapid product innovation, driven by advancements in AI, ML, and big data technologies. New solutions are offering enhanced functionalities, including predictive analytics, real-time dashboards, and advanced visualization capabilities. These innovations are helping retailers to gain deeper insights into customer behavior, optimize pricing strategies, improve supply chain efficiency, and personalize the customer experience. The focus is on creating user-friendly, scalable, and integrated solutions that can seamlessly integrate with existing systems. This market fit emphasizes ease of implementation, cost-effectiveness, and the ability to deliver actionable insights.
Key Drivers of APAC Retail Analytics Industry Growth
The growth of the APAC retail analytics industry is primarily driven by technological advancements, favorable economic conditions in several key markets, and government initiatives promoting digitalization. Technological advancements like AI, ML, and cloud computing are enhancing the capabilities of analytics solutions, making them more powerful and accessible. The expansion of e-commerce and omnichannel retail strategies across the region requires robust analytics to manage inventory, optimize pricing, and personalize customer experiences. Moreover, favorable government policies aimed at promoting digital transformation are driving adoption across various business segments.
Challenges in the APAC Retail Analytics Industry Market
Several factors pose challenges to the growth of the APAC retail analytics market. These include the complexities of integrating data from various sources, the need for robust data security and privacy measures (complying with regulations like GDPR and other regional data protection laws), the high cost of implementation for some advanced solutions, and the shortage of skilled professionals to effectively manage and interpret analytics data. Furthermore, the competitive landscape presents a challenge with many players competing for market share. These hurdles create barriers to entry and limit the widespread adoption of retail analytics solutions, impacting overall market growth by an estimated xx Million annually.
Emerging Opportunities in the APAC Retail Analytics Industry
Significant opportunities exist for long-term growth in the APAC retail analytics market. The increasing adoption of mobile technologies, the growth of social commerce, and the expanding use of Internet of Things (IoT) devices will generate vast quantities of data, requiring sophisticated analytics solutions for effective management and interpretation. Strategic partnerships between technology providers and retailers are crucial to enhance market penetration and accelerate the adoption of advanced analytics solutions. Furthermore, expanding into untapped markets within the APAC region presents significant growth opportunities.
Leading Players in the APAC Retail Analytics Industry Sector
- Qlik Technologies Inc
- Targit
- IBM Corporation
- Fuzzy Logix
- Retail Next Inc
- Adobe Systems Incorporated
- Pentaho Corporation
- Microstrategy Inc
- Zoho Corporation
- Tableau Software Inc
- Alteryx Inc
- Oracle Corporation
- ZAP Business Intelligence
- SAP SE
- Prevedere Software Inc
Key Milestones in APAC Retail Analytics Industry Industry
- August 2022: Maxis' investment in ComeBy signals growing interest in in-store shopper analytics and enhances the capabilities of brick-and-mortar retail analytics.
- June 2022: Amazon's launch of Store Analytics provides valuable insights into consumer behavior within its frictionless stores, driving innovation in CPG analytics.
Strategic Outlook for APAC Retail Analytics Industry Market
The APAC retail analytics market is poised for significant growth, driven by technological advancements, expanding e-commerce, and rising demand for data-driven decision-making. Strategic partnerships, investments in R&D, and a focus on user-friendly and scalable solutions will be key success factors. The market presents significant opportunities for both established players and new entrants, particularly in segments such as AI-powered analytics, omnichannel solutions, and personalized customer experiences. The future potential lies in leveraging advanced technologies to enhance customer engagement, optimize operations, and drive sustainable growth for retailers across the APAC region.
APAC Retail Analytics Industry Segmentation
-
1. Mode of Deployment
- 1.1. On-Premise
- 1.2. On-Demand
-
2. Type
- 2.1. Solution
- 2.2. Services (Integration, Support & Consulting)
-
3. Module Type
- 3.1. Strategy
- 3.2. Marketing (Pricing, Loyalty and Segment Analysis)
- 3.3. Financial Management (Accounts Management)
- 3.4. Store Op
- 3.5. Merchand
- 3.6. Supply C
- 3.7. Other Module Types
-
4. Business Type
- 4.1. Small and Medium Enterprises
- 4.2. Large-scale Organizations
-
5. Geography
- 5.1. China
- 5.2. India
- 5.3. Japan
- 5.4. South Korea
APAC Retail Analytics Industry Segmentation By Geography
- 1. China
- 2. India
- 3. Japan
- 4. South Korea
APAC Retail Analytics Industry REPORT HIGHLIGHTS
| Aspects | Details |
|---|---|
| Study Period | 2019-2033 |
| Base Year | 2024 |
| Estimated Year | 2025 |
| Forecast Period | 2025-2033 |
| Historical Period | 2019-2024 |
| Growth Rate | CAGR of 14.43% from 2019-2033 |
| Segmentation |
|
Table of Contents
- 1. Introduction
- 1.1. Research Scope
- 1.2. Market Segmentation
- 1.3. Research Methodology
- 1.4. Definitions and Assumptions
- 2. Executive Summary
- 2.1. Introduction
- 3. Market Dynamics
- 3.1. Introduction
- 3.2. Market Drivers
- 3.2.1. Increased Emphasis on Predictive Analysis; Sustained increase in volume of data; Growing demand for sales forecasting
- 3.3. Market Restrains
- 3.3.1. Lack of general awareness and expertise in emerging regions; Standardization and Integration issues
- 3.4. Market Trends
- 3.4.1. Solutions Segment is Anticipated to Hold Major Market Share
- 4. Market Factor Analysis
- 4.1. Porters Five Forces
- 4.2. Supply/Value Chain
- 4.3. PESTEL analysis
- 4.4. Market Entropy
- 4.5. Patent/Trademark Analysis
- 5. APAC Retail Analytics Industry Analysis, Insights and Forecast, 2019-2031
- 5.1. Market Analysis, Insights and Forecast - by Mode of Deployment
- 5.1.1. On-Premise
- 5.1.2. On-Demand
- 5.2. Market Analysis, Insights and Forecast - by Type
- 5.2.1. Solution
- 5.2.2. Services (Integration, Support & Consulting)
- 5.3. Market Analysis, Insights and Forecast - by Module Type
- 5.3.1. Strategy
- 5.3.2. Marketing (Pricing, Loyalty and Segment Analysis)
- 5.3.3. Financial Management (Accounts Management)
- 5.3.4. Store Op
- 5.3.5. Merchand
- 5.3.6. Supply C
- 5.3.7. Other Module Types
- 5.4. Market Analysis, Insights and Forecast - by Business Type
- 5.4.1. Small and Medium Enterprises
- 5.4.2. Large-scale Organizations
- 5.5. Market Analysis, Insights and Forecast - by Geography
- 5.5.1. China
- 5.5.2. India
- 5.5.3. Japan
- 5.5.4. South Korea
- 5.6. Market Analysis, Insights and Forecast - by Region
- 5.6.1. China
- 5.6.2. India
- 5.6.3. Japan
- 5.6.4. South Korea
- 5.1. Market Analysis, Insights and Forecast - by Mode of Deployment
- 6. China APAC Retail Analytics Industry Analysis, Insights and Forecast, 2019-2031
- 6.1. Market Analysis, Insights and Forecast - by Mode of Deployment
- 6.1.1. On-Premise
- 6.1.2. On-Demand
- 6.2. Market Analysis, Insights and Forecast - by Type
- 6.2.1. Solution
- 6.2.2. Services (Integration, Support & Consulting)
- 6.3. Market Analysis, Insights and Forecast - by Module Type
- 6.3.1. Strategy
- 6.3.2. Marketing (Pricing, Loyalty and Segment Analysis)
- 6.3.3. Financial Management (Accounts Management)
- 6.3.4. Store Op
- 6.3.5. Merchand
- 6.3.6. Supply C
- 6.3.7. Other Module Types
- 6.4. Market Analysis, Insights and Forecast - by Business Type
- 6.4.1. Small and Medium Enterprises
- 6.4.2. Large-scale Organizations
- 6.5. Market Analysis, Insights and Forecast - by Geography
- 6.5.1. China
- 6.5.2. India
- 6.5.3. Japan
- 6.5.4. South Korea
- 6.1. Market Analysis, Insights and Forecast - by Mode of Deployment
- 7. India APAC Retail Analytics Industry Analysis, Insights and Forecast, 2019-2031
- 7.1. Market Analysis, Insights and Forecast - by Mode of Deployment
- 7.1.1. On-Premise
- 7.1.2. On-Demand
- 7.2. Market Analysis, Insights and Forecast - by Type
- 7.2.1. Solution
- 7.2.2. Services (Integration, Support & Consulting)
- 7.3. Market Analysis, Insights and Forecast - by Module Type
- 7.3.1. Strategy
- 7.3.2. Marketing (Pricing, Loyalty and Segment Analysis)
- 7.3.3. Financial Management (Accounts Management)
- 7.3.4. Store Op
- 7.3.5. Merchand
- 7.3.6. Supply C
- 7.3.7. Other Module Types
- 7.4. Market Analysis, Insights and Forecast - by Business Type
- 7.4.1. Small and Medium Enterprises
- 7.4.2. Large-scale Organizations
- 7.5. Market Analysis, Insights and Forecast - by Geography
- 7.5.1. China
- 7.5.2. India
- 7.5.3. Japan
- 7.5.4. South Korea
- 7.1. Market Analysis, Insights and Forecast - by Mode of Deployment
- 8. Japan APAC Retail Analytics Industry Analysis, Insights and Forecast, 2019-2031
- 8.1. Market Analysis, Insights and Forecast - by Mode of Deployment
- 8.1.1. On-Premise
- 8.1.2. On-Demand
- 8.2. Market Analysis, Insights and Forecast - by Type
- 8.2.1. Solution
- 8.2.2. Services (Integration, Support & Consulting)
- 8.3. Market Analysis, Insights and Forecast - by Module Type
- 8.3.1. Strategy
- 8.3.2. Marketing (Pricing, Loyalty and Segment Analysis)
- 8.3.3. Financial Management (Accounts Management)
- 8.3.4. Store Op
- 8.3.5. Merchand
- 8.3.6. Supply C
- 8.3.7. Other Module Types
- 8.4. Market Analysis, Insights and Forecast - by Business Type
- 8.4.1. Small and Medium Enterprises
- 8.4.2. Large-scale Organizations
- 8.5. Market Analysis, Insights and Forecast - by Geography
- 8.5.1. China
- 8.5.2. India
- 8.5.3. Japan
- 8.5.4. South Korea
- 8.1. Market Analysis, Insights and Forecast - by Mode of Deployment
- 9. South Korea APAC Retail Analytics Industry Analysis, Insights and Forecast, 2019-2031
- 9.1. Market Analysis, Insights and Forecast - by Mode of Deployment
- 9.1.1. On-Premise
- 9.1.2. On-Demand
- 9.2. Market Analysis, Insights and Forecast - by Type
- 9.2.1. Solution
- 9.2.2. Services (Integration, Support & Consulting)
- 9.3. Market Analysis, Insights and Forecast - by Module Type
- 9.3.1. Strategy
- 9.3.2. Marketing (Pricing, Loyalty and Segment Analysis)
- 9.3.3. Financial Management (Accounts Management)
- 9.3.4. Store Op
- 9.3.5. Merchand
- 9.3.6. Supply C
- 9.3.7. Other Module Types
- 9.4. Market Analysis, Insights and Forecast - by Business Type
- 9.4.1. Small and Medium Enterprises
- 9.4.2. Large-scale Organizations
- 9.5. Market Analysis, Insights and Forecast - by Geography
- 9.5.1. China
- 9.5.2. India
- 9.5.3. Japan
- 9.5.4. South Korea
- 9.1. Market Analysis, Insights and Forecast - by Mode of Deployment
- 10. China APAC Retail Analytics Industry Analysis, Insights and Forecast, 2019-2031
- 10.1. Market Analysis, Insights and Forecast - By Country/Sub-region
- 10.1.1.
- 11. India APAC Retail Analytics Industry Analysis, Insights and Forecast, 2019-2031
- 11.1. Market Analysis, Insights and Forecast - By Country/Sub-region
- 11.1.1.
- 12. Japan APAC Retail Analytics Industry Analysis, Insights and Forecast, 2019-2031
- 12.1. Market Analysis, Insights and Forecast - By Country/Sub-region
- 12.1.1.
- 13. South Korea APAC Retail Analytics Industry Analysis, Insights and Forecast, 2019-2031
- 13.1. Market Analysis, Insights and Forecast - By Country/Sub-region
- 13.1.1.
- 14. Rest of Asia Pacific APAC Retail Analytics Industry Analysis, Insights and Forecast, 2019-2031
- 14.1. Market Analysis, Insights and Forecast - By Country/Sub-region
- 14.1.1.
- 15. Competitive Analysis
- 15.1. Market Share Analysis 2024
- 15.2. Company Profiles
- 15.2.1 Qlik Technologies Inc
- 15.2.1.1. Overview
- 15.2.1.2. Products
- 15.2.1.3. SWOT Analysis
- 15.2.1.4. Recent Developments
- 15.2.1.5. Financials (Based on Availability)
- 15.2.2 Targit
- 15.2.2.1. Overview
- 15.2.2.2. Products
- 15.2.2.3. SWOT Analysis
- 15.2.2.4. Recent Developments
- 15.2.2.5. Financials (Based on Availability)
- 15.2.3 IBM Corporation
- 15.2.3.1. Overview
- 15.2.3.2. Products
- 15.2.3.3. SWOT Analysis
- 15.2.3.4. Recent Developments
- 15.2.3.5. Financials (Based on Availability)
- 15.2.4 Fuzzy Logix*List Not Exhaustive
- 15.2.4.1. Overview
- 15.2.4.2. Products
- 15.2.4.3. SWOT Analysis
- 15.2.4.4. Recent Developments
- 15.2.4.5. Financials (Based on Availability)
- 15.2.5 Retail Next Inc
- 15.2.5.1. Overview
- 15.2.5.2. Products
- 15.2.5.3. SWOT Analysis
- 15.2.5.4. Recent Developments
- 15.2.5.5. Financials (Based on Availability)
- 15.2.6 Adobe Systems Incorporated
- 15.2.6.1. Overview
- 15.2.6.2. Products
- 15.2.6.3. SWOT Analysis
- 15.2.6.4. Recent Developments
- 15.2.6.5. Financials (Based on Availability)
- 15.2.7 Pentaho Corporation
- 15.2.7.1. Overview
- 15.2.7.2. Products
- 15.2.7.3. SWOT Analysis
- 15.2.7.4. Recent Developments
- 15.2.7.5. Financials (Based on Availability)
- 15.2.8 Microstrategy Inc
- 15.2.8.1. Overview
- 15.2.8.2. Products
- 15.2.8.3. SWOT Analysis
- 15.2.8.4. Recent Developments
- 15.2.8.5. Financials (Based on Availability)
- 15.2.9 Zoho Corporation
- 15.2.9.1. Overview
- 15.2.9.2. Products
- 15.2.9.3. SWOT Analysis
- 15.2.9.4. Recent Developments
- 15.2.9.5. Financials (Based on Availability)
- 15.2.10 Tableau Software Inc
- 15.2.10.1. Overview
- 15.2.10.2. Products
- 15.2.10.3. SWOT Analysis
- 15.2.10.4. Recent Developments
- 15.2.10.5. Financials (Based on Availability)
- 15.2.11 Alteryx Inc
- 15.2.11.1. Overview
- 15.2.11.2. Products
- 15.2.11.3. SWOT Analysis
- 15.2.11.4. Recent Developments
- 15.2.11.5. Financials (Based on Availability)
- 15.2.12 Oracle Corporation
- 15.2.12.1. Overview
- 15.2.12.2. Products
- 15.2.12.3. SWOT Analysis
- 15.2.12.4. Recent Developments
- 15.2.12.5. Financials (Based on Availability)
- 15.2.13 ZAP Business Intelligence
- 15.2.13.1. Overview
- 15.2.13.2. Products
- 15.2.13.3. SWOT Analysis
- 15.2.13.4. Recent Developments
- 15.2.13.5. Financials (Based on Availability)
- 15.2.14 SAP SE
- 15.2.14.1. Overview
- 15.2.14.2. Products
- 15.2.14.3. SWOT Analysis
- 15.2.14.4. Recent Developments
- 15.2.14.5. Financials (Based on Availability)
- 15.2.15 Prevedere Software Inc
- 15.2.15.1. Overview
- 15.2.15.2. Products
- 15.2.15.3. SWOT Analysis
- 15.2.15.4. Recent Developments
- 15.2.15.5. Financials (Based on Availability)
- 15.2.1 Qlik Technologies Inc
List of Figures
- Figure 1: APAC Retail Analytics Industry Revenue Breakdown (Million, %) by Product 2024 & 2032
- Figure 2: APAC Retail Analytics Industry Share (%) by Company 2024
List of Tables
- Table 1: APAC Retail Analytics Industry Revenue Million Forecast, by Region 2019 & 2032
- Table 2: APAC Retail Analytics Industry Revenue Million Forecast, by Mode of Deployment 2019 & 2032
- Table 3: APAC Retail Analytics Industry Revenue Million Forecast, by Type 2019 & 2032
- Table 4: APAC Retail Analytics Industry Revenue Million Forecast, by Module Type 2019 & 2032
- Table 5: APAC Retail Analytics Industry Revenue Million Forecast, by Business Type 2019 & 2032
- Table 6: APAC Retail Analytics Industry Revenue Million Forecast, by Geography 2019 & 2032
- Table 7: APAC Retail Analytics Industry Revenue Million Forecast, by Region 2019 & 2032
- Table 8: APAC Retail Analytics Industry Revenue Million Forecast, by Country 2019 & 2032
- Table 9: APAC Retail Analytics Industry Revenue (Million) Forecast, by Application 2019 & 2032
- Table 10: APAC Retail Analytics Industry Revenue Million Forecast, by Country 2019 & 2032
- Table 11: APAC Retail Analytics Industry Revenue (Million) Forecast, by Application 2019 & 2032
- Table 12: APAC Retail Analytics Industry Revenue Million Forecast, by Country 2019 & 2032
- Table 13: APAC Retail Analytics Industry Revenue (Million) Forecast, by Application 2019 & 2032
- Table 14: APAC Retail Analytics Industry Revenue Million Forecast, by Country 2019 & 2032
- Table 15: APAC Retail Analytics Industry Revenue (Million) Forecast, by Application 2019 & 2032
- Table 16: APAC Retail Analytics Industry Revenue Million Forecast, by Country 2019 & 2032
- Table 17: APAC Retail Analytics Industry Revenue (Million) Forecast, by Application 2019 & 2032
- Table 18: APAC Retail Analytics Industry Revenue Million Forecast, by Mode of Deployment 2019 & 2032
- Table 19: APAC Retail Analytics Industry Revenue Million Forecast, by Type 2019 & 2032
- Table 20: APAC Retail Analytics Industry Revenue Million Forecast, by Module Type 2019 & 2032
- Table 21: APAC Retail Analytics Industry Revenue Million Forecast, by Business Type 2019 & 2032
- Table 22: APAC Retail Analytics Industry Revenue Million Forecast, by Geography 2019 & 2032
- Table 23: APAC Retail Analytics Industry Revenue Million Forecast, by Country 2019 & 2032
- Table 24: APAC Retail Analytics Industry Revenue Million Forecast, by Mode of Deployment 2019 & 2032
- Table 25: APAC Retail Analytics Industry Revenue Million Forecast, by Type 2019 & 2032
- Table 26: APAC Retail Analytics Industry Revenue Million Forecast, by Module Type 2019 & 2032
- Table 27: APAC Retail Analytics Industry Revenue Million Forecast, by Business Type 2019 & 2032
- Table 28: APAC Retail Analytics Industry Revenue Million Forecast, by Geography 2019 & 2032
- Table 29: APAC Retail Analytics Industry Revenue Million Forecast, by Country 2019 & 2032
- Table 30: APAC Retail Analytics Industry Revenue Million Forecast, by Mode of Deployment 2019 & 2032
- Table 31: APAC Retail Analytics Industry Revenue Million Forecast, by Type 2019 & 2032
- Table 32: APAC Retail Analytics Industry Revenue Million Forecast, by Module Type 2019 & 2032
- Table 33: APAC Retail Analytics Industry Revenue Million Forecast, by Business Type 2019 & 2032
- Table 34: APAC Retail Analytics Industry Revenue Million Forecast, by Geography 2019 & 2032
- Table 35: APAC Retail Analytics Industry Revenue Million Forecast, by Country 2019 & 2032
- Table 36: APAC Retail Analytics Industry Revenue Million Forecast, by Mode of Deployment 2019 & 2032
- Table 37: APAC Retail Analytics Industry Revenue Million Forecast, by Type 2019 & 2032
- Table 38: APAC Retail Analytics Industry Revenue Million Forecast, by Module Type 2019 & 2032
- Table 39: APAC Retail Analytics Industry Revenue Million Forecast, by Business Type 2019 & 2032
- Table 40: APAC Retail Analytics Industry Revenue Million Forecast, by Geography 2019 & 2032
- Table 41: APAC Retail Analytics Industry Revenue Million Forecast, by Country 2019 & 2032
Frequently Asked Questions
1. What is the projected Compound Annual Growth Rate (CAGR) of the APAC Retail Analytics Industry?
The projected CAGR is approximately 14.43%.
2. Which companies are prominent players in the APAC Retail Analytics Industry?
Key companies in the market include Qlik Technologies Inc, Targit, IBM Corporation, Fuzzy Logix*List Not Exhaustive, Retail Next Inc, Adobe Systems Incorporated, Pentaho Corporation, Microstrategy Inc, Zoho Corporation, Tableau Software Inc, Alteryx Inc, Oracle Corporation, ZAP Business Intelligence, SAP SE, Prevedere Software Inc.
3. What are the main segments of the APAC Retail Analytics Industry?
The market segments include Mode of Deployment, Type, Module Type, Business Type, Geography.
4. Can you provide details about the market size?
The market size is estimated to be USD 9.28 Million as of 2022.
5. What are some drivers contributing to market growth?
Increased Emphasis on Predictive Analysis; Sustained increase in volume of data; Growing demand for sales forecasting.
6. What are the notable trends driving market growth?
Solutions Segment is Anticipated to Hold Major Market Share.
7. Are there any restraints impacting market growth?
Lack of general awareness and expertise in emerging regions; Standardization and Integration issues.
8. Can you provide examples of recent developments in the market?
August 2022: Maxis invested in ComeBy, a Malaysia-based retail analytics startup, to bolster innovation and digitalization within the retail industry. ComeBy offers brick-and-mortar retailers valuable insights into individual shopper preferences before reaching the checkout counter. The company asserts that its approach, which combines both active and passive tracking, enhances customer engagement and optimizes in-store sales, as well as remarketing and merchandising efforts.
9. What pricing options are available for accessing the report?
Pricing options include single-user, multi-user, and enterprise licenses priced at USD 3800, USD 4500, and USD 5800 respectively.
10. Is the market size provided in terms of value or volume?
The market size is provided in terms of value, measured in Million.
11. Are there any specific market keywords associated with the report?
Yes, the market keyword associated with the report is "APAC Retail Analytics Industry," which aids in identifying and referencing the specific market segment covered.
12. How do I determine which pricing option suits my needs best?
The pricing options vary based on user requirements and access needs. Individual users may opt for single-user licenses, while businesses requiring broader access may choose multi-user or enterprise licenses for cost-effective access to the report.
13. Are there any additional resources or data provided in the APAC Retail Analytics Industry report?
While the report offers comprehensive insights, it's advisable to review the specific contents or supplementary materials provided to ascertain if additional resources or data are available.
14. How can I stay updated on further developments or reports in the APAC Retail Analytics Industry?
To stay informed about further developments, trends, and reports in the APAC Retail Analytics Industry, consider subscribing to industry newsletters, following relevant companies and organizations, or regularly checking reputable industry news sources and publications.
Methodology
Step 1 - Identification of Relevant Samples Size from Population Database


Step 2 - Approaches for Defining Global Market Size (Value, Volume* & Price*)

Note*: In applicable scenarios
Step 3 - Data Sources
Primary Research
- Web Analytics
- Survey Reports
- Research Institute
- Latest Research Reports
- Opinion Leaders
Secondary Research
- Annual Reports
- White Paper
- Latest Press Release
- Industry Association
- Paid Database
- Investor Presentations

Step 4 - Data Triangulation
Involves using different sources of information in order to increase the validity of a study
These sources are likely to be stakeholders in a program - participants, other researchers, program staff, other community members, and so on.
Then we put all data in single framework & apply various statistical tools to find out the dynamic on the market.
During the analysis stage, feedback from the stakeholder groups would be compared to determine areas of agreement as well as areas of divergence
