

Key Insights
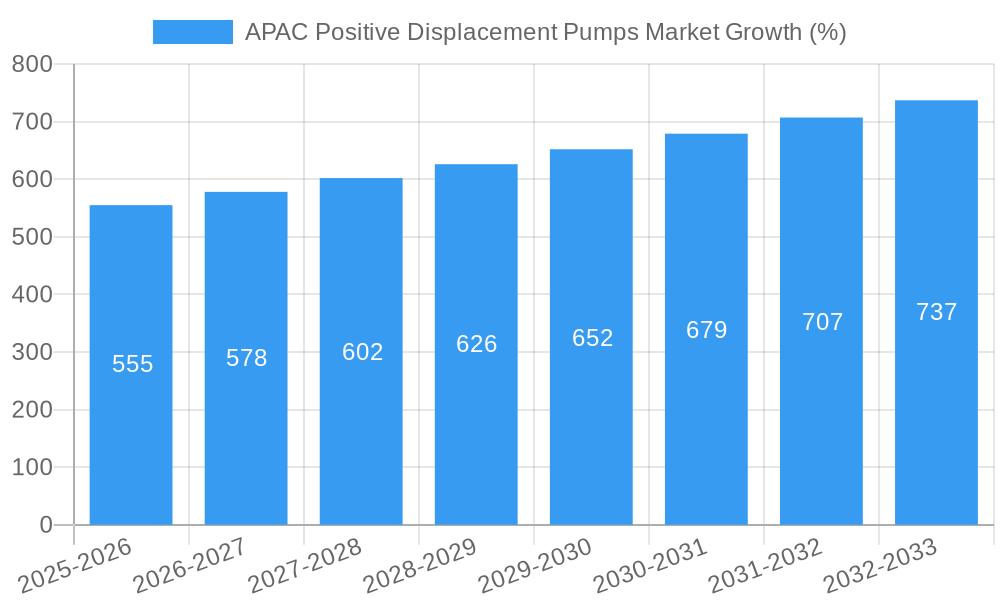
The Asia-Pacific (APAC) positive displacement pumps market is experiencing steady growth, driven by robust industrial expansion across various sectors. The region's burgeoning manufacturing, particularly in China, India, and South Korea, fuels significant demand for reliable and efficient pumping solutions. The 3.67% CAGR indicates a consistent upward trajectory, projected to continue through 2033. Key drivers include the increasing automation in industries like oil & gas, chemicals, and food & beverage, coupled with stringent environmental regulations promoting efficient fluid handling. The market is segmented by pump type (diaphragm, piston, gear, etc.), end-user industry, and geography. While China dominates the market currently, India and other Southeast Asian nations are witnessing rapidly increasing adoption, contributing to the overall regional growth. The rising demand for advanced features like precise flow control, energy efficiency, and remote monitoring further propels market expansion. However, factors such as fluctuating raw material prices and potential supply chain disruptions could pose challenges to sustained growth. The competitive landscape features both global players like The Weir Group and Sulzer AG and regional manufacturers, leading to innovation and varied product offerings within the APAC market. Market segments like pharmaceutical and wastewater treatment are expected to show strong growth due to increasing investments in infrastructure and stricter regulatory requirements.
The forecast for the APAC positive displacement pumps market reflects a positive outlook, underpinned by consistent economic growth and infrastructural development across the region. The increasing adoption of automation and smart technologies in various industries is further stimulating market demand for advanced positive displacement pumps capable of handling diverse fluids and operating conditions. Continued expansion in the food and beverage, chemical, and pharmaceutical sectors will drive substantial growth. While competition remains intense, opportunities exist for manufacturers who can offer customized solutions tailored to specific industrial needs and prioritize energy efficiency and sustainability. Furthermore, strategic partnerships and technological advancements are likely to shape future market dynamics, impacting both market share and innovation within the APAC region.
APAC Positive Displacement Pumps Market: A Comprehensive Report (2019-2033)
This comprehensive report provides an in-depth analysis of the Asia-Pacific (APAC) Positive Displacement Pumps market, offering valuable insights for industry stakeholders, investors, and market entrants. Covering the period from 2019 to 2033, with a focus on 2025, this report unravels market dynamics, trends, and opportunities within this vital sector. The report utilizes data-driven analysis to forecast robust market growth, highlighting key segments and leading players. Download now to gain a competitive edge!
APAC Positive Displacement Pumps Market Dynamics & Concentration
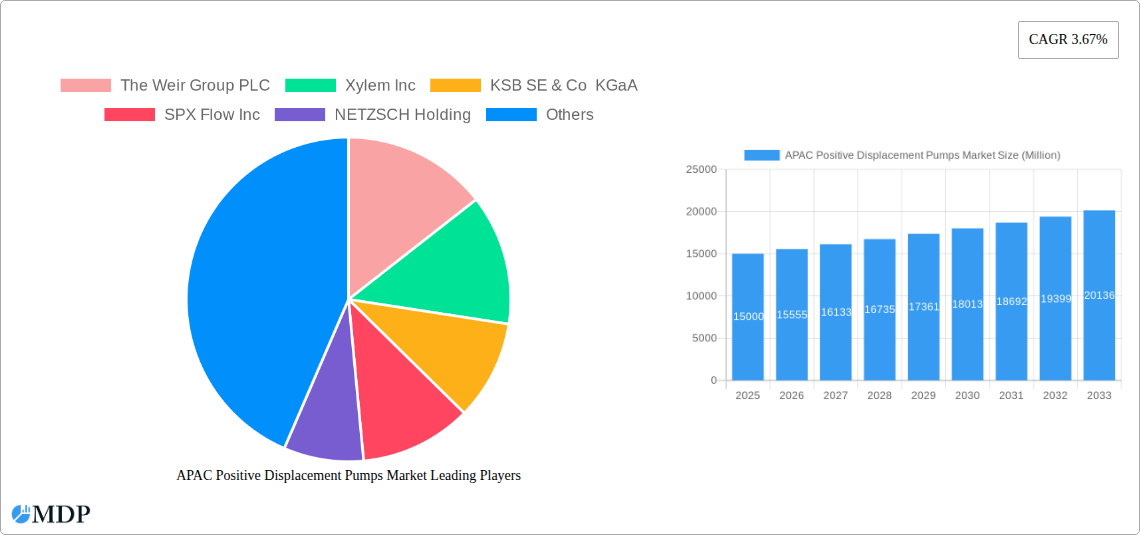
The APAC positive displacement pumps market is characterized by moderate concentration, with key players holding significant market share. The market exhibits dynamic competition, driven by innovation in pump technologies, evolving regulatory landscapes, and the emergence of substitute technologies. End-user trends, particularly within the booming chemical and pharmaceutical sectors, significantly influence market growth. Mergers and acquisitions (M&A) activity contributes to market consolidation, with an estimated xx M&A deals occurring between 2019 and 2024. Major players such as The Weir Group PLC, Xylem Inc, and Grundfos, among others, are actively shaping the market through strategic acquisitions and product launches. Market share analysis reveals that the top five players collectively control approximately xx% of the market, indicating a competitive yet concentrated landscape.
- Market Concentration: Moderate, with top 5 players holding approximately xx% market share.
- Innovation Drivers: Advancements in materials science, automation, and digital technologies.
- Regulatory Frameworks: Stringent environmental regulations driving demand for energy-efficient pumps.
- Product Substitutes: Growing competition from alternative pumping technologies, impacting market share of certain pump types.
- End-User Trends: Rising demand from chemical, pharmaceutical, and food & beverage sectors.
- M&A Activity: xx M&A deals between 2019 and 2024, indicating market consolidation.
APAC Positive Displacement Pumps Market Industry Trends & Analysis
The APAC positive displacement pumps market is experiencing robust growth, projected to reach xx Million by 2033, exhibiting a CAGR of xx% during the forecast period (2025-2033). This growth is fueled by several factors including increasing industrialization, infrastructural development across the region, and rising demand from various end-user industries. Technological disruptions, such as the adoption of smart pumps and IoT-enabled monitoring systems, are transforming the market. Consumer preference is shifting towards energy-efficient and reliable pumps, placing pressure on manufacturers to innovate. Competitive dynamics are intense, with both established players and new entrants vying for market share through strategic partnerships, product differentiation, and aggressive pricing strategies. Market penetration of advanced pump types is increasing steadily, indicating a shift towards higher efficiency and precision.
Leading Markets & Segments in APAC Positive Displacement Pumps Market
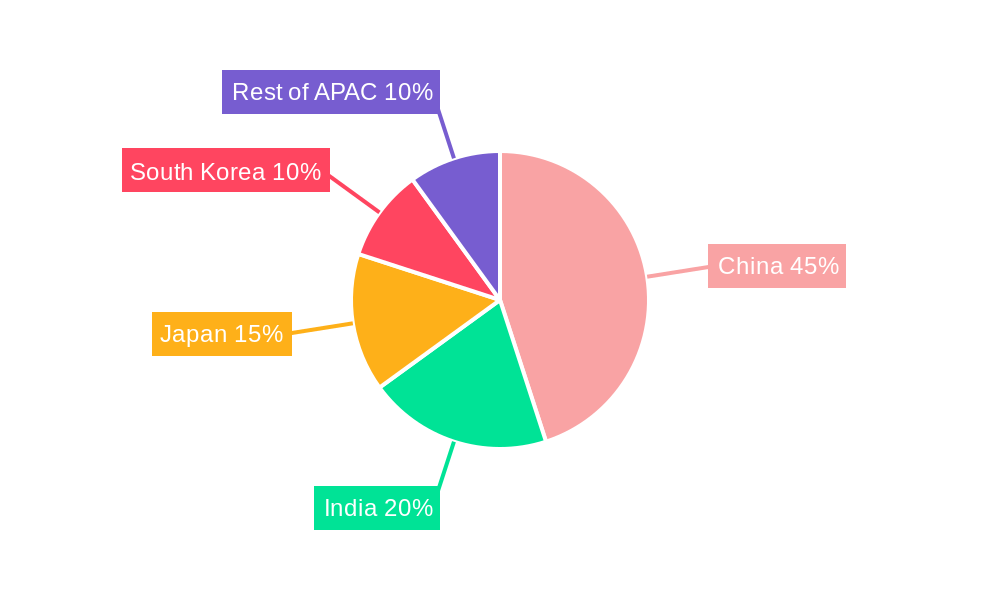
China dominates the APAC positive displacement pumps market, driven by its robust manufacturing sector and significant investments in infrastructure. India and South Korea also represent key growth markets. Within the segment breakdown, the Diaphragm and Progressive Cavity pumps lead in terms of market share, driven by their versatility and adaptability to various applications. The Oil & Gas, Chemical, and Food & Beverage sectors constitute the largest end-user industries for positive displacement pumps.
Key Drivers by Segment:
- China: Robust industrial growth, expanding infrastructure projects, government support for manufacturing.
- India: Rapid industrialization, rising investments in chemical and pharmaceutical industries.
- South Korea: Strong technological capabilities, advanced manufacturing sector.
- Diaphragm Pumps: Versatility, suitability for abrasive and viscous fluids.
- Progressive Cavity Pumps: High efficiency in handling high-viscosity fluids.
- Oil & Gas: Demand for robust and reliable pumps in upstream and downstream operations.
- Chemicals: Extensive use in various chemical processing applications.
- Food & Beverage: Stringent hygiene standards driving demand for sanitary pumps.
Dominance Analysis: China’s dominance stems from its substantial manufacturing base and large-scale industrial projects, while the dominance of Diaphragm and Progressive Cavity pumps reflects their wide applicability across diverse industries.
APAP Positive Displacement Pumps Market Product Developments
Recent years have witnessed significant innovation in positive displacement pump technology, driven by the need for higher efficiency, improved durability, and enhanced functionalities. Manufacturers are increasingly integrating smart sensors, advanced control systems, and digital technologies to optimize pump performance and reduce maintenance costs. New materials and designs are being introduced to expand the application range of these pumps, addressing the demands of diverse industries. This trend is expected to continue, with a focus on developing customized solutions tailored to specific applications and end-user needs.
Key Drivers of APAC Positive Displacement Pumps Market Growth
Several factors are driving the growth of the APAC positive displacement pumps market. Firstly, the expanding industrial sector, particularly in China and India, is fueling significant demand. Secondly, government initiatives promoting infrastructure development and industrial automation contribute to this trend. Technological advancements, such as the development of energy-efficient and smart pumps, are enhancing their appeal. Finally, the rising demand from key end-user industries, including chemicals, pharmaceuticals, and food & beverage, significantly impacts market expansion.
Challenges in the APAC Positive Displacement Pumps Market Market
The APAC positive displacement pumps market faces several challenges. Fluctuations in raw material prices impact production costs. Stringent environmental regulations necessitate the adoption of eco-friendly pump designs, adding to manufacturing complexity. Intense competition from established players and new entrants creates pressure on pricing and margins. Supply chain disruptions can lead to production delays and affect market availability, especially given the reliance on global supply chains. These factors collectively influence market growth and profitability.
Emerging Opportunities in APAC Positive Displacement Pumps Market
The APAC positive displacement pumps market presents significant opportunities for growth. Technological advancements, such as the adoption of artificial intelligence and machine learning for predictive maintenance, will enhance operational efficiency. Strategic partnerships and collaborations between manufacturers and end-users can unlock new market segments and applications. Expansion into developing economies within the region, such as Vietnam and Indonesia, will contribute to market growth. Moreover, the rising demand for sustainable and energy-efficient pumping solutions presents opportunities for innovation and product development.
Leading Players in the APAC Positive Displacement Pumps Market Sector
- The Weir Group PLC
- Xylem Inc
- KSB SE & Co KGaA
- SPX Flow Inc
- NETZSCH Holding
- TSURUMI MANUFACTURING CO LTD
- Sulzer AG
- Pentair PLC
- Atlas Copco
- GRUNDFOS
Key Milestones in APAC Positive Displacement Pumps Market Industry
- February 2022: NETZSCH Pumps and Systems launched the PERIPRO peristaltic pump, expanding its product portfolio and targeting chemical, industrial, and food sectors. This launch demonstrates a commitment to product diversification and caters to growing demands in various industries.
Strategic Outlook for APAC Positive Displacement Pumps Market Market
The APAC positive displacement pumps market presents a compelling outlook for long-term growth. Continued industrial expansion, infrastructure development, and technological advancements will drive sustained demand. Manufacturers should focus on developing innovative, energy-efficient, and sustainable pump solutions. Strategic partnerships, acquisitions, and expansion into new markets will be crucial for capturing significant market share. The market's future success hinges on embracing technological innovation, adapting to evolving regulations, and understanding the specific needs of diverse end-user industries.
APAC Positive Displacement Pumps Market Segmentation
-
1. Type
- 1.1. Diaphragm
- 1.2. Piston
- 1.3. Gear
- 1.4. Lobe
- 1.5. Progressive Cavity
- 1.6. Screw
- 1.7. Vane
- 1.8. Peristaltic
-
2. End-user Industry
- 2.1. Oil & Gas
- 2.2. Chemicals
- 2.3. Food & Beverage
- 2.4. Waste & Wastewater
- 2.5. Pharmaceutical
- 2.6. Power
- 2.7. Other End-user Industries
APAC Positive Displacement Pumps Market Segmentation By Geography
-
1. North America
- 1.1. United States
- 1.2. Canada
- 1.3. Mexico
-
2. South America
- 2.1. Brazil
- 2.2. Argentina
- 2.3. Rest of South America
-
3. Europe
- 3.1. United Kingdom
- 3.2. Germany
- 3.3. France
- 3.4. Italy
- 3.5. Spain
- 3.6. Russia
- 3.7. Benelux
- 3.8. Nordics
- 3.9. Rest of Europe
-
4. Middle East & Africa
- 4.1. Turkey
- 4.2. Israel
- 4.3. GCC
- 4.4. North Africa
- 4.5. South Africa
- 4.6. Rest of Middle East & Africa
-
5. Asia Pacific
- 5.1. China
- 5.2. India
- 5.3. Japan
- 5.4. South Korea
- 5.5. ASEAN
- 5.6. Oceania
- 5.7. Rest of Asia Pacific
APAC Positive Displacement Pumps Market REPORT HIGHLIGHTS
| Aspects | Details |
|---|---|
| Study Period | 2019-2033 |
| Base Year | 2024 |
| Estimated Year | 2025 |
| Forecast Period | 2025-2033 |
| Historical Period | 2019-2024 |
| Growth Rate | CAGR of 3.67% from 2019-2033 |
| Segmentation |
|
Table of Contents
- 1. Introduction
- 1.1. Research Scope
- 1.2. Market Segmentation
- 1.3. Research Methodology
- 1.4. Definitions and Assumptions
- 2. Executive Summary
- 2.1. Introduction
- 3. Market Dynamics
- 3.1. Introduction
- 3.2. Market Drivers
- 3.2.1. Increased Focus on Wastewater Management
- 3.3. Market Restrains
- 3.3.1. Environmental and Safe Use Concerns
- 3.4. Market Trends
- 3.4.1. Waste and Wastewater Industry is Expected to Register Significant Growth
- 4. Market Factor Analysis
- 4.1. Porters Five Forces
- 4.2. Supply/Value Chain
- 4.3. PESTEL analysis
- 4.4. Market Entropy
- 4.5. Patent/Trademark Analysis
- 5. Global APAC Positive Displacement Pumps Market Analysis, Insights and Forecast, 2019-2031
- 5.1. Market Analysis, Insights and Forecast - by Type
- 5.1.1. Diaphragm
- 5.1.2. Piston
- 5.1.3. Gear
- 5.1.4. Lobe
- 5.1.5. Progressive Cavity
- 5.1.6. Screw
- 5.1.7. Vane
- 5.1.8. Peristaltic
- 5.2. Market Analysis, Insights and Forecast - by End-user Industry
- 5.2.1. Oil & Gas
- 5.2.2. Chemicals
- 5.2.3. Food & Beverage
- 5.2.4. Waste & Wastewater
- 5.2.5. Pharmaceutical
- 5.2.6. Power
- 5.2.7. Other End-user Industries
- 5.3. Market Analysis, Insights and Forecast - by Region
- 5.3.1. North America
- 5.3.2. South America
- 5.3.3. Europe
- 5.3.4. Middle East & Africa
- 5.3.5. Asia Pacific
- 5.1. Market Analysis, Insights and Forecast - by Type
- 6. North America APAC Positive Displacement Pumps Market Analysis, Insights and Forecast, 2019-2031
- 6.1. Market Analysis, Insights and Forecast - by Type
- 6.1.1. Diaphragm
- 6.1.2. Piston
- 6.1.3. Gear
- 6.1.4. Lobe
- 6.1.5. Progressive Cavity
- 6.1.6. Screw
- 6.1.7. Vane
- 6.1.8. Peristaltic
- 6.2. Market Analysis, Insights and Forecast - by End-user Industry
- 6.2.1. Oil & Gas
- 6.2.2. Chemicals
- 6.2.3. Food & Beverage
- 6.2.4. Waste & Wastewater
- 6.2.5. Pharmaceutical
- 6.2.6. Power
- 6.2.7. Other End-user Industries
- 6.1. Market Analysis, Insights and Forecast - by Type
- 7. South America APAC Positive Displacement Pumps Market Analysis, Insights and Forecast, 2019-2031
- 7.1. Market Analysis, Insights and Forecast - by Type
- 7.1.1. Diaphragm
- 7.1.2. Piston
- 7.1.3. Gear
- 7.1.4. Lobe
- 7.1.5. Progressive Cavity
- 7.1.6. Screw
- 7.1.7. Vane
- 7.1.8. Peristaltic
- 7.2. Market Analysis, Insights and Forecast - by End-user Industry
- 7.2.1. Oil & Gas
- 7.2.2. Chemicals
- 7.2.3. Food & Beverage
- 7.2.4. Waste & Wastewater
- 7.2.5. Pharmaceutical
- 7.2.6. Power
- 7.2.7. Other End-user Industries
- 7.1. Market Analysis, Insights and Forecast - by Type
- 8. Europe APAC Positive Displacement Pumps Market Analysis, Insights and Forecast, 2019-2031
- 8.1. Market Analysis, Insights and Forecast - by Type
- 8.1.1. Diaphragm
- 8.1.2. Piston
- 8.1.3. Gear
- 8.1.4. Lobe
- 8.1.5. Progressive Cavity
- 8.1.6. Screw
- 8.1.7. Vane
- 8.1.8. Peristaltic
- 8.2. Market Analysis, Insights and Forecast - by End-user Industry
- 8.2.1. Oil & Gas
- 8.2.2. Chemicals
- 8.2.3. Food & Beverage
- 8.2.4. Waste & Wastewater
- 8.2.5. Pharmaceutical
- 8.2.6. Power
- 8.2.7. Other End-user Industries
- 8.1. Market Analysis, Insights and Forecast - by Type
- 9. Middle East & Africa APAC Positive Displacement Pumps Market Analysis, Insights and Forecast, 2019-2031
- 9.1. Market Analysis, Insights and Forecast - by Type
- 9.1.1. Diaphragm
- 9.1.2. Piston
- 9.1.3. Gear
- 9.1.4. Lobe
- 9.1.5. Progressive Cavity
- 9.1.6. Screw
- 9.1.7. Vane
- 9.1.8. Peristaltic
- 9.2. Market Analysis, Insights and Forecast - by End-user Industry
- 9.2.1. Oil & Gas
- 9.2.2. Chemicals
- 9.2.3. Food & Beverage
- 9.2.4. Waste & Wastewater
- 9.2.5. Pharmaceutical
- 9.2.6. Power
- 9.2.7. Other End-user Industries
- 9.1. Market Analysis, Insights and Forecast - by Type
- 10. Asia Pacific APAC Positive Displacement Pumps Market Analysis, Insights and Forecast, 2019-2031
- 10.1. Market Analysis, Insights and Forecast - by Type
- 10.1.1. Diaphragm
- 10.1.2. Piston
- 10.1.3. Gear
- 10.1.4. Lobe
- 10.1.5. Progressive Cavity
- 10.1.6. Screw
- 10.1.7. Vane
- 10.1.8. Peristaltic
- 10.2. Market Analysis, Insights and Forecast - by End-user Industry
- 10.2.1. Oil & Gas
- 10.2.2. Chemicals
- 10.2.3. Food & Beverage
- 10.2.4. Waste & Wastewater
- 10.2.5. Pharmaceutical
- 10.2.6. Power
- 10.2.7. Other End-user Industries
- 10.1. Market Analysis, Insights and Forecast - by Type
- 11. Brazil APAC Positive Displacement Pumps Market Analysis, Insights and Forecast, 2019-2031
- 11.1. Market Analysis, Insights and Forecast - By Country/Sub-region
- 11.1.1.
- 12. Colombia APAC Positive Displacement Pumps Market Analysis, Insights and Forecast, 2019-2031
- 12.1. Market Analysis, Insights and Forecast - By Country/Sub-region
- 12.1.1.
- 13. Mexico APAC Positive Displacement Pumps Market Analysis, Insights and Forecast, 2019-2031
- 13.1. Market Analysis, Insights and Forecast - By Country/Sub-region
- 13.1.1.
- 14. Competitive Analysis
- 14.1. Global Market Share Analysis 2024
- 14.2. Company Profiles
- 14.2.1 The Weir Group PLC
- 14.2.1.1. Overview
- 14.2.1.2. Products
- 14.2.1.3. SWOT Analysis
- 14.2.1.4. Recent Developments
- 14.2.1.5. Financials (Based on Availability)
- 14.2.2 Xylem Inc
- 14.2.2.1. Overview
- 14.2.2.2. Products
- 14.2.2.3. SWOT Analysis
- 14.2.2.4. Recent Developments
- 14.2.2.5. Financials (Based on Availability)
- 14.2.3 KSB SE & Co KGaA
- 14.2.3.1. Overview
- 14.2.3.2. Products
- 14.2.3.3. SWOT Analysis
- 14.2.3.4. Recent Developments
- 14.2.3.5. Financials (Based on Availability)
- 14.2.4 SPX Flow Inc
- 14.2.4.1. Overview
- 14.2.4.2. Products
- 14.2.4.3. SWOT Analysis
- 14.2.4.4. Recent Developments
- 14.2.4.5. Financials (Based on Availability)
- 14.2.5 NETZSCH Holding
- 14.2.5.1. Overview
- 14.2.5.2. Products
- 14.2.5.3. SWOT Analysis
- 14.2.5.4. Recent Developments
- 14.2.5.5. Financials (Based on Availability)
- 14.2.6 TSURUMI MANUFACTURING CO LTD
- 14.2.6.1. Overview
- 14.2.6.2. Products
- 14.2.6.3. SWOT Analysis
- 14.2.6.4. Recent Developments
- 14.2.6.5. Financials (Based on Availability)
- 14.2.7 Sulzer AG
- 14.2.7.1. Overview
- 14.2.7.2. Products
- 14.2.7.3. SWOT Analysis
- 14.2.7.4. Recent Developments
- 14.2.7.5. Financials (Based on Availability)
- 14.2.8 Pentair PLC
- 14.2.8.1. Overview
- 14.2.8.2. Products
- 14.2.8.3. SWOT Analysis
- 14.2.8.4. Recent Developments
- 14.2.8.5. Financials (Based on Availability)
- 14.2.9 Atlas Copco
- 14.2.9.1. Overview
- 14.2.9.2. Products
- 14.2.9.3. SWOT Analysis
- 14.2.9.4. Recent Developments
- 14.2.9.5. Financials (Based on Availability)
- 14.2.10 GRUNDFOS
- 14.2.10.1. Overview
- 14.2.10.2. Products
- 14.2.10.3. SWOT Analysis
- 14.2.10.4. Recent Developments
- 14.2.10.5. Financials (Based on Availability)
- 14.2.1 The Weir Group PLC
List of Figures
- Figure 1: Global APAC Positive Displacement Pumps Market Revenue Breakdown (Million, %) by Region 2024 & 2032
- Figure 2: Global APAC Positive Displacement Pumps Market Volume Breakdown (K Unit, %) by Region 2024 & 2032
- Figure 3: Brazil APAC Positive Displacement Pumps Market Revenue (Million), by Country 2024 & 2032
- Figure 4: Brazil APAC Positive Displacement Pumps Market Volume (K Unit), by Country 2024 & 2032
- Figure 5: Brazil APAC Positive Displacement Pumps Market Revenue Share (%), by Country 2024 & 2032
- Figure 6: Brazil APAC Positive Displacement Pumps Market Volume Share (%), by Country 2024 & 2032
- Figure 7: Colombia APAC Positive Displacement Pumps Market Revenue (Million), by Country 2024 & 2032
- Figure 8: Colombia APAC Positive Displacement Pumps Market Volume (K Unit), by Country 2024 & 2032
- Figure 9: Colombia APAC Positive Displacement Pumps Market Revenue Share (%), by Country 2024 & 2032
- Figure 10: Colombia APAC Positive Displacement Pumps Market Volume Share (%), by Country 2024 & 2032
- Figure 11: Mexico APAC Positive Displacement Pumps Market Revenue (Million), by Country 2024 & 2032
- Figure 12: Mexico APAC Positive Displacement Pumps Market Volume (K Unit), by Country 2024 & 2032
- Figure 13: Mexico APAC Positive Displacement Pumps Market Revenue Share (%), by Country 2024 & 2032
- Figure 14: Mexico APAC Positive Displacement Pumps Market Volume Share (%), by Country 2024 & 2032
- Figure 15: North America APAC Positive Displacement Pumps Market Revenue (Million), by Type 2024 & 2032
- Figure 16: North America APAC Positive Displacement Pumps Market Volume (K Unit), by Type 2024 & 2032
- Figure 17: North America APAC Positive Displacement Pumps Market Revenue Share (%), by Type 2024 & 2032
- Figure 18: North America APAC Positive Displacement Pumps Market Volume Share (%), by Type 2024 & 2032
- Figure 19: North America APAC Positive Displacement Pumps Market Revenue (Million), by End-user Industry 2024 & 2032
- Figure 20: North America APAC Positive Displacement Pumps Market Volume (K Unit), by End-user Industry 2024 & 2032
- Figure 21: North America APAC Positive Displacement Pumps Market Revenue Share (%), by End-user Industry 2024 & 2032
- Figure 22: North America APAC Positive Displacement Pumps Market Volume Share (%), by End-user Industry 2024 & 2032
- Figure 23: North America APAC Positive Displacement Pumps Market Revenue (Million), by Country 2024 & 2032
- Figure 24: North America APAC Positive Displacement Pumps Market Volume (K Unit), by Country 2024 & 2032
- Figure 25: North America APAC Positive Displacement Pumps Market Revenue Share (%), by Country 2024 & 2032
- Figure 26: North America APAC Positive Displacement Pumps Market Volume Share (%), by Country 2024 & 2032
- Figure 27: South America APAC Positive Displacement Pumps Market Revenue (Million), by Type 2024 & 2032
- Figure 28: South America APAC Positive Displacement Pumps Market Volume (K Unit), by Type 2024 & 2032
- Figure 29: South America APAC Positive Displacement Pumps Market Revenue Share (%), by Type 2024 & 2032
- Figure 30: South America APAC Positive Displacement Pumps Market Volume Share (%), by Type 2024 & 2032
- Figure 31: South America APAC Positive Displacement Pumps Market Revenue (Million), by End-user Industry 2024 & 2032
- Figure 32: South America APAC Positive Displacement Pumps Market Volume (K Unit), by End-user Industry 2024 & 2032
- Figure 33: South America APAC Positive Displacement Pumps Market Revenue Share (%), by End-user Industry 2024 & 2032
- Figure 34: South America APAC Positive Displacement Pumps Market Volume Share (%), by End-user Industry 2024 & 2032
- Figure 35: South America APAC Positive Displacement Pumps Market Revenue (Million), by Country 2024 & 2032
- Figure 36: South America APAC Positive Displacement Pumps Market Volume (K Unit), by Country 2024 & 2032
- Figure 37: South America APAC Positive Displacement Pumps Market Revenue Share (%), by Country 2024 & 2032
- Figure 38: South America APAC Positive Displacement Pumps Market Volume Share (%), by Country 2024 & 2032
- Figure 39: Europe APAC Positive Displacement Pumps Market Revenue (Million), by Type 2024 & 2032
- Figure 40: Europe APAC Positive Displacement Pumps Market Volume (K Unit), by Type 2024 & 2032
- Figure 41: Europe APAC Positive Displacement Pumps Market Revenue Share (%), by Type 2024 & 2032
- Figure 42: Europe APAC Positive Displacement Pumps Market Volume Share (%), by Type 2024 & 2032
- Figure 43: Europe APAC Positive Displacement Pumps Market Revenue (Million), by End-user Industry 2024 & 2032
- Figure 44: Europe APAC Positive Displacement Pumps Market Volume (K Unit), by End-user Industry 2024 & 2032
- Figure 45: Europe APAC Positive Displacement Pumps Market Revenue Share (%), by End-user Industry 2024 & 2032
- Figure 46: Europe APAC Positive Displacement Pumps Market Volume Share (%), by End-user Industry 2024 & 2032
- Figure 47: Europe APAC Positive Displacement Pumps Market Revenue (Million), by Country 2024 & 2032
- Figure 48: Europe APAC Positive Displacement Pumps Market Volume (K Unit), by Country 2024 & 2032
- Figure 49: Europe APAC Positive Displacement Pumps Market Revenue Share (%), by Country 2024 & 2032
- Figure 50: Europe APAC Positive Displacement Pumps Market Volume Share (%), by Country 2024 & 2032
- Figure 51: Middle East & Africa APAC Positive Displacement Pumps Market Revenue (Million), by Type 2024 & 2032
- Figure 52: Middle East & Africa APAC Positive Displacement Pumps Market Volume (K Unit), by Type 2024 & 2032
- Figure 53: Middle East & Africa APAC Positive Displacement Pumps Market Revenue Share (%), by Type 2024 & 2032
- Figure 54: Middle East & Africa APAC Positive Displacement Pumps Market Volume Share (%), by Type 2024 & 2032
- Figure 55: Middle East & Africa APAC Positive Displacement Pumps Market Revenue (Million), by End-user Industry 2024 & 2032
- Figure 56: Middle East & Africa APAC Positive Displacement Pumps Market Volume (K Unit), by End-user Industry 2024 & 2032
- Figure 57: Middle East & Africa APAC Positive Displacement Pumps Market Revenue Share (%), by End-user Industry 2024 & 2032
- Figure 58: Middle East & Africa APAC Positive Displacement Pumps Market Volume Share (%), by End-user Industry 2024 & 2032
- Figure 59: Middle East & Africa APAC Positive Displacement Pumps Market Revenue (Million), by Country 2024 & 2032
- Figure 60: Middle East & Africa APAC Positive Displacement Pumps Market Volume (K Unit), by Country 2024 & 2032
- Figure 61: Middle East & Africa APAC Positive Displacement Pumps Market Revenue Share (%), by Country 2024 & 2032
- Figure 62: Middle East & Africa APAC Positive Displacement Pumps Market Volume Share (%), by Country 2024 & 2032
- Figure 63: Asia Pacific APAC Positive Displacement Pumps Market Revenue (Million), by Type 2024 & 2032
- Figure 64: Asia Pacific APAC Positive Displacement Pumps Market Volume (K Unit), by Type 2024 & 2032
- Figure 65: Asia Pacific APAC Positive Displacement Pumps Market Revenue Share (%), by Type 2024 & 2032
- Figure 66: Asia Pacific APAC Positive Displacement Pumps Market Volume Share (%), by Type 2024 & 2032
- Figure 67: Asia Pacific APAC Positive Displacement Pumps Market Revenue (Million), by End-user Industry 2024 & 2032
- Figure 68: Asia Pacific APAC Positive Displacement Pumps Market Volume (K Unit), by End-user Industry 2024 & 2032
- Figure 69: Asia Pacific APAC Positive Displacement Pumps Market Revenue Share (%), by End-user Industry 2024 & 2032
- Figure 70: Asia Pacific APAC Positive Displacement Pumps Market Volume Share (%), by End-user Industry 2024 & 2032
- Figure 71: Asia Pacific APAC Positive Displacement Pumps Market Revenue (Million), by Country 2024 & 2032
- Figure 72: Asia Pacific APAC Positive Displacement Pumps Market Volume (K Unit), by Country 2024 & 2032
- Figure 73: Asia Pacific APAC Positive Displacement Pumps Market Revenue Share (%), by Country 2024 & 2032
- Figure 74: Asia Pacific APAC Positive Displacement Pumps Market Volume Share (%), by Country 2024 & 2032
List of Tables
- Table 1: Global APAC Positive Displacement Pumps Market Revenue Million Forecast, by Region 2019 & 2032
- Table 2: Global APAC Positive Displacement Pumps Market Volume K Unit Forecast, by Region 2019 & 2032
- Table 3: Global APAC Positive Displacement Pumps Market Revenue Million Forecast, by Type 2019 & 2032
- Table 4: Global APAC Positive Displacement Pumps Market Volume K Unit Forecast, by Type 2019 & 2032
- Table 5: Global APAC Positive Displacement Pumps Market Revenue Million Forecast, by End-user Industry 2019 & 2032
- Table 6: Global APAC Positive Displacement Pumps Market Volume K Unit Forecast, by End-user Industry 2019 & 2032
- Table 7: Global APAC Positive Displacement Pumps Market Revenue Million Forecast, by Region 2019 & 2032
- Table 8: Global APAC Positive Displacement Pumps Market Volume K Unit Forecast, by Region 2019 & 2032
- Table 9: Global APAC Positive Displacement Pumps Market Revenue Million Forecast, by Country 2019 & 2032
- Table 10: Global APAC Positive Displacement Pumps Market Volume K Unit Forecast, by Country 2019 & 2032
- Table 11: APAC Positive Displacement Pumps Market Revenue (Million) Forecast, by Application 2019 & 2032
- Table 12: APAC Positive Displacement Pumps Market Volume (K Unit) Forecast, by Application 2019 & 2032
- Table 13: Global APAC Positive Displacement Pumps Market Revenue Million Forecast, by Country 2019 & 2032
- Table 14: Global APAC Positive Displacement Pumps Market Volume K Unit Forecast, by Country 2019 & 2032
- Table 15: APAC Positive Displacement Pumps Market Revenue (Million) Forecast, by Application 2019 & 2032
- Table 16: APAC Positive Displacement Pumps Market Volume (K Unit) Forecast, by Application 2019 & 2032
- Table 17: Global APAC Positive Displacement Pumps Market Revenue Million Forecast, by Country 2019 & 2032
- Table 18: Global APAC Positive Displacement Pumps Market Volume K Unit Forecast, by Country 2019 & 2032
- Table 19: APAC Positive Displacement Pumps Market Revenue (Million) Forecast, by Application 2019 & 2032
- Table 20: APAC Positive Displacement Pumps Market Volume (K Unit) Forecast, by Application 2019 & 2032
- Table 21: Global APAC Positive Displacement Pumps Market Revenue Million Forecast, by Type 2019 & 2032
- Table 22: Global APAC Positive Displacement Pumps Market Volume K Unit Forecast, by Type 2019 & 2032
- Table 23: Global APAC Positive Displacement Pumps Market Revenue Million Forecast, by End-user Industry 2019 & 2032
- Table 24: Global APAC Positive Displacement Pumps Market Volume K Unit Forecast, by End-user Industry 2019 & 2032
- Table 25: Global APAC Positive Displacement Pumps Market Revenue Million Forecast, by Country 2019 & 2032
- Table 26: Global APAC Positive Displacement Pumps Market Volume K Unit Forecast, by Country 2019 & 2032
- Table 27: United States APAC Positive Displacement Pumps Market Revenue (Million) Forecast, by Application 2019 & 2032
- Table 28: United States APAC Positive Displacement Pumps Market Volume (K Unit) Forecast, by Application 2019 & 2032
- Table 29: Canada APAC Positive Displacement Pumps Market Revenue (Million) Forecast, by Application 2019 & 2032
- Table 30: Canada APAC Positive Displacement Pumps Market Volume (K Unit) Forecast, by Application 2019 & 2032
- Table 31: Mexico APAC Positive Displacement Pumps Market Revenue (Million) Forecast, by Application 2019 & 2032
- Table 32: Mexico APAC Positive Displacement Pumps Market Volume (K Unit) Forecast, by Application 2019 & 2032
- Table 33: Global APAC Positive Displacement Pumps Market Revenue Million Forecast, by Type 2019 & 2032
- Table 34: Global APAC Positive Displacement Pumps Market Volume K Unit Forecast, by Type 2019 & 2032
- Table 35: Global APAC Positive Displacement Pumps Market Revenue Million Forecast, by End-user Industry 2019 & 2032
- Table 36: Global APAC Positive Displacement Pumps Market Volume K Unit Forecast, by End-user Industry 2019 & 2032
- Table 37: Global APAC Positive Displacement Pumps Market Revenue Million Forecast, by Country 2019 & 2032
- Table 38: Global APAC Positive Displacement Pumps Market Volume K Unit Forecast, by Country 2019 & 2032
- Table 39: Brazil APAC Positive Displacement Pumps Market Revenue (Million) Forecast, by Application 2019 & 2032
- Table 40: Brazil APAC Positive Displacement Pumps Market Volume (K Unit) Forecast, by Application 2019 & 2032
- Table 41: Argentina APAC Positive Displacement Pumps Market Revenue (Million) Forecast, by Application 2019 & 2032
- Table 42: Argentina APAC Positive Displacement Pumps Market Volume (K Unit) Forecast, by Application 2019 & 2032
- Table 43: Rest of South America APAC Positive Displacement Pumps Market Revenue (Million) Forecast, by Application 2019 & 2032
- Table 44: Rest of South America APAC Positive Displacement Pumps Market Volume (K Unit) Forecast, by Application 2019 & 2032
- Table 45: Global APAC Positive Displacement Pumps Market Revenue Million Forecast, by Type 2019 & 2032
- Table 46: Global APAC Positive Displacement Pumps Market Volume K Unit Forecast, by Type 2019 & 2032
- Table 47: Global APAC Positive Displacement Pumps Market Revenue Million Forecast, by End-user Industry 2019 & 2032
- Table 48: Global APAC Positive Displacement Pumps Market Volume K Unit Forecast, by End-user Industry 2019 & 2032
- Table 49: Global APAC Positive Displacement Pumps Market Revenue Million Forecast, by Country 2019 & 2032
- Table 50: Global APAC Positive Displacement Pumps Market Volume K Unit Forecast, by Country 2019 & 2032
- Table 51: United Kingdom APAC Positive Displacement Pumps Market Revenue (Million) Forecast, by Application 2019 & 2032
- Table 52: United Kingdom APAC Positive Displacement Pumps Market Volume (K Unit) Forecast, by Application 2019 & 2032
- Table 53: Germany APAC Positive Displacement Pumps Market Revenue (Million) Forecast, by Application 2019 & 2032
- Table 54: Germany APAC Positive Displacement Pumps Market Volume (K Unit) Forecast, by Application 2019 & 2032
- Table 55: France APAC Positive Displacement Pumps Market Revenue (Million) Forecast, by Application 2019 & 2032
- Table 56: France APAC Positive Displacement Pumps Market Volume (K Unit) Forecast, by Application 2019 & 2032
- Table 57: Italy APAC Positive Displacement Pumps Market Revenue (Million) Forecast, by Application 2019 & 2032
- Table 58: Italy APAC Positive Displacement Pumps Market Volume (K Unit) Forecast, by Application 2019 & 2032
- Table 59: Spain APAC Positive Displacement Pumps Market Revenue (Million) Forecast, by Application 2019 & 2032
- Table 60: Spain APAC Positive Displacement Pumps Market Volume (K Unit) Forecast, by Application 2019 & 2032
- Table 61: Russia APAC Positive Displacement Pumps Market Revenue (Million) Forecast, by Application 2019 & 2032
- Table 62: Russia APAC Positive Displacement Pumps Market Volume (K Unit) Forecast, by Application 2019 & 2032
- Table 63: Benelux APAC Positive Displacement Pumps Market Revenue (Million) Forecast, by Application 2019 & 2032
- Table 64: Benelux APAC Positive Displacement Pumps Market Volume (K Unit) Forecast, by Application 2019 & 2032
- Table 65: Nordics APAC Positive Displacement Pumps Market Revenue (Million) Forecast, by Application 2019 & 2032
- Table 66: Nordics APAC Positive Displacement Pumps Market Volume (K Unit) Forecast, by Application 2019 & 2032
- Table 67: Rest of Europe APAC Positive Displacement Pumps Market Revenue (Million) Forecast, by Application 2019 & 2032
- Table 68: Rest of Europe APAC Positive Displacement Pumps Market Volume (K Unit) Forecast, by Application 2019 & 2032
- Table 69: Global APAC Positive Displacement Pumps Market Revenue Million Forecast, by Type 2019 & 2032
- Table 70: Global APAC Positive Displacement Pumps Market Volume K Unit Forecast, by Type 2019 & 2032
- Table 71: Global APAC Positive Displacement Pumps Market Revenue Million Forecast, by End-user Industry 2019 & 2032
- Table 72: Global APAC Positive Displacement Pumps Market Volume K Unit Forecast, by End-user Industry 2019 & 2032
- Table 73: Global APAC Positive Displacement Pumps Market Revenue Million Forecast, by Country 2019 & 2032
- Table 74: Global APAC Positive Displacement Pumps Market Volume K Unit Forecast, by Country 2019 & 2032
- Table 75: Turkey APAC Positive Displacement Pumps Market Revenue (Million) Forecast, by Application 2019 & 2032
- Table 76: Turkey APAC Positive Displacement Pumps Market Volume (K Unit) Forecast, by Application 2019 & 2032
- Table 77: Israel APAC Positive Displacement Pumps Market Revenue (Million) Forecast, by Application 2019 & 2032
- Table 78: Israel APAC Positive Displacement Pumps Market Volume (K Unit) Forecast, by Application 2019 & 2032
- Table 79: GCC APAC Positive Displacement Pumps Market Revenue (Million) Forecast, by Application 2019 & 2032
- Table 80: GCC APAC Positive Displacement Pumps Market Volume (K Unit) Forecast, by Application 2019 & 2032
- Table 81: North Africa APAC Positive Displacement Pumps Market Revenue (Million) Forecast, by Application 2019 & 2032
- Table 82: North Africa APAC Positive Displacement Pumps Market Volume (K Unit) Forecast, by Application 2019 & 2032
- Table 83: South Africa APAC Positive Displacement Pumps Market Revenue (Million) Forecast, by Application 2019 & 2032
- Table 84: South Africa APAC Positive Displacement Pumps Market Volume (K Unit) Forecast, by Application 2019 & 2032
- Table 85: Rest of Middle East & Africa APAC Positive Displacement Pumps Market Revenue (Million) Forecast, by Application 2019 & 2032
- Table 86: Rest of Middle East & Africa APAC Positive Displacement Pumps Market Volume (K Unit) Forecast, by Application 2019 & 2032
- Table 87: Global APAC Positive Displacement Pumps Market Revenue Million Forecast, by Type 2019 & 2032
- Table 88: Global APAC Positive Displacement Pumps Market Volume K Unit Forecast, by Type 2019 & 2032
- Table 89: Global APAC Positive Displacement Pumps Market Revenue Million Forecast, by End-user Industry 2019 & 2032
- Table 90: Global APAC Positive Displacement Pumps Market Volume K Unit Forecast, by End-user Industry 2019 & 2032
- Table 91: Global APAC Positive Displacement Pumps Market Revenue Million Forecast, by Country 2019 & 2032
- Table 92: Global APAC Positive Displacement Pumps Market Volume K Unit Forecast, by Country 2019 & 2032
- Table 93: China APAC Positive Displacement Pumps Market Revenue (Million) Forecast, by Application 2019 & 2032
- Table 94: China APAC Positive Displacement Pumps Market Volume (K Unit) Forecast, by Application 2019 & 2032
- Table 95: India APAC Positive Displacement Pumps Market Revenue (Million) Forecast, by Application 2019 & 2032
- Table 96: India APAC Positive Displacement Pumps Market Volume (K Unit) Forecast, by Application 2019 & 2032
- Table 97: Japan APAC Positive Displacement Pumps Market Revenue (Million) Forecast, by Application 2019 & 2032
- Table 98: Japan APAC Positive Displacement Pumps Market Volume (K Unit) Forecast, by Application 2019 & 2032
- Table 99: South Korea APAC Positive Displacement Pumps Market Revenue (Million) Forecast, by Application 2019 & 2032
- Table 100: South Korea APAC Positive Displacement Pumps Market Volume (K Unit) Forecast, by Application 2019 & 2032
- Table 101: ASEAN APAC Positive Displacement Pumps Market Revenue (Million) Forecast, by Application 2019 & 2032
- Table 102: ASEAN APAC Positive Displacement Pumps Market Volume (K Unit) Forecast, by Application 2019 & 2032
- Table 103: Oceania APAC Positive Displacement Pumps Market Revenue (Million) Forecast, by Application 2019 & 2032
- Table 104: Oceania APAC Positive Displacement Pumps Market Volume (K Unit) Forecast, by Application 2019 & 2032
- Table 105: Rest of Asia Pacific APAC Positive Displacement Pumps Market Revenue (Million) Forecast, by Application 2019 & 2032
- Table 106: Rest of Asia Pacific APAC Positive Displacement Pumps Market Volume (K Unit) Forecast, by Application 2019 & 2032
Frequently Asked Questions
1. What is the projected Compound Annual Growth Rate (CAGR) of the APAC Positive Displacement Pumps Market?
The projected CAGR is approximately 3.67%.
2. Which companies are prominent players in the APAC Positive Displacement Pumps Market?
Key companies in the market include The Weir Group PLC, Xylem Inc, KSB SE & Co KGaA, SPX Flow Inc, NETZSCH Holding, TSURUMI MANUFACTURING CO LTD , Sulzer AG, Pentair PLC, Atlas Copco, GRUNDFOS.
3. What are the main segments of the APAC Positive Displacement Pumps Market?
The market segments include Type, End-user Industry.
4. Can you provide details about the market size?
The market size is estimated to be USD XX Million as of 2022.
5. What are some drivers contributing to market growth?
Increased Focus on Wastewater Management.
6. What are the notable trends driving market growth?
Waste and Wastewater Industry is Expected to Register Significant Growth.
7. Are there any restraints impacting market growth?
Environmental and Safe Use Concerns.
8. Can you provide examples of recent developments in the market?
February 2022 - NETZSCH Pumps and Systems announced the expansion of its product portfolio with the launch of the PERIPRO peristaltic pump. The pump model is available in chemical, industrial, and food versions. Moreover, the newly launched product complements the company's well-known technologies of NEMO progressing cavity pumps, NOTOS multi screw pumps, and TORNADO rotary lobe pumps.
9. What pricing options are available for accessing the report?
Pricing options include single-user, multi-user, and enterprise licenses priced at USD 4750, USD 4950, and USD 6800 respectively.
10. Is the market size provided in terms of value or volume?
The market size is provided in terms of value, measured in Million and volume, measured in K Unit.
11. Are there any specific market keywords associated with the report?
Yes, the market keyword associated with the report is "APAC Positive Displacement Pumps Market," which aids in identifying and referencing the specific market segment covered.
12. How do I determine which pricing option suits my needs best?
The pricing options vary based on user requirements and access needs. Individual users may opt for single-user licenses, while businesses requiring broader access may choose multi-user or enterprise licenses for cost-effective access to the report.
13. Are there any additional resources or data provided in the APAC Positive Displacement Pumps Market report?
While the report offers comprehensive insights, it's advisable to review the specific contents or supplementary materials provided to ascertain if additional resources or data are available.
14. How can I stay updated on further developments or reports in the APAC Positive Displacement Pumps Market?
To stay informed about further developments, trends, and reports in the APAC Positive Displacement Pumps Market, consider subscribing to industry newsletters, following relevant companies and organizations, or regularly checking reputable industry news sources and publications.
Methodology
Step 1 - Identification of Relevant Samples Size from Population Database


Step 2 - Approaches for Defining Global Market Size (Value, Volume* & Price*)

Note*: In applicable scenarios
Step 3 - Data Sources
Primary Research
- Web Analytics
- Survey Reports
- Research Institute
- Latest Research Reports
- Opinion Leaders
Secondary Research
- Annual Reports
- White Paper
- Latest Press Release
- Industry Association
- Paid Database
- Investor Presentations

Step 4 - Data Triangulation
Involves using different sources of information in order to increase the validity of a study
These sources are likely to be stakeholders in a program - participants, other researchers, program staff, other community members, and so on.
Then we put all data in single framework & apply various statistical tools to find out the dynamic on the market.
During the analysis stage, feedback from the stakeholder groups would be compared to determine areas of agreement as well as areas of divergence
