

Key Insights
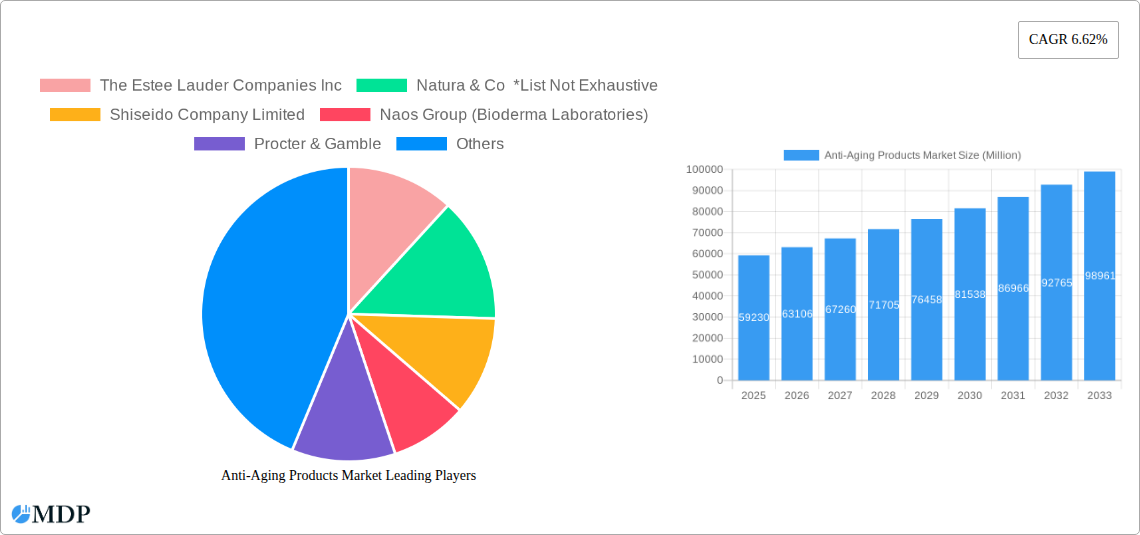
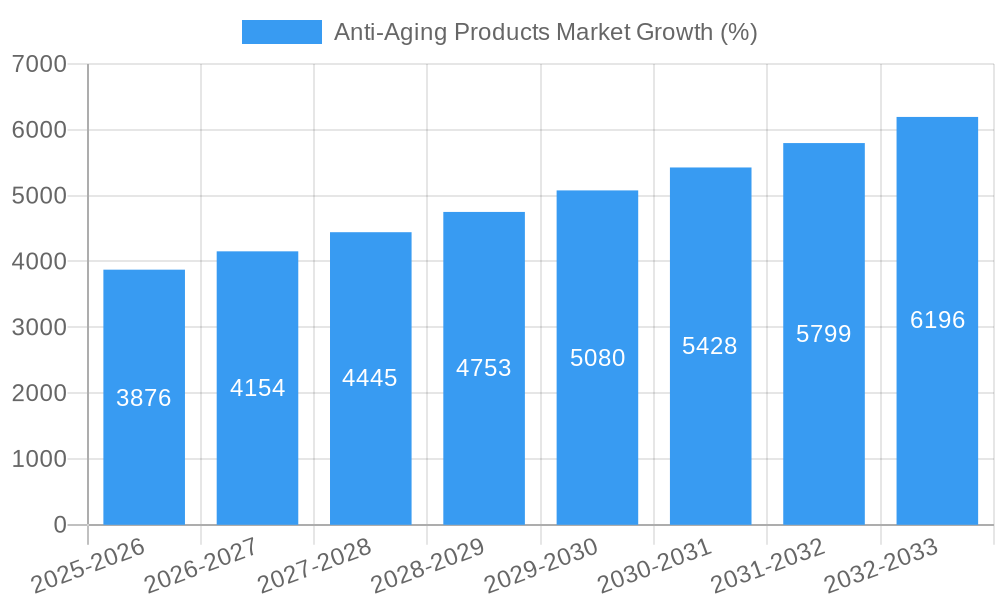
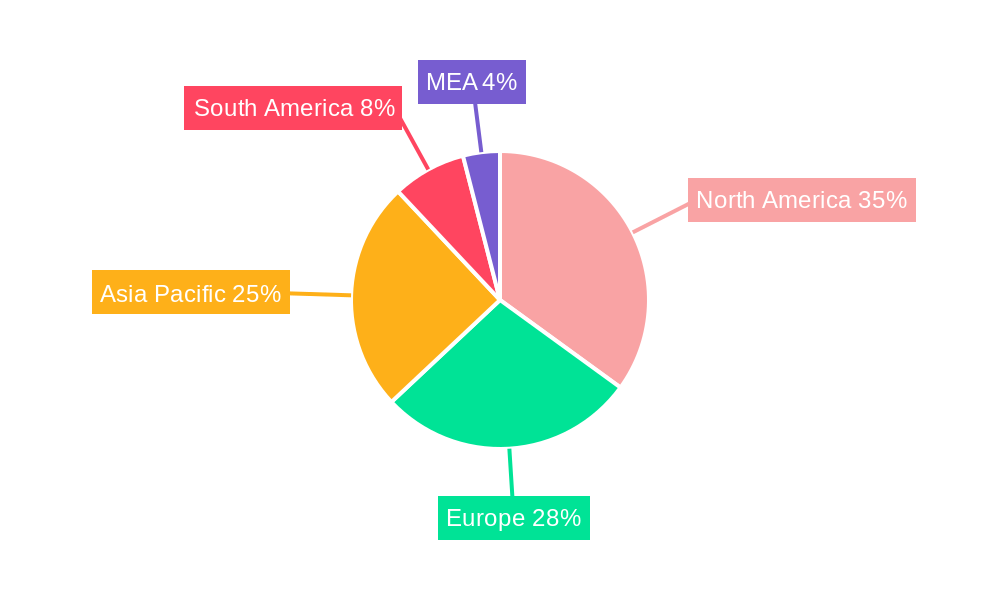
The global anti-aging products market, valued at $59.23 billion in 2025, is projected to experience robust growth, driven by a rising aging population globally and increased consumer awareness of skincare solutions to combat the visible signs of aging. A compound annual growth rate (CAGR) of 6.62% from 2025 to 2033 indicates significant market expansion. Key drivers include the increasing prevalence of lifestyle-related aging factors, the rising popularity of preventive skincare, and the ongoing innovation in product formulations incorporating advanced ingredients like peptides, retinol, and hyaluronic acid. The market is segmented by product type (facial creams and lotions holding the largest share, followed by serums and concentrates, under-eye creams, and others including facial oils and sheet masks) and distribution channel (with online retail stores experiencing rapid growth alongside traditional channels like supermarkets, specialty stores, and pharmacies). The competitive landscape is dominated by established players such as L'Oreal SA, Estée Lauder Companies Inc., and Shiseido Company Limited, alongside several other significant brands. Growth is expected to be geographically diverse, with North America and Asia Pacific representing substantial market shares, fueled by high consumer spending and rising disposable incomes in these regions.
The market's growth trajectory is anticipated to be influenced by several factors. The increasing demand for natural and organic anti-aging products presents a significant opportunity for brands focusing on sustainable and ethically sourced ingredients. Conversely, regulatory changes concerning the use of certain chemicals in cosmetic products could pose a challenge. Moreover, the market will likely see increased competition from both established and emerging players, prompting innovation and differentiation in product offerings. The continuous evolution of consumer preferences regarding efficacy, safety, and sustainability will necessitate adaptation by market participants to maintain their competitive edge. The ongoing trend towards personalized skincare, supported by advancements in biotechnology, will also shape the future of the anti-aging products market.
Anti-Aging Products Market Report: 2019-2033 Forecast
This comprehensive report provides a detailed analysis of the global Anti-Aging Products Market, offering invaluable insights for industry stakeholders, investors, and businesses seeking to navigate this dynamic sector. With a study period spanning 2019-2033, a base year of 2025, and a forecast period of 2025-2033, this report leverages extensive market research and data analysis to present a robust understanding of current market conditions and future growth trajectories. The market is valued at xx Million in 2025 and is projected to reach xx Million by 2033, exhibiting a CAGR of xx%.
Anti-Aging Products Market Market Dynamics & Concentration
The global anti-aging products market is characterized by a moderately concentrated landscape with several key players vying for market share. The Estee Lauder Companies Inc, Natura & Co, Shiseido Company Limited, Naos Group (Bioderma Laboratories), Procter & Gamble, Caudalie, L'Oréal SA, Groupe Clarins, Beiersdorf Limited, and Oriflame Cosmetics AG are among the prominent players, each contributing significantly to the overall market value. Market concentration is influenced by factors such as brand recognition, research and development capabilities, and effective distribution networks. Innovation plays a crucial role, driving the development of advanced formulations and technologies. Stringent regulatory frameworks governing product safety and efficacy influence market dynamics, while the presence of substitutes such as minimally invasive cosmetic procedures and natural remedies impacts market growth. Consumer trends, particularly the increasing focus on preventative skincare and personalized beauty regimens, are significantly shaping market demand. The market witnesses consistent M&A activity, with approximately xx M&A deals recorded over the historical period (2019-2024), further consolidating the market structure. Key players are actively involved in expanding their product portfolios, acquiring smaller companies, and forging strategic partnerships to maintain their competitive edge. Market share is distributed amongst the major players, with the top 5 companies holding an estimated xx% of the market.
Anti-Aging Products Market Industry Trends & Analysis
The anti-aging products market exhibits robust growth, driven by several key factors. The rising global population aged 50 and above presents a significant market opportunity. Increased disposable incomes and a heightened awareness of skin health, fueled by increased access to information and a stronger focus on self-care, are also boosting demand. Technological advancements in formulation and delivery systems, leading to more effective and targeted anti-aging solutions, are further accelerating market growth. Consumer preferences are shifting towards natural and organic ingredients, along with personalized skincare regimens tailored to individual skin types and concerns. This shift presents both challenges and opportunities for manufacturers. The market is witnessing a significant rise in online retail sales, impacting traditional distribution channels and creating new avenues for market penetration. The competitive landscape is intensely dynamic, with established players constantly introducing innovative products to maintain market leadership and newer entrants disrupting the space with niche offerings. The market penetration rate for anti-aging products is estimated at xx% in 2025, projected to increase to xx% by 2033.
Leading Markets & Segments in Anti-Aging Products Market
The North American region currently dominates the anti-aging products market, driven by high disposable incomes, robust consumer spending on beauty and personal care products, and the early adoption of innovative technologies. Within product types, facial creams and lotions remain the largest segment, benefiting from their widespread use and ease of application. However, serums and concentrates are witnessing the fastest growth rate due to their targeted action and perceived higher efficacy. The online retail channel is rapidly gaining traction, exhibiting strong growth momentum driven by increased internet penetration and convenience.
Key Drivers in North America: Strong consumer spending power, advanced skincare technology adoption, and a mature market infrastructure contribute to the region’s dominance.
Key Drivers in Asia-Pacific: A rapidly expanding middle class with growing disposable incomes and rising awareness of anti-aging products fuels substantial growth.
By Product Type:
- Facial Creams and Lotions: High market share due to widespread acceptance and ease of use.
- Serums and Concentrates: Fastest-growing segment due to higher perceived efficacy and targeted action.
- Under Eye Creams: Significant market segment addressing specific skin concerns.
- Others (Facial Oils, Sheet Masks): Niche segments with growing appeal.
By Distribution Channel:
- Online Retail Stores: Fastest-growing channel, capitalizing on convenience and accessibility.
- Pharmacies/Drug Stores: Significant channel leveraging consumer trust and professional advice.
- Specialty Stores: Strong presence appealing to consumers seeking premium products.
- Supermarkets/Hypermarkets: Mass-market channel with broader product availability.
Anti-Aging Products Market Product Developments
Recent product innovations emphasize advanced formulations incorporating peptides, retinoids, antioxidants, and other active ingredients to address specific skin aging concerns. Technological advancements in delivery systems, such as liposomes and micro-needling patches, enhance product efficacy and improve consumer experience. Companies are focusing on developing personalized products tailored to individual skin types and needs, leveraging genetic testing and AI-powered analysis to offer customized anti-aging solutions. This focus on personalization and effectiveness is creating a competitive advantage for companies and shaping the overall market landscape.
Key Drivers of Anti-Aging Products Market Growth
Several factors fuel the market's growth. Rising disposable incomes in developing economies, coupled with increased awareness of skincare and anti-aging solutions, significantly boost demand. Technological advancements in formulation and delivery systems continuously improve product efficacy, driving consumer adoption. Favorable regulatory frameworks facilitating product innovation and market entry accelerate growth. Furthermore, the expanding geriatric population globally provides a substantial market opportunity for anti-aging products. The growing popularity of natural and organic ingredients presents another driver of growth.
Challenges in the Anti-Aging Products Market Market
The market faces challenges. Stringent regulatory requirements for product safety and efficacy can increase development costs and slow down product launches. Fluctuating raw material prices and supply chain disruptions can impact production costs and profitability. Intense competition from both established players and new market entrants puts pressure on margins. Furthermore, consumer skepticism regarding efficacy claims for certain anti-aging products creates a hurdle to overcome. These factors, if not managed effectively, can hinder the growth of the market.
Emerging Opportunities in Anti-Aging Products Market
The growing demand for personalized skincare solutions creates significant opportunities. The development of innovative formulations incorporating advanced technologies like stem cell technology and targeted gene delivery systems presents a promising avenue for growth. Strategic partnerships between beauty brands and technology companies will fuel innovation. Expansion into untapped markets, particularly in developing countries with a growing middle class, presents significant potential for long-term growth. The continued rise of e-commerce expands market reach and presents new opportunities for direct-to-consumer brands.
Leading Players in the Anti-Aging Products Market Sector
- The Estee Lauder Companies Inc
- Natura & Co
- Shiseido Company Limited
- Naos Group (Bioderma Laboratories)
- Procter & Gamble
- Caudalie
- LOreal SA
- Groupe Clarins
- Beiersdorf Limited
- Oriflame Cosmetics AG
Key Milestones in Anti-Aging Products Market Industry
- March 2024: Dermalogica launched its Circular Hydration Serum, featuring hyaluronic acid and algae extracts for enhanced hydration.
- March 2024: L'Oréal Canada launched SkinBetter Science, a medical aesthetic skincare brand, expanding its dermatological beauty division.
- April 2024: Nivea expanded its anti-aging portfolio with the Q10 Dual Action serum, targeting sugar-induced skin aging.
Strategic Outlook for Anti-Aging Products Market Market
The anti-aging products market is poised for sustained growth, driven by ongoing innovation and evolving consumer preferences. Companies that invest in research and development to create effective and personalized solutions will gain a competitive advantage. Strategic partnerships and acquisitions will reshape the market landscape. Expansion into emerging markets and leveraging digital channels will be vital for future success. The market's long-term potential remains strong, supported by a growing global population and increasing consumer focus on preventative skincare.
Anti-Aging Products Market Segmentation
-
1. Product Type
- 1.1. Facial Creams and Lotions
- 1.2. Serums and Concentrates
- 1.3. Under Eye Creams
- 1.4. Others (Facial Oils, Sheet Masks)
-
2. Distribution Channel
- 2.1. Supermarkets/Hypermarkets
- 2.2. Specialty Stores
- 2.3. Pharmacies/Drug Stores
- 2.4. Online Retail Stores
- 2.5. Other Distribution Channels
Anti-Aging Products Market Segmentation By Geography
-
1. North America
- 1.1. United States
- 1.2. Canada
- 1.3. Mexico
- 1.4. Rest of North America
-
2. Europe
- 2.1. Spain
- 2.2. United Kingdom
- 2.3. Germany
- 2.4. France
- 2.5. Italy
- 2.6. Russia
- 2.7. Rest of Europe
-
3. Asia Pacific
- 3.1. China
- 3.2. Japan
- 3.3. India
- 3.4. Australia
- 3.5. Rest of Asia Pacific
-
4. South America
- 4.1. Brazil
- 4.2. Colombia
- 4.3. Rest of South America
-
5. Middle East and Africa
- 5.1. South Africa
- 5.2. Saudi Arabia
- 5.3. Rest of Middle East and Africa
Anti-Aging Products Market REPORT HIGHLIGHTS
| Aspects | Details |
|---|---|
| Study Period | 2019-2033 |
| Base Year | 2024 |
| Estimated Year | 2025 |
| Forecast Period | 2025-2033 |
| Historical Period | 2019-2024 |
| Growth Rate | CAGR of 6.62% from 2019-2033 |
| Segmentation |
|
Table of Contents
- 1. Introduction
- 1.1. Research Scope
- 1.2. Market Segmentation
- 1.3. Research Methodology
- 1.4. Definitions and Assumptions
- 2. Executive Summary
- 2.1. Introduction
- 3. Market Dynamics
- 3.1. Introduction
- 3.2. Market Drivers
- 3.2.1. Aggressive Marketing and Advertising By Brands; Desire Among Consumers For Youthful Skin
- 3.3. Market Restrains
- 3.3.1. Availability of Counterfeit Products
- 3.4. Market Trends
- 3.4.1. Aggressive Marketing and Advertising By Brands
- 4. Market Factor Analysis
- 4.1. Porters Five Forces
- 4.2. Supply/Value Chain
- 4.3. PESTEL analysis
- 4.4. Market Entropy
- 4.5. Patent/Trademark Analysis
- 5. Global Anti-Aging Products Market Analysis, Insights and Forecast, 2019-2031
- 5.1. Market Analysis, Insights and Forecast - by Product Type
- 5.1.1. Facial Creams and Lotions
- 5.1.2. Serums and Concentrates
- 5.1.3. Under Eye Creams
- 5.1.4. Others (Facial Oils, Sheet Masks)
- 5.2. Market Analysis, Insights and Forecast - by Distribution Channel
- 5.2.1. Supermarkets/Hypermarkets
- 5.2.2. Specialty Stores
- 5.2.3. Pharmacies/Drug Stores
- 5.2.4. Online Retail Stores
- 5.2.5. Other Distribution Channels
- 5.3. Market Analysis, Insights and Forecast - by Region
- 5.3.1. North America
- 5.3.2. Europe
- 5.3.3. Asia Pacific
- 5.3.4. South America
- 5.3.5. Middle East and Africa
- 5.1. Market Analysis, Insights and Forecast - by Product Type
- 6. North America Anti-Aging Products Market Analysis, Insights and Forecast, 2019-2031
- 6.1. Market Analysis, Insights and Forecast - by Product Type
- 6.1.1. Facial Creams and Lotions
- 6.1.2. Serums and Concentrates
- 6.1.3. Under Eye Creams
- 6.1.4. Others (Facial Oils, Sheet Masks)
- 6.2. Market Analysis, Insights and Forecast - by Distribution Channel
- 6.2.1. Supermarkets/Hypermarkets
- 6.2.2. Specialty Stores
- 6.2.3. Pharmacies/Drug Stores
- 6.2.4. Online Retail Stores
- 6.2.5. Other Distribution Channels
- 6.1. Market Analysis, Insights and Forecast - by Product Type
- 7. Europe Anti-Aging Products Market Analysis, Insights and Forecast, 2019-2031
- 7.1. Market Analysis, Insights and Forecast - by Product Type
- 7.1.1. Facial Creams and Lotions
- 7.1.2. Serums and Concentrates
- 7.1.3. Under Eye Creams
- 7.1.4. Others (Facial Oils, Sheet Masks)
- 7.2. Market Analysis, Insights and Forecast - by Distribution Channel
- 7.2.1. Supermarkets/Hypermarkets
- 7.2.2. Specialty Stores
- 7.2.3. Pharmacies/Drug Stores
- 7.2.4. Online Retail Stores
- 7.2.5. Other Distribution Channels
- 7.1. Market Analysis, Insights and Forecast - by Product Type
- 8. Asia Pacific Anti-Aging Products Market Analysis, Insights and Forecast, 2019-2031
- 8.1. Market Analysis, Insights and Forecast - by Product Type
- 8.1.1. Facial Creams and Lotions
- 8.1.2. Serums and Concentrates
- 8.1.3. Under Eye Creams
- 8.1.4. Others (Facial Oils, Sheet Masks)
- 8.2. Market Analysis, Insights and Forecast - by Distribution Channel
- 8.2.1. Supermarkets/Hypermarkets
- 8.2.2. Specialty Stores
- 8.2.3. Pharmacies/Drug Stores
- 8.2.4. Online Retail Stores
- 8.2.5. Other Distribution Channels
- 8.1. Market Analysis, Insights and Forecast - by Product Type
- 9. South America Anti-Aging Products Market Analysis, Insights and Forecast, 2019-2031
- 9.1. Market Analysis, Insights and Forecast - by Product Type
- 9.1.1. Facial Creams and Lotions
- 9.1.2. Serums and Concentrates
- 9.1.3. Under Eye Creams
- 9.1.4. Others (Facial Oils, Sheet Masks)
- 9.2. Market Analysis, Insights and Forecast - by Distribution Channel
- 9.2.1. Supermarkets/Hypermarkets
- 9.2.2. Specialty Stores
- 9.2.3. Pharmacies/Drug Stores
- 9.2.4. Online Retail Stores
- 9.2.5. Other Distribution Channels
- 9.1. Market Analysis, Insights and Forecast - by Product Type
- 10. Middle East and Africa Anti-Aging Products Market Analysis, Insights and Forecast, 2019-2031
- 10.1. Market Analysis, Insights and Forecast - by Product Type
- 10.1.1. Facial Creams and Lotions
- 10.1.2. Serums and Concentrates
- 10.1.3. Under Eye Creams
- 10.1.4. Others (Facial Oils, Sheet Masks)
- 10.2. Market Analysis, Insights and Forecast - by Distribution Channel
- 10.2.1. Supermarkets/Hypermarkets
- 10.2.2. Specialty Stores
- 10.2.3. Pharmacies/Drug Stores
- 10.2.4. Online Retail Stores
- 10.2.5. Other Distribution Channels
- 10.1. Market Analysis, Insights and Forecast - by Product Type
- 11. North America Anti-Aging Products Market Analysis, Insights and Forecast, 2019-2031
- 11.1. Market Analysis, Insights and Forecast - By Country/Sub-region
- 11.1.1 United States
- 11.1.2 Canada
- 11.1.3 Mexico
- 12. Europe Anti-Aging Products Market Analysis, Insights and Forecast, 2019-2031
- 12.1. Market Analysis, Insights and Forecast - By Country/Sub-region
- 12.1.1 Germany
- 12.1.2 United Kingdom
- 12.1.3 France
- 12.1.4 Spain
- 12.1.5 Italy
- 12.1.6 Spain
- 12.1.7 Belgium
- 12.1.8 Netherland
- 12.1.9 Nordics
- 12.1.10 Rest of Europe
- 13. Asia Pacific Anti-Aging Products Market Analysis, Insights and Forecast, 2019-2031
- 13.1. Market Analysis, Insights and Forecast - By Country/Sub-region
- 13.1.1 China
- 13.1.2 Japan
- 13.1.3 India
- 13.1.4 South Korea
- 13.1.5 Southeast Asia
- 13.1.6 Australia
- 13.1.7 Indonesia
- 13.1.8 Phillipes
- 13.1.9 Singapore
- 13.1.10 Thailandc
- 13.1.11 Rest of Asia Pacific
- 14. South America Anti-Aging Products Market Analysis, Insights and Forecast, 2019-2031
- 14.1. Market Analysis, Insights and Forecast - By Country/Sub-region
- 14.1.1 Brazil
- 14.1.2 Argentina
- 14.1.3 Peru
- 14.1.4 Chile
- 14.1.5 Colombia
- 14.1.6 Ecuador
- 14.1.7 Venezuela
- 14.1.8 Rest of South America
- 15. North America Anti-Aging Products Market Analysis, Insights and Forecast, 2019-2031
- 15.1. Market Analysis, Insights and Forecast - By Country/Sub-region
- 15.1.1 United States
- 15.1.2 Canada
- 15.1.3 Mexico
- 16. MEA Anti-Aging Products Market Analysis, Insights and Forecast, 2019-2031
- 16.1. Market Analysis, Insights and Forecast - By Country/Sub-region
- 16.1.1 United Arab Emirates
- 16.1.2 Saudi Arabia
- 16.1.3 South Africa
- 16.1.4 Rest of Middle East and Africa
- 17. Competitive Analysis
- 17.1. Global Market Share Analysis 2024
- 17.2. Company Profiles
- 17.2.1 The Estee Lauder Companies Inc
- 17.2.1.1. Overview
- 17.2.1.2. Products
- 17.2.1.3. SWOT Analysis
- 17.2.1.4. Recent Developments
- 17.2.1.5. Financials (Based on Availability)
- 17.2.2 Natura & Co *List Not Exhaustive
- 17.2.2.1. Overview
- 17.2.2.2. Products
- 17.2.2.3. SWOT Analysis
- 17.2.2.4. Recent Developments
- 17.2.2.5. Financials (Based on Availability)
- 17.2.3 Shiseido Company Limited
- 17.2.3.1. Overview
- 17.2.3.2. Products
- 17.2.3.3. SWOT Analysis
- 17.2.3.4. Recent Developments
- 17.2.3.5. Financials (Based on Availability)
- 17.2.4 Naos Group (Bioderma Laboratories)
- 17.2.4.1. Overview
- 17.2.4.2. Products
- 17.2.4.3. SWOT Analysis
- 17.2.4.4. Recent Developments
- 17.2.4.5. Financials (Based on Availability)
- 17.2.5 Procter & Gamble
- 17.2.5.1. Overview
- 17.2.5.2. Products
- 17.2.5.3. SWOT Analysis
- 17.2.5.4. Recent Developments
- 17.2.5.5. Financials (Based on Availability)
- 17.2.6 Caudalie
- 17.2.6.1. Overview
- 17.2.6.2. Products
- 17.2.6.3. SWOT Analysis
- 17.2.6.4. Recent Developments
- 17.2.6.5. Financials (Based on Availability)
- 17.2.7 LOreal SA
- 17.2.7.1. Overview
- 17.2.7.2. Products
- 17.2.7.3. SWOT Analysis
- 17.2.7.4. Recent Developments
- 17.2.7.5. Financials (Based on Availability)
- 17.2.8 Groupe Clarins
- 17.2.8.1. Overview
- 17.2.8.2. Products
- 17.2.8.3. SWOT Analysis
- 17.2.8.4. Recent Developments
- 17.2.8.5. Financials (Based on Availability)
- 17.2.9 Beiersdorf Limited
- 17.2.9.1. Overview
- 17.2.9.2. Products
- 17.2.9.3. SWOT Analysis
- 17.2.9.4. Recent Developments
- 17.2.9.5. Financials (Based on Availability)
- 17.2.10 Oriflame Cosmetics AG
- 17.2.10.1. Overview
- 17.2.10.2. Products
- 17.2.10.3. SWOT Analysis
- 17.2.10.4. Recent Developments
- 17.2.10.5. Financials (Based on Availability)
- 17.2.1 The Estee Lauder Companies Inc
List of Figures
- Figure 1: Global Anti-Aging Products Market Revenue Breakdown (Million, %) by Region 2024 & 2032
- Figure 2: North America Anti-Aging Products Market Revenue (Million), by Country 2024 & 2032
- Figure 3: North America Anti-Aging Products Market Revenue Share (%), by Country 2024 & 2032
- Figure 4: Europe Anti-Aging Products Market Revenue (Million), by Country 2024 & 2032
- Figure 5: Europe Anti-Aging Products Market Revenue Share (%), by Country 2024 & 2032
- Figure 6: Asia Pacific Anti-Aging Products Market Revenue (Million), by Country 2024 & 2032
- Figure 7: Asia Pacific Anti-Aging Products Market Revenue Share (%), by Country 2024 & 2032
- Figure 8: South America Anti-Aging Products Market Revenue (Million), by Country 2024 & 2032
- Figure 9: South America Anti-Aging Products Market Revenue Share (%), by Country 2024 & 2032
- Figure 10: North America Anti-Aging Products Market Revenue (Million), by Country 2024 & 2032
- Figure 11: North America Anti-Aging Products Market Revenue Share (%), by Country 2024 & 2032
- Figure 12: MEA Anti-Aging Products Market Revenue (Million), by Country 2024 & 2032
- Figure 13: MEA Anti-Aging Products Market Revenue Share (%), by Country 2024 & 2032
- Figure 14: North America Anti-Aging Products Market Revenue (Million), by Product Type 2024 & 2032
- Figure 15: North America Anti-Aging Products Market Revenue Share (%), by Product Type 2024 & 2032
- Figure 16: North America Anti-Aging Products Market Revenue (Million), by Distribution Channel 2024 & 2032
- Figure 17: North America Anti-Aging Products Market Revenue Share (%), by Distribution Channel 2024 & 2032
- Figure 18: North America Anti-Aging Products Market Revenue (Million), by Country 2024 & 2032
- Figure 19: North America Anti-Aging Products Market Revenue Share (%), by Country 2024 & 2032
- Figure 20: Europe Anti-Aging Products Market Revenue (Million), by Product Type 2024 & 2032
- Figure 21: Europe Anti-Aging Products Market Revenue Share (%), by Product Type 2024 & 2032
- Figure 22: Europe Anti-Aging Products Market Revenue (Million), by Distribution Channel 2024 & 2032
- Figure 23: Europe Anti-Aging Products Market Revenue Share (%), by Distribution Channel 2024 & 2032
- Figure 24: Europe Anti-Aging Products Market Revenue (Million), by Country 2024 & 2032
- Figure 25: Europe Anti-Aging Products Market Revenue Share (%), by Country 2024 & 2032
- Figure 26: Asia Pacific Anti-Aging Products Market Revenue (Million), by Product Type 2024 & 2032
- Figure 27: Asia Pacific Anti-Aging Products Market Revenue Share (%), by Product Type 2024 & 2032
- Figure 28: Asia Pacific Anti-Aging Products Market Revenue (Million), by Distribution Channel 2024 & 2032
- Figure 29: Asia Pacific Anti-Aging Products Market Revenue Share (%), by Distribution Channel 2024 & 2032
- Figure 30: Asia Pacific Anti-Aging Products Market Revenue (Million), by Country 2024 & 2032
- Figure 31: Asia Pacific Anti-Aging Products Market Revenue Share (%), by Country 2024 & 2032
- Figure 32: South America Anti-Aging Products Market Revenue (Million), by Product Type 2024 & 2032
- Figure 33: South America Anti-Aging Products Market Revenue Share (%), by Product Type 2024 & 2032
- Figure 34: South America Anti-Aging Products Market Revenue (Million), by Distribution Channel 2024 & 2032
- Figure 35: South America Anti-Aging Products Market Revenue Share (%), by Distribution Channel 2024 & 2032
- Figure 36: South America Anti-Aging Products Market Revenue (Million), by Country 2024 & 2032
- Figure 37: South America Anti-Aging Products Market Revenue Share (%), by Country 2024 & 2032
- Figure 38: Middle East and Africa Anti-Aging Products Market Revenue (Million), by Product Type 2024 & 2032
- Figure 39: Middle East and Africa Anti-Aging Products Market Revenue Share (%), by Product Type 2024 & 2032
- Figure 40: Middle East and Africa Anti-Aging Products Market Revenue (Million), by Distribution Channel 2024 & 2032
- Figure 41: Middle East and Africa Anti-Aging Products Market Revenue Share (%), by Distribution Channel 2024 & 2032
- Figure 42: Middle East and Africa Anti-Aging Products Market Revenue (Million), by Country 2024 & 2032
- Figure 43: Middle East and Africa Anti-Aging Products Market Revenue Share (%), by Country 2024 & 2032
List of Tables
- Table 1: Global Anti-Aging Products Market Revenue Million Forecast, by Region 2019 & 2032
- Table 2: Global Anti-Aging Products Market Revenue Million Forecast, by Product Type 2019 & 2032
- Table 3: Global Anti-Aging Products Market Revenue Million Forecast, by Distribution Channel 2019 & 2032
- Table 4: Global Anti-Aging Products Market Revenue Million Forecast, by Region 2019 & 2032
- Table 5: Global Anti-Aging Products Market Revenue Million Forecast, by Country 2019 & 2032
- Table 6: United States Anti-Aging Products Market Revenue (Million) Forecast, by Application 2019 & 2032
- Table 7: Canada Anti-Aging Products Market Revenue (Million) Forecast, by Application 2019 & 2032
- Table 8: Mexico Anti-Aging Products Market Revenue (Million) Forecast, by Application 2019 & 2032
- Table 9: Global Anti-Aging Products Market Revenue Million Forecast, by Country 2019 & 2032
- Table 10: Germany Anti-Aging Products Market Revenue (Million) Forecast, by Application 2019 & 2032
- Table 11: United Kingdom Anti-Aging Products Market Revenue (Million) Forecast, by Application 2019 & 2032
- Table 12: France Anti-Aging Products Market Revenue (Million) Forecast, by Application 2019 & 2032
- Table 13: Spain Anti-Aging Products Market Revenue (Million) Forecast, by Application 2019 & 2032
- Table 14: Italy Anti-Aging Products Market Revenue (Million) Forecast, by Application 2019 & 2032
- Table 15: Spain Anti-Aging Products Market Revenue (Million) Forecast, by Application 2019 & 2032
- Table 16: Belgium Anti-Aging Products Market Revenue (Million) Forecast, by Application 2019 & 2032
- Table 17: Netherland Anti-Aging Products Market Revenue (Million) Forecast, by Application 2019 & 2032
- Table 18: Nordics Anti-Aging Products Market Revenue (Million) Forecast, by Application 2019 & 2032
- Table 19: Rest of Europe Anti-Aging Products Market Revenue (Million) Forecast, by Application 2019 & 2032
- Table 20: Global Anti-Aging Products Market Revenue Million Forecast, by Country 2019 & 2032
- Table 21: China Anti-Aging Products Market Revenue (Million) Forecast, by Application 2019 & 2032
- Table 22: Japan Anti-Aging Products Market Revenue (Million) Forecast, by Application 2019 & 2032
- Table 23: India Anti-Aging Products Market Revenue (Million) Forecast, by Application 2019 & 2032
- Table 24: South Korea Anti-Aging Products Market Revenue (Million) Forecast, by Application 2019 & 2032
- Table 25: Southeast Asia Anti-Aging Products Market Revenue (Million) Forecast, by Application 2019 & 2032
- Table 26: Australia Anti-Aging Products Market Revenue (Million) Forecast, by Application 2019 & 2032
- Table 27: Indonesia Anti-Aging Products Market Revenue (Million) Forecast, by Application 2019 & 2032
- Table 28: Phillipes Anti-Aging Products Market Revenue (Million) Forecast, by Application 2019 & 2032
- Table 29: Singapore Anti-Aging Products Market Revenue (Million) Forecast, by Application 2019 & 2032
- Table 30: Thailandc Anti-Aging Products Market Revenue (Million) Forecast, by Application 2019 & 2032
- Table 31: Rest of Asia Pacific Anti-Aging Products Market Revenue (Million) Forecast, by Application 2019 & 2032
- Table 32: Global Anti-Aging Products Market Revenue Million Forecast, by Country 2019 & 2032
- Table 33: Brazil Anti-Aging Products Market Revenue (Million) Forecast, by Application 2019 & 2032
- Table 34: Argentina Anti-Aging Products Market Revenue (Million) Forecast, by Application 2019 & 2032
- Table 35: Peru Anti-Aging Products Market Revenue (Million) Forecast, by Application 2019 & 2032
- Table 36: Chile Anti-Aging Products Market Revenue (Million) Forecast, by Application 2019 & 2032
- Table 37: Colombia Anti-Aging Products Market Revenue (Million) Forecast, by Application 2019 & 2032
- Table 38: Ecuador Anti-Aging Products Market Revenue (Million) Forecast, by Application 2019 & 2032
- Table 39: Venezuela Anti-Aging Products Market Revenue (Million) Forecast, by Application 2019 & 2032
- Table 40: Rest of South America Anti-Aging Products Market Revenue (Million) Forecast, by Application 2019 & 2032
- Table 41: Global Anti-Aging Products Market Revenue Million Forecast, by Country 2019 & 2032
- Table 42: United States Anti-Aging Products Market Revenue (Million) Forecast, by Application 2019 & 2032
- Table 43: Canada Anti-Aging Products Market Revenue (Million) Forecast, by Application 2019 & 2032
- Table 44: Mexico Anti-Aging Products Market Revenue (Million) Forecast, by Application 2019 & 2032
- Table 45: Global Anti-Aging Products Market Revenue Million Forecast, by Country 2019 & 2032
- Table 46: United Arab Emirates Anti-Aging Products Market Revenue (Million) Forecast, by Application 2019 & 2032
- Table 47: Saudi Arabia Anti-Aging Products Market Revenue (Million) Forecast, by Application 2019 & 2032
- Table 48: South Africa Anti-Aging Products Market Revenue (Million) Forecast, by Application 2019 & 2032
- Table 49: Rest of Middle East and Africa Anti-Aging Products Market Revenue (Million) Forecast, by Application 2019 & 2032
- Table 50: Global Anti-Aging Products Market Revenue Million Forecast, by Product Type 2019 & 2032
- Table 51: Global Anti-Aging Products Market Revenue Million Forecast, by Distribution Channel 2019 & 2032
- Table 52: Global Anti-Aging Products Market Revenue Million Forecast, by Country 2019 & 2032
- Table 53: United States Anti-Aging Products Market Revenue (Million) Forecast, by Application 2019 & 2032
- Table 54: Canada Anti-Aging Products Market Revenue (Million) Forecast, by Application 2019 & 2032
- Table 55: Mexico Anti-Aging Products Market Revenue (Million) Forecast, by Application 2019 & 2032
- Table 56: Rest of North America Anti-Aging Products Market Revenue (Million) Forecast, by Application 2019 & 2032
- Table 57: Global Anti-Aging Products Market Revenue Million Forecast, by Product Type 2019 & 2032
- Table 58: Global Anti-Aging Products Market Revenue Million Forecast, by Distribution Channel 2019 & 2032
- Table 59: Global Anti-Aging Products Market Revenue Million Forecast, by Country 2019 & 2032
- Table 60: Spain Anti-Aging Products Market Revenue (Million) Forecast, by Application 2019 & 2032
- Table 61: United Kingdom Anti-Aging Products Market Revenue (Million) Forecast, by Application 2019 & 2032
- Table 62: Germany Anti-Aging Products Market Revenue (Million) Forecast, by Application 2019 & 2032
- Table 63: France Anti-Aging Products Market Revenue (Million) Forecast, by Application 2019 & 2032
- Table 64: Italy Anti-Aging Products Market Revenue (Million) Forecast, by Application 2019 & 2032
- Table 65: Russia Anti-Aging Products Market Revenue (Million) Forecast, by Application 2019 & 2032
- Table 66: Rest of Europe Anti-Aging Products Market Revenue (Million) Forecast, by Application 2019 & 2032
- Table 67: Global Anti-Aging Products Market Revenue Million Forecast, by Product Type 2019 & 2032
- Table 68: Global Anti-Aging Products Market Revenue Million Forecast, by Distribution Channel 2019 & 2032
- Table 69: Global Anti-Aging Products Market Revenue Million Forecast, by Country 2019 & 2032
- Table 70: China Anti-Aging Products Market Revenue (Million) Forecast, by Application 2019 & 2032
- Table 71: Japan Anti-Aging Products Market Revenue (Million) Forecast, by Application 2019 & 2032
- Table 72: India Anti-Aging Products Market Revenue (Million) Forecast, by Application 2019 & 2032
- Table 73: Australia Anti-Aging Products Market Revenue (Million) Forecast, by Application 2019 & 2032
- Table 74: Rest of Asia Pacific Anti-Aging Products Market Revenue (Million) Forecast, by Application 2019 & 2032
- Table 75: Global Anti-Aging Products Market Revenue Million Forecast, by Product Type 2019 & 2032
- Table 76: Global Anti-Aging Products Market Revenue Million Forecast, by Distribution Channel 2019 & 2032
- Table 77: Global Anti-Aging Products Market Revenue Million Forecast, by Country 2019 & 2032
- Table 78: Brazil Anti-Aging Products Market Revenue (Million) Forecast, by Application 2019 & 2032
- Table 79: Colombia Anti-Aging Products Market Revenue (Million) Forecast, by Application 2019 & 2032
- Table 80: Rest of South America Anti-Aging Products Market Revenue (Million) Forecast, by Application 2019 & 2032
- Table 81: Global Anti-Aging Products Market Revenue Million Forecast, by Product Type 2019 & 2032
- Table 82: Global Anti-Aging Products Market Revenue Million Forecast, by Distribution Channel 2019 & 2032
- Table 83: Global Anti-Aging Products Market Revenue Million Forecast, by Country 2019 & 2032
- Table 84: South Africa Anti-Aging Products Market Revenue (Million) Forecast, by Application 2019 & 2032
- Table 85: Saudi Arabia Anti-Aging Products Market Revenue (Million) Forecast, by Application 2019 & 2032
- Table 86: Rest of Middle East and Africa Anti-Aging Products Market Revenue (Million) Forecast, by Application 2019 & 2032
Frequently Asked Questions
1. What is the projected Compound Annual Growth Rate (CAGR) of the Anti-Aging Products Market?
The projected CAGR is approximately 6.62%.
2. Which companies are prominent players in the Anti-Aging Products Market?
Key companies in the market include The Estee Lauder Companies Inc, Natura & Co *List Not Exhaustive, Shiseido Company Limited, Naos Group (Bioderma Laboratories), Procter & Gamble, Caudalie, LOreal SA, Groupe Clarins, Beiersdorf Limited, Oriflame Cosmetics AG.
3. What are the main segments of the Anti-Aging Products Market?
The market segments include Product Type, Distribution Channel.
4. Can you provide details about the market size?
The market size is estimated to be USD 59.23 Million as of 2022.
5. What are some drivers contributing to market growth?
Aggressive Marketing and Advertising By Brands; Desire Among Consumers For Youthful Skin.
6. What are the notable trends driving market growth?
Aggressive Marketing and Advertising By Brands.
7. Are there any restraints impacting market growth?
Availability of Counterfeit Products.
8. Can you provide examples of recent developments in the market?
April 2024: Nivea expanded its anti-aging product portfolio by launching the Q10 Dual Action serum. The company claims that the serum targets sugar-induced skin aging and wrinkle formation. The formula was designed to prevent protein glycation in the dermis skin layer, protecting collagen and elastin from damage.
9. What pricing options are available for accessing the report?
Pricing options include single-user, multi-user, and enterprise licenses priced at USD 4750, USD 5250, and USD 8750 respectively.
10. Is the market size provided in terms of value or volume?
The market size is provided in terms of value, measured in Million.
11. Are there any specific market keywords associated with the report?
Yes, the market keyword associated with the report is "Anti-Aging Products Market," which aids in identifying and referencing the specific market segment covered.
12. How do I determine which pricing option suits my needs best?
The pricing options vary based on user requirements and access needs. Individual users may opt for single-user licenses, while businesses requiring broader access may choose multi-user or enterprise licenses for cost-effective access to the report.
13. Are there any additional resources or data provided in the Anti-Aging Products Market report?
While the report offers comprehensive insights, it's advisable to review the specific contents or supplementary materials provided to ascertain if additional resources or data are available.
14. How can I stay updated on further developments or reports in the Anti-Aging Products Market?
To stay informed about further developments, trends, and reports in the Anti-Aging Products Market, consider subscribing to industry newsletters, following relevant companies and organizations, or regularly checking reputable industry news sources and publications.
Methodology
Step 1 - Identification of Relevant Samples Size from Population Database


Step 2 - Approaches for Defining Global Market Size (Value, Volume* & Price*)

Note*: In applicable scenarios
Step 3 - Data Sources
Primary Research
- Web Analytics
- Survey Reports
- Research Institute
- Latest Research Reports
- Opinion Leaders
Secondary Research
- Annual Reports
- White Paper
- Latest Press Release
- Industry Association
- Paid Database
- Investor Presentations

Step 4 - Data Triangulation
Involves using different sources of information in order to increase the validity of a study
These sources are likely to be stakeholders in a program - participants, other researchers, program staff, other community members, and so on.
Then we put all data in single framework & apply various statistical tools to find out the dynamic on the market.
During the analysis stage, feedback from the stakeholder groups would be compared to determine areas of agreement as well as areas of divergence
