

Key Insights
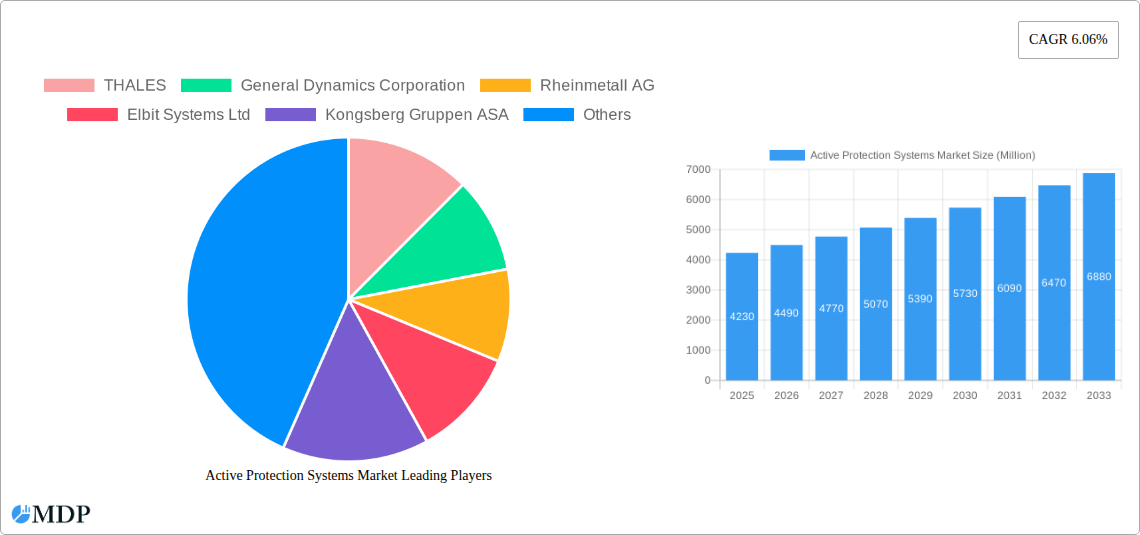
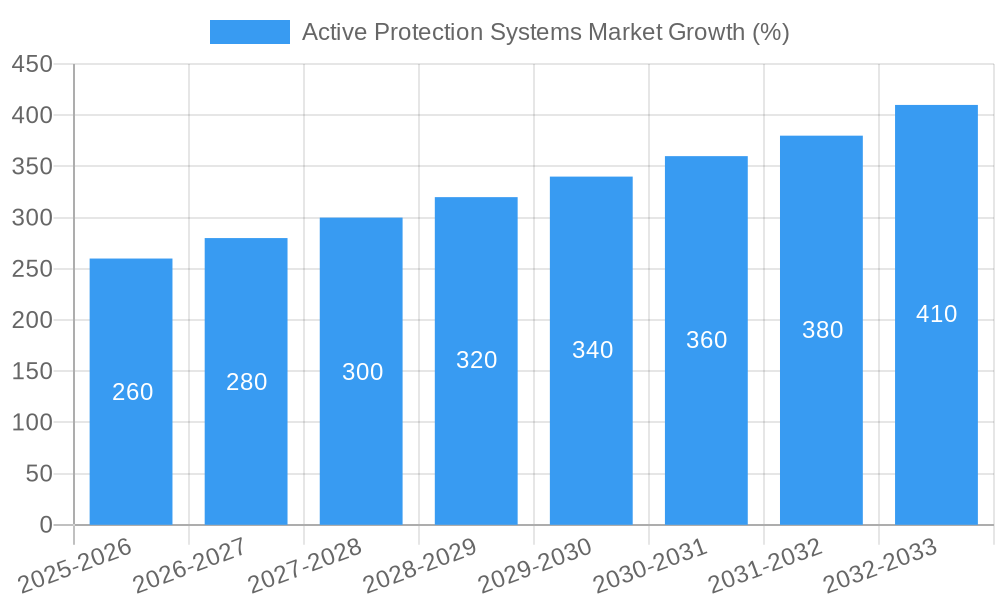
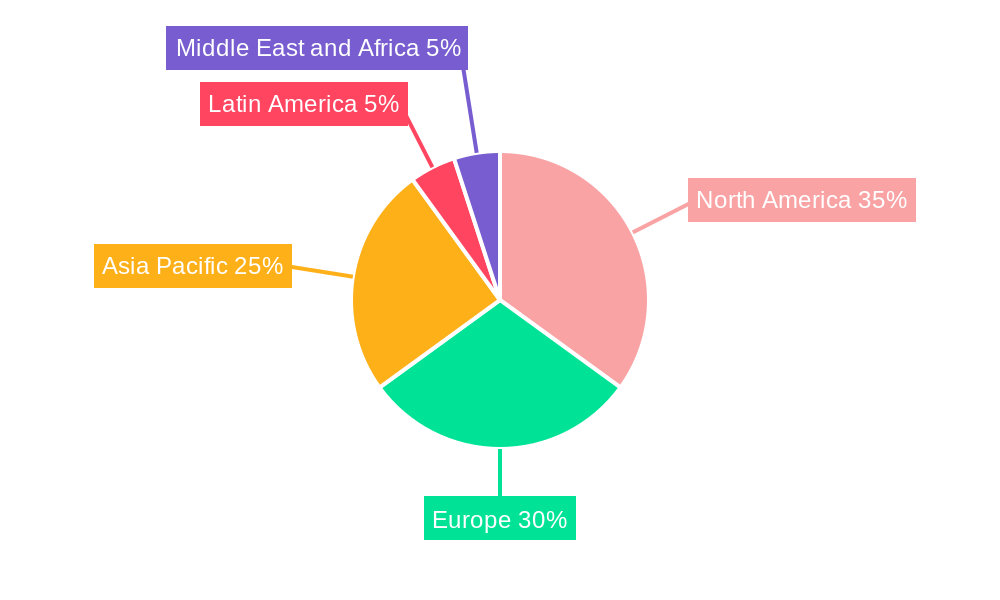
The Active Protection Systems (APS) market, valued at $4.23 billion in 2025, is projected to experience robust growth, driven by escalating geopolitical tensions and increasing investments in military modernization across the globe. A Compound Annual Growth Rate (CAGR) of 6.06% from 2025 to 2033 indicates a significant market expansion, reaching an estimated value exceeding $7 billion by 2033. This growth is fueled by several key factors. The rising demand for enhanced survivability of armored vehicles in modern warfare is a primary driver, pushing governments and militaries to adopt APS technologies. Furthermore, technological advancements leading to more effective, lighter, and cost-efficient systems are accelerating market penetration. The increasing integration of APS with other advanced technologies, such as artificial intelligence and improved sensor capabilities, is another significant factor contributing to market expansion. Market segmentation reveals strong performance in both hard-kill and soft-kill systems, with terrestrial platforms currently dominating the market share. However, the naval segment is expected to witness significant growth in the coming years, driven by the need to protect naval vessels against increasingly sophisticated threats. Competition among established players like Thales, General Dynamics, and Rheinmetall, alongside emerging companies, is fostering innovation and driving prices down, making APS technology more accessible to a wider range of customers. Regional analysis shows North America and Europe currently holding significant market share, but the Asia-Pacific region is poised for rapid growth driven by increased military spending and modernization efforts in countries like China and India.
Geographic diversification and the continuous development of more sophisticated and integrated APS solutions will continue to shape the market landscape. The market faces restraints such as the high initial cost of deployment and the complexity of integrating these systems into existing platforms. However, the continuous improvement in technology and the increasing awareness of the benefits of APS are likely to mitigate these challenges. The market’s future trajectory is optimistic, driven by ongoing technological advancements and heightened global security concerns. The ongoing conflicts and the need for enhanced protection of military personnel and equipment will fuel further growth in the foreseeable future. This underscores the importance of technological innovation and strategic partnerships for companies operating in this dynamic sector.
Active Protection Systems Market: A Comprehensive Report (2019-2033)
This in-depth report provides a comprehensive analysis of the Active Protection Systems market, offering invaluable insights for industry stakeholders, investors, and strategic decision-makers. The study covers the period from 2019 to 2033, with a focus on the forecast period (2025-2033), based on the estimated year 2025. The report leverages extensive market research, incorporating key performance indicators (KPIs) and detailed analysis of market dynamics, trends, leading players, and future opportunities. The market size in 2025 is estimated at xx Million, projecting a significant growth trajectory over the forecast period.
Active Protection Systems Market Market Dynamics & Concentration
The Active Protection Systems market exhibits a moderately concentrated landscape, with key players like THALES, General Dynamics Corporation, and Rheinmetall AG holding significant market share. The combined market share of the top five players is estimated at 45% in 2025. Market concentration is influenced by factors such as high R&D investment, stringent regulatory approvals, and the need for specialized expertise in developing and deploying these complex systems.
Innovation is a critical driver, with ongoing research in areas like AI-powered threat detection and advanced countermeasure technologies shaping market evolution. Stringent regulatory frameworks concerning defense equipment and export controls significantly influence market access and deployment. The market also faces competitive pressure from product substitutes, primarily passive protection systems, but Active Protection Systems' superior performance in mitigating threats sustains their demand. End-user trends, such as increased military modernization spending and adoption of advanced technologies, are fueling market growth. M&A activity in the sector has been moderate, with approximately 5-7 significant deals recorded between 2019 and 2024, primarily focused on strategic acquisitions to expand product portfolios and geographic reach.
- Market Concentration: Top 5 players hold ~45% market share (2025).
- Innovation Drivers: AI-powered threat detection, advanced countermeasures.
- Regulatory Framework: Stringent defense equipment and export controls.
- Product Substitutes: Passive protection systems.
- End-User Trends: Increased military modernization spending.
- M&A Activity: 5-7 major deals (2019-2024).
Active Protection Systems Market Industry Trends & Analysis
The Active Protection Systems market is projected to experience a CAGR of xx% during the forecast period (2025-2033), driven by several key factors. The increasing demand for enhanced protection of military vehicles and platforms in conflict zones and asymmetric warfare scenarios is a primary growth catalyst. Technological advancements, particularly in sensor technology, AI algorithms for threat identification and response, and the development of more effective countermeasures, are significantly improving system capabilities and broadening their applications. Consumer preferences are shifting towards systems offering higher protection levels, improved reliability, and reduced weight and size. Competitive dynamics are intense, with established players and emerging companies vying for market share through product innovation, strategic partnerships, and technological advancements. Market penetration is relatively high in developed regions, but significant untapped potential exists in emerging markets with increasing defense budgets.
Leading Markets & Segments in Active Protection Systems Market
The Terrestrial segment currently dominates the Active Protection Systems market, accounting for approximately 60% of the total revenue in 2025. This dominance is primarily driven by the large-scale deployment of Active Protection Systems on land-based military vehicles, such as tanks and armored personnel carriers. The North American region holds a leading position, owing to significant military spending and adoption of advanced technologies. Europe follows closely, driven by its robust defense industry and ongoing modernization efforts.
- Dominant Segment: Terrestrial (60% market share in 2025)
- Key Drivers (Terrestrial): High military vehicle deployments, ongoing modernization efforts.
- Dominant Region: North America
- Key Drivers (North America): High military spending, advanced technology adoption.
- Other Important Regions: Europe, Asia-Pacific
Hard-Kill Systems are slightly more prevalent than Soft-Kill Systems, although both segments are experiencing significant growth driven by increasing demand for comprehensive protection solutions. Naval applications are a rapidly growing segment, propelled by modernization efforts in naval fleets globally.
Active Protection Systems Market Product Developments
Recent product innovations focus on miniaturization, weight reduction, and enhanced lethality of countermeasures. Systems are increasingly integrating AI for improved threat detection and response, leading to enhanced accuracy and reduced false alarms. Active Protection Systems are finding expanded applications beyond traditional military vehicles to protect critical infrastructure, VIP convoys, and other high-value assets. The key competitive advantages lie in superior protection capabilities, reduced system weight, enhanced reliability, and ease of integration with existing platforms.
Key Drivers of Active Protection Systems Market Growth
The market's expansion is propelled by a confluence of factors, including rising geopolitical instability, leading to increased military spending; continuous technological advancements in sensor technology, artificial intelligence, and countermeasure development; and supportive government policies aimed at modernizing defense capabilities. Stringent regulations mandating the use of advanced protection systems for critical assets further stimulate market growth.
Challenges in the Active Protection Systems Market Market
The market faces several challenges including high initial investment costs, complex integration with existing platforms, and stringent regulatory hurdles for system deployment. Supply chain complexities and potential disruptions can impact production and delivery timelines. Intense competition among established and emerging players creates pricing pressures. These challenges necessitate robust R&D investments, strategic supply chain management, and effective regulatory compliance strategies.
Emerging Opportunities in Active Protection Systems Market
Significant long-term growth opportunities exist in integrating advanced technologies like AI and machine learning for enhanced threat identification and neutralization. Strategic partnerships between defense contractors and technology companies can facilitate technological breakthroughs and expedite product development. Expanding into emerging markets with increasing defense budgets offers substantial growth potential. Furthermore, the development of systems for the protection of civilian infrastructure and high-value assets represents a significant avenue for future expansion.
Leading Players in the Active Protection Systems Market Sector
- THALES
- General Dynamics Corporation
- Rheinmetall AG
- Elbit Systems Ltd
- Kongsberg Gruppen ASA
- Rostec State Corporation
- Rafael Advanced Defense Systems Ltd
- RTX Corporation
- Artis
- Leonardo S p A
- BAE Systems plc
- Saab AB
- ASELSAN A Ş
Key Milestones in Active Protection Systems Market Industry
- 2020: Introduction of AI-enhanced threat detection systems by several key players.
- 2021: Successful field trials of miniaturized Active Protection Systems.
- 2022: Significant increase in military spending across several regions, boosting demand.
- 2023: Strategic partnerships formed to accelerate technological advancements and market expansion.
- 2024: Launch of new generation Active Protection Systems with enhanced lethality and reduced weight.
Strategic Outlook for Active Protection Systems Market Market
The Active Protection Systems market is poised for sustained growth, driven by continuous technological innovation, rising geopolitical tensions, and expanding applications. Strategic opportunities lie in focusing on R&D to enhance system capabilities, exploring strategic partnerships to expand market reach and secure supply chains, and targeting emerging markets with high growth potential. Companies that prioritize innovation, adapt to evolving regulatory landscapes, and cultivate strategic alliances are best positioned to capitalize on the considerable opportunities within this dynamic market.
Active Protection Systems Market Segmentation
- 1. Production Analysis
- 2. Consumption Analysis
- 3. Import Market Analysis (Value & Volume)
- 4. Export Market Analysis (Value & Volume)
- 5. Price Trend Analysis
Active Protection Systems Market Segmentation By Geography
-
1. North America
- 1.1. United States
- 1.2. Canada
- 1.3. Mexico
-
2. South America
- 2.1. Brazil
- 2.2. Argentina
- 2.3. Rest of South America
-
3. Europe
- 3.1. United Kingdom
- 3.2. Germany
- 3.3. France
- 3.4. Italy
- 3.5. Spain
- 3.6. Russia
- 3.7. Benelux
- 3.8. Nordics
- 3.9. Rest of Europe
-
4. Middle East & Africa
- 4.1. Turkey
- 4.2. Israel
- 4.3. GCC
- 4.4. North Africa
- 4.5. South Africa
- 4.6. Rest of Middle East & Africa
-
5. Asia Pacific
- 5.1. China
- 5.2. India
- 5.3. Japan
- 5.4. South Korea
- 5.5. ASEAN
- 5.6. Oceania
- 5.7. Rest of Asia Pacific
Active Protection Systems Market REPORT HIGHLIGHTS
| Aspects | Details |
|---|---|
| Study Period | 2019-2033 |
| Base Year | 2024 |
| Estimated Year | 2025 |
| Forecast Period | 2025-2033 |
| Historical Period | 2019-2024 |
| Growth Rate | CAGR of 6.06% from 2019-2033 |
| Segmentation |
|
Table of Contents
- 1. Introduction
- 1.1. Research Scope
- 1.2. Market Segmentation
- 1.3. Research Methodology
- 1.4. Definitions and Assumptions
- 2. Executive Summary
- 2.1. Introduction
- 3. Market Dynamics
- 3.1. Introduction
- 3.2. Market Drivers
- 3.2.1. ; Increasing Number Of Air Passengers; Use Of Portable Electronic Devices
- 3.3. Market Restrains
- 3.3.1. ; High Cost Of Connectivity Equipments
- 3.4. Market Trends
- 3.4.1. The Terrestrial Segment Holds Highest Shares in the Market
- 4. Market Factor Analysis
- 4.1. Porters Five Forces
- 4.2. Supply/Value Chain
- 4.3. PESTEL analysis
- 4.4. Market Entropy
- 4.5. Patent/Trademark Analysis
- 5. Global Active Protection Systems Market Analysis, Insights and Forecast, 2019-2031
- 5.1. Market Analysis, Insights and Forecast - by Production Analysis
- 5.2. Market Analysis, Insights and Forecast - by Consumption Analysis
- 5.3. Market Analysis, Insights and Forecast - by Import Market Analysis (Value & Volume)
- 5.4. Market Analysis, Insights and Forecast - by Export Market Analysis (Value & Volume)
- 5.5. Market Analysis, Insights and Forecast - by Price Trend Analysis
- 5.6. Market Analysis, Insights and Forecast - by Region
- 5.6.1. North America
- 5.6.2. South America
- 5.6.3. Europe
- 5.6.4. Middle East & Africa
- 5.6.5. Asia Pacific
- 5.1. Market Analysis, Insights and Forecast - by Production Analysis
- 6. North America Active Protection Systems Market Analysis, Insights and Forecast, 2019-2031
- 6.1. Market Analysis, Insights and Forecast - by Production Analysis
- 6.2. Market Analysis, Insights and Forecast - by Consumption Analysis
- 6.3. Market Analysis, Insights and Forecast - by Import Market Analysis (Value & Volume)
- 6.4. Market Analysis, Insights and Forecast - by Export Market Analysis (Value & Volume)
- 6.5. Market Analysis, Insights and Forecast - by Price Trend Analysis
- 6.1. Market Analysis, Insights and Forecast - by Production Analysis
- 7. South America Active Protection Systems Market Analysis, Insights and Forecast, 2019-2031
- 7.1. Market Analysis, Insights and Forecast - by Production Analysis
- 7.2. Market Analysis, Insights and Forecast - by Consumption Analysis
- 7.3. Market Analysis, Insights and Forecast - by Import Market Analysis (Value & Volume)
- 7.4. Market Analysis, Insights and Forecast - by Export Market Analysis (Value & Volume)
- 7.5. Market Analysis, Insights and Forecast - by Price Trend Analysis
- 7.1. Market Analysis, Insights and Forecast - by Production Analysis
- 8. Europe Active Protection Systems Market Analysis, Insights and Forecast, 2019-2031
- 8.1. Market Analysis, Insights and Forecast - by Production Analysis
- 8.2. Market Analysis, Insights and Forecast - by Consumption Analysis
- 8.3. Market Analysis, Insights and Forecast - by Import Market Analysis (Value & Volume)
- 8.4. Market Analysis, Insights and Forecast - by Export Market Analysis (Value & Volume)
- 8.5. Market Analysis, Insights and Forecast - by Price Trend Analysis
- 8.1. Market Analysis, Insights and Forecast - by Production Analysis
- 9. Middle East & Africa Active Protection Systems Market Analysis, Insights and Forecast, 2019-2031
- 9.1. Market Analysis, Insights and Forecast - by Production Analysis
- 9.2. Market Analysis, Insights and Forecast - by Consumption Analysis
- 9.3. Market Analysis, Insights and Forecast - by Import Market Analysis (Value & Volume)
- 9.4. Market Analysis, Insights and Forecast - by Export Market Analysis (Value & Volume)
- 9.5. Market Analysis, Insights and Forecast - by Price Trend Analysis
- 9.1. Market Analysis, Insights and Forecast - by Production Analysis
- 10. Asia Pacific Active Protection Systems Market Analysis, Insights and Forecast, 2019-2031
- 10.1. Market Analysis, Insights and Forecast - by Production Analysis
- 10.2. Market Analysis, Insights and Forecast - by Consumption Analysis
- 10.3. Market Analysis, Insights and Forecast - by Import Market Analysis (Value & Volume)
- 10.4. Market Analysis, Insights and Forecast - by Export Market Analysis (Value & Volume)
- 10.5. Market Analysis, Insights and Forecast - by Price Trend Analysis
- 10.1. Market Analysis, Insights and Forecast - by Production Analysis
- 11. North America Active Protection Systems Market Analysis, Insights and Forecast, 2019-2031
- 11.1. Market Analysis, Insights and Forecast - By Country/Sub-region
- 11.1.1 United States
- 11.1.2 Canada
- 12. Europe Active Protection Systems Market Analysis, Insights and Forecast, 2019-2031
- 12.1. Market Analysis, Insights and Forecast - By Country/Sub-region
- 12.1.1 United Kingdom
- 12.1.2 France
- 12.1.3 Germany
- 12.1.4 Russia
- 12.1.5 Rest of Europe
- 13. Asia Pacific Active Protection Systems Market Analysis, Insights and Forecast, 2019-2031
- 13.1. Market Analysis, Insights and Forecast - By Country/Sub-region
- 13.1.1 China
- 13.1.2 India
- 13.1.3 Japan
- 13.1.4 South Korea
- 13.1.5 Rest of Asia Pacific
- 14. Latin America Active Protection Systems Market Analysis, Insights and Forecast, 2019-2031
- 14.1. Market Analysis, Insights and Forecast - By Country/Sub-region
- 14.1.1 Brazil
- 14.1.2 Mexico
- 14.1.3 Rest of Latin America
- 15. Middle East and Africa Active Protection Systems Market Analysis, Insights and Forecast, 2019-2031
- 15.1. Market Analysis, Insights and Forecast - By Country/Sub-region
- 15.1.1 United Arab Emirates
- 15.1.2 Saudi Arabia
- 15.1.3 Israel
- 15.1.4 South Africa
- 15.1.5 Rest of Middle East and Africa
- 16. Competitive Analysis
- 16.1. Global Market Share Analysis 2024
- 16.2. Company Profiles
- 16.2.1 THALES
- 16.2.1.1. Overview
- 16.2.1.2. Products
- 16.2.1.3. SWOT Analysis
- 16.2.1.4. Recent Developments
- 16.2.1.5. Financials (Based on Availability)
- 16.2.2 General Dynamics Corporation
- 16.2.2.1. Overview
- 16.2.2.2. Products
- 16.2.2.3. SWOT Analysis
- 16.2.2.4. Recent Developments
- 16.2.2.5. Financials (Based on Availability)
- 16.2.3 Rheinmetall AG
- 16.2.3.1. Overview
- 16.2.3.2. Products
- 16.2.3.3. SWOT Analysis
- 16.2.3.4. Recent Developments
- 16.2.3.5. Financials (Based on Availability)
- 16.2.4 Elbit Systems Ltd
- 16.2.4.1. Overview
- 16.2.4.2. Products
- 16.2.4.3. SWOT Analysis
- 16.2.4.4. Recent Developments
- 16.2.4.5. Financials (Based on Availability)
- 16.2.5 Kongsberg Gruppen ASA
- 16.2.5.1. Overview
- 16.2.5.2. Products
- 16.2.5.3. SWOT Analysis
- 16.2.5.4. Recent Developments
- 16.2.5.5. Financials (Based on Availability)
- 16.2.6 Rostec State Corporatio
- 16.2.6.1. Overview
- 16.2.6.2. Products
- 16.2.6.3. SWOT Analysis
- 16.2.6.4. Recent Developments
- 16.2.6.5. Financials (Based on Availability)
- 16.2.7 Rafael Advanced Defense Systems Ltd
- 16.2.7.1. Overview
- 16.2.7.2. Products
- 16.2.7.3. SWOT Analysis
- 16.2.7.4. Recent Developments
- 16.2.7.5. Financials (Based on Availability)
- 16.2.8 RTX Corporation
- 16.2.8.1. Overview
- 16.2.8.2. Products
- 16.2.8.3. SWOT Analysis
- 16.2.8.4. Recent Developments
- 16.2.8.5. Financials (Based on Availability)
- 16.2.9 Artis
- 16.2.9.1. Overview
- 16.2.9.2. Products
- 16.2.9.3. SWOT Analysis
- 16.2.9.4. Recent Developments
- 16.2.9.5. Financials (Based on Availability)
- 16.2.10 Leonardo S p A
- 16.2.10.1. Overview
- 16.2.10.2. Products
- 16.2.10.3. SWOT Analysis
- 16.2.10.4. Recent Developments
- 16.2.10.5. Financials (Based on Availability)
- 16.2.11 BAE Systems plc
- 16.2.11.1. Overview
- 16.2.11.2. Products
- 16.2.11.3. SWOT Analysis
- 16.2.11.4. Recent Developments
- 16.2.11.5. Financials (Based on Availability)
- 16.2.12 Saab AB
- 16.2.12.1. Overview
- 16.2.12.2. Products
- 16.2.12.3. SWOT Analysis
- 16.2.12.4. Recent Developments
- 16.2.12.5. Financials (Based on Availability)
- 16.2.13 ASELSAN A Ş
- 16.2.13.1. Overview
- 16.2.13.2. Products
- 16.2.13.3. SWOT Analysis
- 16.2.13.4. Recent Developments
- 16.2.13.5. Financials (Based on Availability)
- 16.2.1 THALES
List of Figures
- Figure 1: Global Active Protection Systems Market Revenue Breakdown (Million, %) by Region 2024 & 2032
- Figure 2: North America Active Protection Systems Market Revenue (Million), by Country 2024 & 2032
- Figure 3: North America Active Protection Systems Market Revenue Share (%), by Country 2024 & 2032
- Figure 4: Europe Active Protection Systems Market Revenue (Million), by Country 2024 & 2032
- Figure 5: Europe Active Protection Systems Market Revenue Share (%), by Country 2024 & 2032
- Figure 6: Asia Pacific Active Protection Systems Market Revenue (Million), by Country 2024 & 2032
- Figure 7: Asia Pacific Active Protection Systems Market Revenue Share (%), by Country 2024 & 2032
- Figure 8: Latin America Active Protection Systems Market Revenue (Million), by Country 2024 & 2032
- Figure 9: Latin America Active Protection Systems Market Revenue Share (%), by Country 2024 & 2032
- Figure 10: Middle East and Africa Active Protection Systems Market Revenue (Million), by Country 2024 & 2032
- Figure 11: Middle East and Africa Active Protection Systems Market Revenue Share (%), by Country 2024 & 2032
- Figure 12: North America Active Protection Systems Market Revenue (Million), by Production Analysis 2024 & 2032
- Figure 13: North America Active Protection Systems Market Revenue Share (%), by Production Analysis 2024 & 2032
- Figure 14: North America Active Protection Systems Market Revenue (Million), by Consumption Analysis 2024 & 2032
- Figure 15: North America Active Protection Systems Market Revenue Share (%), by Consumption Analysis 2024 & 2032
- Figure 16: North America Active Protection Systems Market Revenue (Million), by Import Market Analysis (Value & Volume) 2024 & 2032
- Figure 17: North America Active Protection Systems Market Revenue Share (%), by Import Market Analysis (Value & Volume) 2024 & 2032
- Figure 18: North America Active Protection Systems Market Revenue (Million), by Export Market Analysis (Value & Volume) 2024 & 2032
- Figure 19: North America Active Protection Systems Market Revenue Share (%), by Export Market Analysis (Value & Volume) 2024 & 2032
- Figure 20: North America Active Protection Systems Market Revenue (Million), by Price Trend Analysis 2024 & 2032
- Figure 21: North America Active Protection Systems Market Revenue Share (%), by Price Trend Analysis 2024 & 2032
- Figure 22: North America Active Protection Systems Market Revenue (Million), by Country 2024 & 2032
- Figure 23: North America Active Protection Systems Market Revenue Share (%), by Country 2024 & 2032
- Figure 24: South America Active Protection Systems Market Revenue (Million), by Production Analysis 2024 & 2032
- Figure 25: South America Active Protection Systems Market Revenue Share (%), by Production Analysis 2024 & 2032
- Figure 26: South America Active Protection Systems Market Revenue (Million), by Consumption Analysis 2024 & 2032
- Figure 27: South America Active Protection Systems Market Revenue Share (%), by Consumption Analysis 2024 & 2032
- Figure 28: South America Active Protection Systems Market Revenue (Million), by Import Market Analysis (Value & Volume) 2024 & 2032
- Figure 29: South America Active Protection Systems Market Revenue Share (%), by Import Market Analysis (Value & Volume) 2024 & 2032
- Figure 30: South America Active Protection Systems Market Revenue (Million), by Export Market Analysis (Value & Volume) 2024 & 2032
- Figure 31: South America Active Protection Systems Market Revenue Share (%), by Export Market Analysis (Value & Volume) 2024 & 2032
- Figure 32: South America Active Protection Systems Market Revenue (Million), by Price Trend Analysis 2024 & 2032
- Figure 33: South America Active Protection Systems Market Revenue Share (%), by Price Trend Analysis 2024 & 2032
- Figure 34: South America Active Protection Systems Market Revenue (Million), by Country 2024 & 2032
- Figure 35: South America Active Protection Systems Market Revenue Share (%), by Country 2024 & 2032
- Figure 36: Europe Active Protection Systems Market Revenue (Million), by Production Analysis 2024 & 2032
- Figure 37: Europe Active Protection Systems Market Revenue Share (%), by Production Analysis 2024 & 2032
- Figure 38: Europe Active Protection Systems Market Revenue (Million), by Consumption Analysis 2024 & 2032
- Figure 39: Europe Active Protection Systems Market Revenue Share (%), by Consumption Analysis 2024 & 2032
- Figure 40: Europe Active Protection Systems Market Revenue (Million), by Import Market Analysis (Value & Volume) 2024 & 2032
- Figure 41: Europe Active Protection Systems Market Revenue Share (%), by Import Market Analysis (Value & Volume) 2024 & 2032
- Figure 42: Europe Active Protection Systems Market Revenue (Million), by Export Market Analysis (Value & Volume) 2024 & 2032
- Figure 43: Europe Active Protection Systems Market Revenue Share (%), by Export Market Analysis (Value & Volume) 2024 & 2032
- Figure 44: Europe Active Protection Systems Market Revenue (Million), by Price Trend Analysis 2024 & 2032
- Figure 45: Europe Active Protection Systems Market Revenue Share (%), by Price Trend Analysis 2024 & 2032
- Figure 46: Europe Active Protection Systems Market Revenue (Million), by Country 2024 & 2032
- Figure 47: Europe Active Protection Systems Market Revenue Share (%), by Country 2024 & 2032
- Figure 48: Middle East & Africa Active Protection Systems Market Revenue (Million), by Production Analysis 2024 & 2032
- Figure 49: Middle East & Africa Active Protection Systems Market Revenue Share (%), by Production Analysis 2024 & 2032
- Figure 50: Middle East & Africa Active Protection Systems Market Revenue (Million), by Consumption Analysis 2024 & 2032
- Figure 51: Middle East & Africa Active Protection Systems Market Revenue Share (%), by Consumption Analysis 2024 & 2032
- Figure 52: Middle East & Africa Active Protection Systems Market Revenue (Million), by Import Market Analysis (Value & Volume) 2024 & 2032
- Figure 53: Middle East & Africa Active Protection Systems Market Revenue Share (%), by Import Market Analysis (Value & Volume) 2024 & 2032
- Figure 54: Middle East & Africa Active Protection Systems Market Revenue (Million), by Export Market Analysis (Value & Volume) 2024 & 2032
- Figure 55: Middle East & Africa Active Protection Systems Market Revenue Share (%), by Export Market Analysis (Value & Volume) 2024 & 2032
- Figure 56: Middle East & Africa Active Protection Systems Market Revenue (Million), by Price Trend Analysis 2024 & 2032
- Figure 57: Middle East & Africa Active Protection Systems Market Revenue Share (%), by Price Trend Analysis 2024 & 2032
- Figure 58: Middle East & Africa Active Protection Systems Market Revenue (Million), by Country 2024 & 2032
- Figure 59: Middle East & Africa Active Protection Systems Market Revenue Share (%), by Country 2024 & 2032
- Figure 60: Asia Pacific Active Protection Systems Market Revenue (Million), by Production Analysis 2024 & 2032
- Figure 61: Asia Pacific Active Protection Systems Market Revenue Share (%), by Production Analysis 2024 & 2032
- Figure 62: Asia Pacific Active Protection Systems Market Revenue (Million), by Consumption Analysis 2024 & 2032
- Figure 63: Asia Pacific Active Protection Systems Market Revenue Share (%), by Consumption Analysis 2024 & 2032
- Figure 64: Asia Pacific Active Protection Systems Market Revenue (Million), by Import Market Analysis (Value & Volume) 2024 & 2032
- Figure 65: Asia Pacific Active Protection Systems Market Revenue Share (%), by Import Market Analysis (Value & Volume) 2024 & 2032
- Figure 66: Asia Pacific Active Protection Systems Market Revenue (Million), by Export Market Analysis (Value & Volume) 2024 & 2032
- Figure 67: Asia Pacific Active Protection Systems Market Revenue Share (%), by Export Market Analysis (Value & Volume) 2024 & 2032
- Figure 68: Asia Pacific Active Protection Systems Market Revenue (Million), by Price Trend Analysis 2024 & 2032
- Figure 69: Asia Pacific Active Protection Systems Market Revenue Share (%), by Price Trend Analysis 2024 & 2032
- Figure 70: Asia Pacific Active Protection Systems Market Revenue (Million), by Country 2024 & 2032
- Figure 71: Asia Pacific Active Protection Systems Market Revenue Share (%), by Country 2024 & 2032
List of Tables
- Table 1: Global Active Protection Systems Market Revenue Million Forecast, by Region 2019 & 2032
- Table 2: Global Active Protection Systems Market Revenue Million Forecast, by Production Analysis 2019 & 2032
- Table 3: Global Active Protection Systems Market Revenue Million Forecast, by Consumption Analysis 2019 & 2032
- Table 4: Global Active Protection Systems Market Revenue Million Forecast, by Import Market Analysis (Value & Volume) 2019 & 2032
- Table 5: Global Active Protection Systems Market Revenue Million Forecast, by Export Market Analysis (Value & Volume) 2019 & 2032
- Table 6: Global Active Protection Systems Market Revenue Million Forecast, by Price Trend Analysis 2019 & 2032
- Table 7: Global Active Protection Systems Market Revenue Million Forecast, by Region 2019 & 2032
- Table 8: Global Active Protection Systems Market Revenue Million Forecast, by Country 2019 & 2032
- Table 9: United States Active Protection Systems Market Revenue (Million) Forecast, by Application 2019 & 2032
- Table 10: Canada Active Protection Systems Market Revenue (Million) Forecast, by Application 2019 & 2032
- Table 11: Global Active Protection Systems Market Revenue Million Forecast, by Country 2019 & 2032
- Table 12: United Kingdom Active Protection Systems Market Revenue (Million) Forecast, by Application 2019 & 2032
- Table 13: France Active Protection Systems Market Revenue (Million) Forecast, by Application 2019 & 2032
- Table 14: Germany Active Protection Systems Market Revenue (Million) Forecast, by Application 2019 & 2032
- Table 15: Russia Active Protection Systems Market Revenue (Million) Forecast, by Application 2019 & 2032
- Table 16: Rest of Europe Active Protection Systems Market Revenue (Million) Forecast, by Application 2019 & 2032
- Table 17: Global Active Protection Systems Market Revenue Million Forecast, by Country 2019 & 2032
- Table 18: China Active Protection Systems Market Revenue (Million) Forecast, by Application 2019 & 2032
- Table 19: India Active Protection Systems Market Revenue (Million) Forecast, by Application 2019 & 2032
- Table 20: Japan Active Protection Systems Market Revenue (Million) Forecast, by Application 2019 & 2032
- Table 21: South Korea Active Protection Systems Market Revenue (Million) Forecast, by Application 2019 & 2032
- Table 22: Rest of Asia Pacific Active Protection Systems Market Revenue (Million) Forecast, by Application 2019 & 2032
- Table 23: Global Active Protection Systems Market Revenue Million Forecast, by Country 2019 & 2032
- Table 24: Brazil Active Protection Systems Market Revenue (Million) Forecast, by Application 2019 & 2032
- Table 25: Mexico Active Protection Systems Market Revenue (Million) Forecast, by Application 2019 & 2032
- Table 26: Rest of Latin America Active Protection Systems Market Revenue (Million) Forecast, by Application 2019 & 2032
- Table 27: Global Active Protection Systems Market Revenue Million Forecast, by Country 2019 & 2032
- Table 28: United Arab Emirates Active Protection Systems Market Revenue (Million) Forecast, by Application 2019 & 2032
- Table 29: Saudi Arabia Active Protection Systems Market Revenue (Million) Forecast, by Application 2019 & 2032
- Table 30: Israel Active Protection Systems Market Revenue (Million) Forecast, by Application 2019 & 2032
- Table 31: South Africa Active Protection Systems Market Revenue (Million) Forecast, by Application 2019 & 2032
- Table 32: Rest of Middle East and Africa Active Protection Systems Market Revenue (Million) Forecast, by Application 2019 & 2032
- Table 33: Global Active Protection Systems Market Revenue Million Forecast, by Production Analysis 2019 & 2032
- Table 34: Global Active Protection Systems Market Revenue Million Forecast, by Consumption Analysis 2019 & 2032
- Table 35: Global Active Protection Systems Market Revenue Million Forecast, by Import Market Analysis (Value & Volume) 2019 & 2032
- Table 36: Global Active Protection Systems Market Revenue Million Forecast, by Export Market Analysis (Value & Volume) 2019 & 2032
- Table 37: Global Active Protection Systems Market Revenue Million Forecast, by Price Trend Analysis 2019 & 2032
- Table 38: Global Active Protection Systems Market Revenue Million Forecast, by Country 2019 & 2032
- Table 39: United States Active Protection Systems Market Revenue (Million) Forecast, by Application 2019 & 2032
- Table 40: Canada Active Protection Systems Market Revenue (Million) Forecast, by Application 2019 & 2032
- Table 41: Mexico Active Protection Systems Market Revenue (Million) Forecast, by Application 2019 & 2032
- Table 42: Global Active Protection Systems Market Revenue Million Forecast, by Production Analysis 2019 & 2032
- Table 43: Global Active Protection Systems Market Revenue Million Forecast, by Consumption Analysis 2019 & 2032
- Table 44: Global Active Protection Systems Market Revenue Million Forecast, by Import Market Analysis (Value & Volume) 2019 & 2032
- Table 45: Global Active Protection Systems Market Revenue Million Forecast, by Export Market Analysis (Value & Volume) 2019 & 2032
- Table 46: Global Active Protection Systems Market Revenue Million Forecast, by Price Trend Analysis 2019 & 2032
- Table 47: Global Active Protection Systems Market Revenue Million Forecast, by Country 2019 & 2032
- Table 48: Brazil Active Protection Systems Market Revenue (Million) Forecast, by Application 2019 & 2032
- Table 49: Argentina Active Protection Systems Market Revenue (Million) Forecast, by Application 2019 & 2032
- Table 50: Rest of South America Active Protection Systems Market Revenue (Million) Forecast, by Application 2019 & 2032
- Table 51: Global Active Protection Systems Market Revenue Million Forecast, by Production Analysis 2019 & 2032
- Table 52: Global Active Protection Systems Market Revenue Million Forecast, by Consumption Analysis 2019 & 2032
- Table 53: Global Active Protection Systems Market Revenue Million Forecast, by Import Market Analysis (Value & Volume) 2019 & 2032
- Table 54: Global Active Protection Systems Market Revenue Million Forecast, by Export Market Analysis (Value & Volume) 2019 & 2032
- Table 55: Global Active Protection Systems Market Revenue Million Forecast, by Price Trend Analysis 2019 & 2032
- Table 56: Global Active Protection Systems Market Revenue Million Forecast, by Country 2019 & 2032
- Table 57: United Kingdom Active Protection Systems Market Revenue (Million) Forecast, by Application 2019 & 2032
- Table 58: Germany Active Protection Systems Market Revenue (Million) Forecast, by Application 2019 & 2032
- Table 59: France Active Protection Systems Market Revenue (Million) Forecast, by Application 2019 & 2032
- Table 60: Italy Active Protection Systems Market Revenue (Million) Forecast, by Application 2019 & 2032
- Table 61: Spain Active Protection Systems Market Revenue (Million) Forecast, by Application 2019 & 2032
- Table 62: Russia Active Protection Systems Market Revenue (Million) Forecast, by Application 2019 & 2032
- Table 63: Benelux Active Protection Systems Market Revenue (Million) Forecast, by Application 2019 & 2032
- Table 64: Nordics Active Protection Systems Market Revenue (Million) Forecast, by Application 2019 & 2032
- Table 65: Rest of Europe Active Protection Systems Market Revenue (Million) Forecast, by Application 2019 & 2032
- Table 66: Global Active Protection Systems Market Revenue Million Forecast, by Production Analysis 2019 & 2032
- Table 67: Global Active Protection Systems Market Revenue Million Forecast, by Consumption Analysis 2019 & 2032
- Table 68: Global Active Protection Systems Market Revenue Million Forecast, by Import Market Analysis (Value & Volume) 2019 & 2032
- Table 69: Global Active Protection Systems Market Revenue Million Forecast, by Export Market Analysis (Value & Volume) 2019 & 2032
- Table 70: Global Active Protection Systems Market Revenue Million Forecast, by Price Trend Analysis 2019 & 2032
- Table 71: Global Active Protection Systems Market Revenue Million Forecast, by Country 2019 & 2032
- Table 72: Turkey Active Protection Systems Market Revenue (Million) Forecast, by Application 2019 & 2032
- Table 73: Israel Active Protection Systems Market Revenue (Million) Forecast, by Application 2019 & 2032
- Table 74: GCC Active Protection Systems Market Revenue (Million) Forecast, by Application 2019 & 2032
- Table 75: North Africa Active Protection Systems Market Revenue (Million) Forecast, by Application 2019 & 2032
- Table 76: South Africa Active Protection Systems Market Revenue (Million) Forecast, by Application 2019 & 2032
- Table 77: Rest of Middle East & Africa Active Protection Systems Market Revenue (Million) Forecast, by Application 2019 & 2032
- Table 78: Global Active Protection Systems Market Revenue Million Forecast, by Production Analysis 2019 & 2032
- Table 79: Global Active Protection Systems Market Revenue Million Forecast, by Consumption Analysis 2019 & 2032
- Table 80: Global Active Protection Systems Market Revenue Million Forecast, by Import Market Analysis (Value & Volume) 2019 & 2032
- Table 81: Global Active Protection Systems Market Revenue Million Forecast, by Export Market Analysis (Value & Volume) 2019 & 2032
- Table 82: Global Active Protection Systems Market Revenue Million Forecast, by Price Trend Analysis 2019 & 2032
- Table 83: Global Active Protection Systems Market Revenue Million Forecast, by Country 2019 & 2032
- Table 84: China Active Protection Systems Market Revenue (Million) Forecast, by Application 2019 & 2032
- Table 85: India Active Protection Systems Market Revenue (Million) Forecast, by Application 2019 & 2032
- Table 86: Japan Active Protection Systems Market Revenue (Million) Forecast, by Application 2019 & 2032
- Table 87: South Korea Active Protection Systems Market Revenue (Million) Forecast, by Application 2019 & 2032
- Table 88: ASEAN Active Protection Systems Market Revenue (Million) Forecast, by Application 2019 & 2032
- Table 89: Oceania Active Protection Systems Market Revenue (Million) Forecast, by Application 2019 & 2032
- Table 90: Rest of Asia Pacific Active Protection Systems Market Revenue (Million) Forecast, by Application 2019 & 2032
Frequently Asked Questions
1. What is the projected Compound Annual Growth Rate (CAGR) of the Active Protection Systems Market?
The projected CAGR is approximately 6.06%.
2. Which companies are prominent players in the Active Protection Systems Market?
Key companies in the market include THALES, General Dynamics Corporation, Rheinmetall AG, Elbit Systems Ltd, Kongsberg Gruppen ASA, Rostec State Corporatio, Rafael Advanced Defense Systems Ltd, RTX Corporation, Artis, Leonardo S p A, BAE Systems plc, Saab AB, ASELSAN A Ş.
3. What are the main segments of the Active Protection Systems Market?
The market segments include Production Analysis, Consumption Analysis, Import Market Analysis (Value & Volume), Export Market Analysis (Value & Volume), Price Trend Analysis.
4. Can you provide details about the market size?
The market size is estimated to be USD 4.23 Million as of 2022.
5. What are some drivers contributing to market growth?
; Increasing Number Of Air Passengers; Use Of Portable Electronic Devices.
6. What are the notable trends driving market growth?
The Terrestrial Segment Holds Highest Shares in the Market.
7. Are there any restraints impacting market growth?
; High Cost Of Connectivity Equipments.
8. Can you provide examples of recent developments in the market?
N/A
9. What pricing options are available for accessing the report?
Pricing options include single-user, multi-user, and enterprise licenses priced at USD 4750, USD 5250, and USD 8750 respectively.
10. Is the market size provided in terms of value or volume?
The market size is provided in terms of value, measured in Million.
11. Are there any specific market keywords associated with the report?
Yes, the market keyword associated with the report is "Active Protection Systems Market," which aids in identifying and referencing the specific market segment covered.
12. How do I determine which pricing option suits my needs best?
The pricing options vary based on user requirements and access needs. Individual users may opt for single-user licenses, while businesses requiring broader access may choose multi-user or enterprise licenses for cost-effective access to the report.
13. Are there any additional resources or data provided in the Active Protection Systems Market report?
While the report offers comprehensive insights, it's advisable to review the specific contents or supplementary materials provided to ascertain if additional resources or data are available.
14. How can I stay updated on further developments or reports in the Active Protection Systems Market?
To stay informed about further developments, trends, and reports in the Active Protection Systems Market, consider subscribing to industry newsletters, following relevant companies and organizations, or regularly checking reputable industry news sources and publications.
Methodology
Step 1 - Identification of Relevant Samples Size from Population Database


Step 2 - Approaches for Defining Global Market Size (Value, Volume* & Price*)

Note*: In applicable scenarios
Step 3 - Data Sources
Primary Research
- Web Analytics
- Survey Reports
- Research Institute
- Latest Research Reports
- Opinion Leaders
Secondary Research
- Annual Reports
- White Paper
- Latest Press Release
- Industry Association
- Paid Database
- Investor Presentations

Step 4 - Data Triangulation
Involves using different sources of information in order to increase the validity of a study
These sources are likely to be stakeholders in a program - participants, other researchers, program staff, other community members, and so on.
Then we put all data in single framework & apply various statistical tools to find out the dynamic on the market.
During the analysis stage, feedback from the stakeholder groups would be compared to determine areas of agreement as well as areas of divergence
