

Key Insights
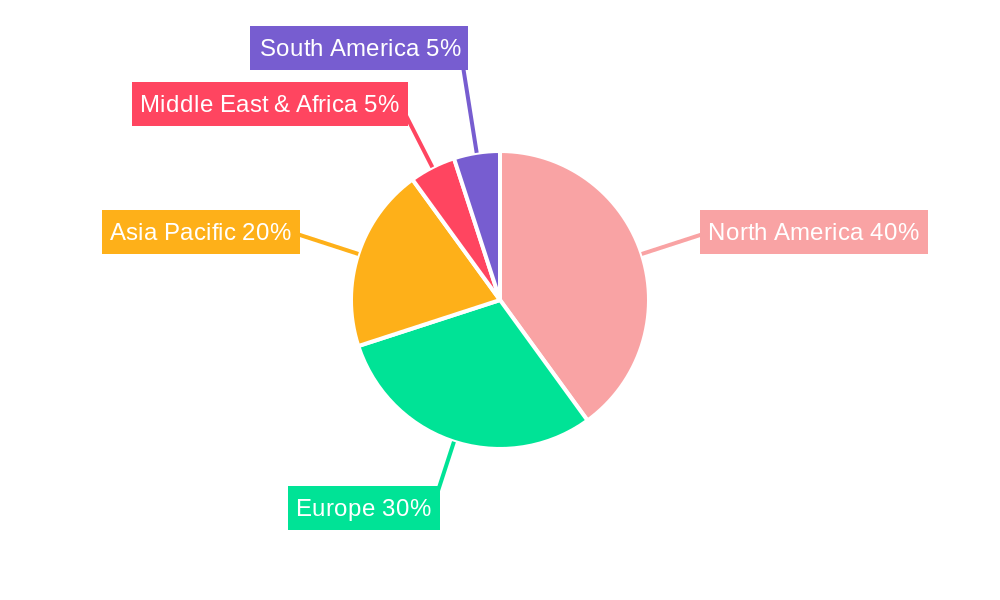
The Yield Management Service Software market is experiencing robust growth, driven by increasing demand for efficient revenue optimization across various sectors. The hospitality industry (hotels, airlines, car rentals) is a major adopter, leveraging these solutions to dynamically adjust pricing based on real-time demand, occupancy rates, and competitor analysis. The shift towards cloud-based solutions is a prominent trend, offering scalability, accessibility, and reduced IT infrastructure costs. While the on-premises segment still holds a significant share, particularly among larger enterprises with stringent data security requirements, cloud adoption is expected to accelerate over the forecast period (2025-2033). Telecommunications and other industries are also increasingly adopting these systems to optimize resource allocation and pricing strategies. Market restraints include the initial investment cost for implementing these systems, the need for specialized expertise in their operation, and concerns about data security and integration with existing systems. However, the significant return on investment (ROI) offered by improved revenue management and reduced operational costs is a powerful driver of market expansion. The North American market currently holds a substantial share, driven by early adoption and a strong technological infrastructure. However, growth in Asia-Pacific is projected to be significant, fueled by expanding tourism and increasing digitalization.
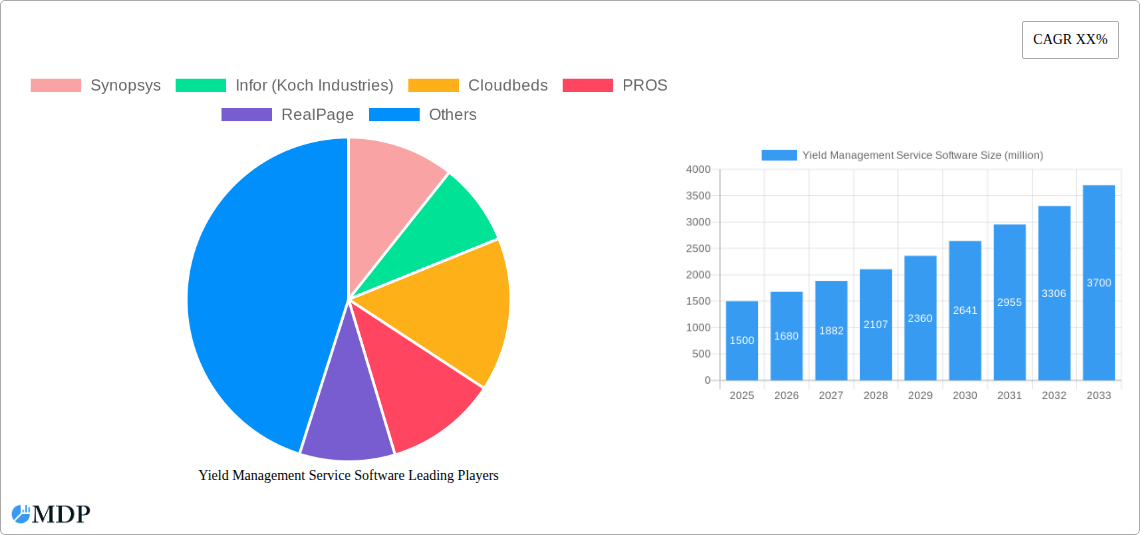
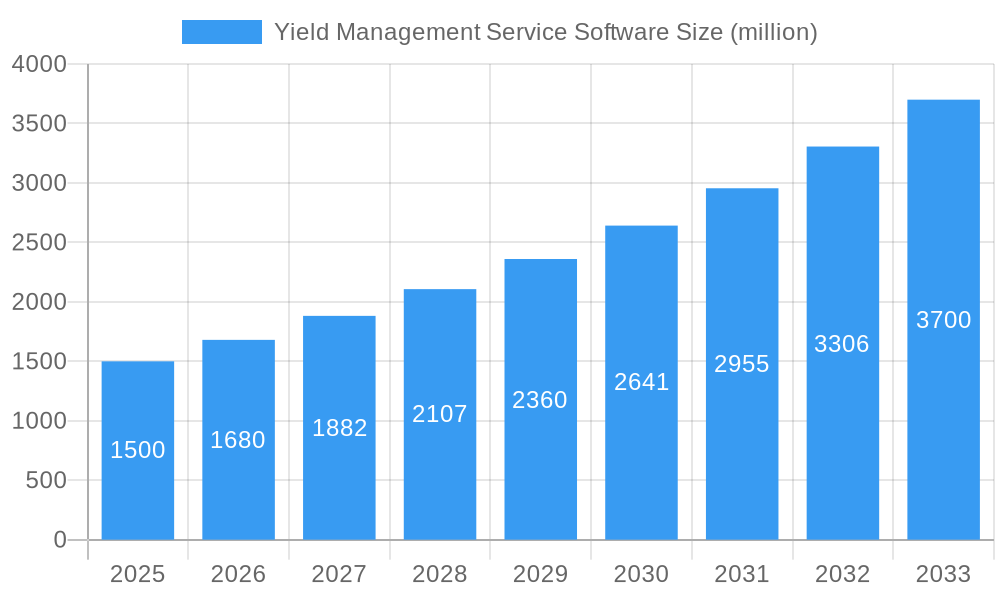
Yield Management Service Software Market Size (In Billion)
The competitive landscape is characterized by a mix of established players like Synopsys, Infor, and SAS, along with innovative startups such as Atomize AB and Duetto. These companies are constantly innovating to offer more sophisticated features such as AI-powered pricing optimization, advanced forecasting capabilities, and seamless integration with various booking platforms. The market is expected to see further consolidation and strategic partnerships as companies strive to expand their market reach and offer comprehensive revenue management solutions. Future growth will likely be influenced by advancements in big data analytics, machine learning, and the increasing adoption of sophisticated pricing strategies to better target specific customer segments and optimize revenue generation across all channels. Estimating a conservative CAGR of 12% for the next decade, we can anticipate a steady rise in market size, with considerable regional variations dependent on the pace of technological adoption and economic development in key regions.
Yield Management Service Software Company Market Share
Yield Management Service Software Market Report: 2019-2033
This comprehensive report provides an in-depth analysis of the global Yield Management Service Software market, projecting a market value exceeding $XX million by 2033. The study covers the period 2019-2033, with 2025 as the base and estimated year, and a forecast period of 2025-2033. This report is essential for industry stakeholders, investors, and businesses seeking to understand market dynamics, competitive landscapes, and future growth opportunities within this rapidly evolving sector.
Yield Management Service Software Market Dynamics & Concentration
The global Yield Management Service Software market exhibits a moderately concentrated landscape, with key players like Synopsys, Infor (Koch Industries), Cloudbeds, PROS, and RealPage holding significant market share. The market share of the top 5 players in 2024 was estimated at XX%, reflecting ongoing consolidation through mergers and acquisitions (M&A). Over the historical period (2019-2024), approximately XX M&A deals were recorded, indicating a strategic push for expansion and market dominance. Innovation drives market growth, with ongoing development of AI-powered pricing optimization and predictive analytics features. Regulatory frameworks, particularly concerning data privacy and security, significantly impact the market. Product substitutes, such as manual yield management strategies, continue to exist, but their limitations compared to software solutions are reducing their market penetration. End-user trends show a preference for cloud-based solutions due to scalability and cost-effectiveness.
Yield Management Service Software Industry Trends & Analysis
The Yield Management Service Software market experienced robust growth during the historical period (2019-2024), with a CAGR of XX%. This growth is driven by the increasing adoption of sophisticated pricing strategies across various industries, fueled by technological advancements like AI and machine learning. Market penetration in the hotel segment is particularly high, exceeding XX% in developed markets. Technological disruptions, such as the rise of big data analytics and the integration of IoT devices, are transforming the landscape. Consumer preferences are shifting towards personalized experiences and seamless online booking processes, demanding advanced yield management capabilities. Competitive dynamics are characterized by continuous innovation, strategic partnerships, and an aggressive push towards market penetration in emerging economies. The forecast period (2025-2033) anticipates a continued upward trajectory, with a projected CAGR of XX%, driven by factors discussed above and the expansion into new sectors.
Leading Markets & Segments in Yield Management Service Software
The Hotel segment dominates the application landscape, accounting for approximately XX% of the market in 2024, driven by the significant demand for revenue optimization within the hospitality industry. Cloud-based solutions are the preferred choice for many businesses, exceeding XX% market share due to their flexibility and scalability, especially amongst smaller players. Geographically, North America held the largest market share in 2024 (XX%), propelled by strong technological adoption rates and a mature tourism sector.
Key Drivers for Hotel Segment Dominance:
- High demand for revenue optimization in a competitive market.
- Availability of advanced analytical tools.
- Widespread adoption of cloud-based solutions.
Key Drivers for North America's Market Leadership:
- Advanced technological infrastructure.
- Strong tourism sector.
- High adoption rate of cloud-based solutions.
- Favorable economic conditions.
The Airline and Telecommunications segments also show substantial growth potential, driven by increased competition and the need for efficient resource allocation.
Yield Management Service Software Product Developments
Recent product innovations focus on enhanced AI-powered predictive analytics for more accurate forecasting, integrated booking platforms for seamless customer journeys, and flexible pricing models to accommodate dynamic market conditions. These advancements provide competitive advantages through improved pricing strategies and operational efficiency, leading to greater market fit and customer satisfaction. The integration of blockchain technology is also emerging as a potential game-changer for enhanced security and transparency in transactions.
Key Drivers of Yield Management Service Software Growth
The market’s growth is primarily fueled by the increasing adoption of cloud-based solutions, providing scalability and cost-effectiveness. Advancements in AI and machine learning are enabling more sophisticated pricing strategies. Furthermore, the growing need for revenue optimization across diverse industries like hospitality, airlines, and car rentals is driving demand for these solutions. Government regulations emphasizing data security and compliance are also influencing the demand for robust and secure software solutions.
Challenges in the Yield Management Service Software Market
Competition amongst established players and new entrants is intense, potentially resulting in price wars. Integration complexities with existing systems can hinder adoption. Data security concerns remain paramount, with breaches resulting in significant financial and reputational damage. Furthermore, the need to adapt to rapidly changing consumer preferences presents a continuous challenge for businesses.
Emerging Opportunities in Yield Management Service Software
The expansion of the software to emerging markets, the integration of IoT devices for real-time data capture, and strategic partnerships with technology providers for enhanced functionality offer significant long-term growth opportunities. The development of specialized solutions for niche markets, such as micro-mobility or short-term rentals, represent further areas of potential growth.
Leading Players in the Yield Management Service Software Sector
- Synopsys
- Infor (Koch Industries)
- Cloudbeds
- PROS
- RealPage
- Integrated Decisions and Systems (SAS)
- Mews
- Atomize AB
- Duetto
- Onto Innovation
- BEONx
- RoomPriceGenie
- SiteMinder
Key Milestones in Yield Management Service Software Industry
- 2020: Increased investment in AI and machine learning capabilities by major players.
- 2021: Launch of several cloud-based yield management platforms with enhanced user interfaces.
- 2022: Several key acquisitions amongst major players driving market consolidation.
- 2023: Growing adoption of blockchain technology for enhanced security and transparency.
- 2024: Focus on the development of API integrations for improved interoperability.
Strategic Outlook for Yield Management Service Software Market
The future of the Yield Management Service Software market appears promising, with strong growth potential driven by ongoing technological advancements, increasing adoption across various industries, and the emergence of new application areas. Strategic partnerships, investment in R&D, and expansion into emerging markets will be key success factors for companies in this dynamic sector. The market is poised for substantial growth, and early adoption of new technologies will likely be crucial for market leadership.
Yield Management Service Software Segmentation
-
1. Application
- 1.1. Hotel
- 1.2. Airlines
- 1.3. Car Rentals
- 1.4. Telecommunications
-
2. Types
- 2.1. Cloud Based
- 2.2. On-premises
Yield Management Service Software Segmentation By Geography
-
1. North America
- 1.1. United States
- 1.2. Canada
- 1.3. Mexico
-
2. South America
- 2.1. Brazil
- 2.2. Argentina
- 2.3. Rest of South America
-
3. Europe
- 3.1. United Kingdom
- 3.2. Germany
- 3.3. France
- 3.4. Italy
- 3.5. Spain
- 3.6. Russia
- 3.7. Benelux
- 3.8. Nordics
- 3.9. Rest of Europe
-
4. Middle East & Africa
- 4.1. Turkey
- 4.2. Israel
- 4.3. GCC
- 4.4. North Africa
- 4.5. South Africa
- 4.6. Rest of Middle East & Africa
-
5. Asia Pacific
- 5.1. China
- 5.2. India
- 5.3. Japan
- 5.4. South Korea
- 5.5. ASEAN
- 5.6. Oceania
- 5.7. Rest of Asia Pacific
Yield Management Service Software Regional Market Share
Geographic Coverage of Yield Management Service Software
Yield Management Service Software REPORT HIGHLIGHTS
| Aspects | Details |
|---|---|
| Study Period | 2020-2034 |
| Base Year | 2025 |
| Estimated Year | 2026 |
| Forecast Period | 2026-2034 |
| Historical Period | 2020-2025 |
| Growth Rate | CAGR of XX% from 2020-2034 |
| Segmentation |
|
Table of Contents
- 1. Introduction
- 1.1. Research Scope
- 1.2. Market Segmentation
- 1.3. Research Objective
- 1.4. Definitions and Assumptions
- 2. Executive Summary
- 2.1. Market Snapshot
- 3. Market Dynamics
- 3.1. Market Drivers
- 3.2. Market Restrains
- 3.3. Market Trends
- 3.4. Market Opportunities
- 4. Market Factor Analysis
- 4.1. Porters Five Forces
- 4.1.1. Bargaining Power of Suppliers
- 4.1.2. Bargaining Power of Buyers
- 4.1.3. Threat of New Entrants
- 4.1.4. Threat of Substitutes
- 4.1.5. Competitive Rivalry
- 4.2. PESTEL analysis
- 4.3. BCG Analysis
- 4.3.1. Stars (High Growth, High Market Share)
- 4.3.2. Cash Cows (Low Growth, High Market Share)
- 4.3.3. Question Mark (High Growth, Low Market Share)
- 4.3.4. Dogs (Low Growth, Low Market Share)
- 4.4. Ansoff Matrix Analysis
- 4.5. Supply Chain Analysis
- 4.6. Regulatory Landscape
- 4.7. Current Market Potential and Opportunity Assessment (TAM–SAM–SOM Framework)
- 4.8. MDP Analyst Note
- 4.1. Porters Five Forces
- 5. Market Analysis, Insights and Forecast 2021-2033
- 5.1. Market Analysis, Insights and Forecast - by Application
- 5.1.1. Hotel
- 5.1.2. Airlines
- 5.1.3. Car Rentals
- 5.1.4. Telecommunications
- 5.2. Market Analysis, Insights and Forecast - by Types
- 5.2.1. Cloud Based
- 5.2.2. On-premises
- 5.3. Market Analysis, Insights and Forecast - by Region
- 5.3.1. North America
- 5.3.2. South America
- 5.3.3. Europe
- 5.3.4. Middle East & Africa
- 5.3.5. Asia Pacific
- 5.1. Market Analysis, Insights and Forecast - by Application
- 6. Global Yield Management Service Software Analysis, Insights and Forecast, 2021-2033
- 6.1. Market Analysis, Insights and Forecast - by Application
- 6.1.1. Hotel
- 6.1.2. Airlines
- 6.1.3. Car Rentals
- 6.1.4. Telecommunications
- 6.2. Market Analysis, Insights and Forecast - by Types
- 6.2.1. Cloud Based
- 6.2.2. On-premises
- 6.1. Market Analysis, Insights and Forecast - by Application
- 7. North America Yield Management Service Software Analysis, Insights and Forecast, 2020-2032
- 7.1. Market Analysis, Insights and Forecast - by Application
- 7.1.1. Hotel
- 7.1.2. Airlines
- 7.1.3. Car Rentals
- 7.1.4. Telecommunications
- 7.2. Market Analysis, Insights and Forecast - by Types
- 7.2.1. Cloud Based
- 7.2.2. On-premises
- 7.1. Market Analysis, Insights and Forecast - by Application
- 8. South America Yield Management Service Software Analysis, Insights and Forecast, 2020-2032
- 8.1. Market Analysis, Insights and Forecast - by Application
- 8.1.1. Hotel
- 8.1.2. Airlines
- 8.1.3. Car Rentals
- 8.1.4. Telecommunications
- 8.2. Market Analysis, Insights and Forecast - by Types
- 8.2.1. Cloud Based
- 8.2.2. On-premises
- 8.1. Market Analysis, Insights and Forecast - by Application
- 9. Europe Yield Management Service Software Analysis, Insights and Forecast, 2020-2032
- 9.1. Market Analysis, Insights and Forecast - by Application
- 9.1.1. Hotel
- 9.1.2. Airlines
- 9.1.3. Car Rentals
- 9.1.4. Telecommunications
- 9.2. Market Analysis, Insights and Forecast - by Types
- 9.2.1. Cloud Based
- 9.2.2. On-premises
- 9.1. Market Analysis, Insights and Forecast - by Application
- 10. Middle East & Africa Yield Management Service Software Analysis, Insights and Forecast, 2020-2032
- 10.1. Market Analysis, Insights and Forecast - by Application
- 10.1.1. Hotel
- 10.1.2. Airlines
- 10.1.3. Car Rentals
- 10.1.4. Telecommunications
- 10.2. Market Analysis, Insights and Forecast - by Types
- 10.2.1. Cloud Based
- 10.2.2. On-premises
- 10.1. Market Analysis, Insights and Forecast - by Application
- 11. Asia Pacific Yield Management Service Software Analysis, Insights and Forecast, 2020-2032
- 11.1. Market Analysis, Insights and Forecast - by Application
- 11.1.1. Hotel
- 11.1.2. Airlines
- 11.1.3. Car Rentals
- 11.1.4. Telecommunications
- 11.2. Market Analysis, Insights and Forecast - by Types
- 11.2.1. Cloud Based
- 11.2.2. On-premises
- 11.1. Market Analysis, Insights and Forecast - by Application
- 12. Competitive Analysis
- 12.1. Company Profiles
- 12.1.1 Synopsys
- 12.1.1.1. Company Overview
- 12.1.1.2. Products
- 12.1.1.3. Company Financials
- 12.1.1.4. SWOT Analysis
- 12.1.2 Infor (Koch Industries)
- 12.1.2.1. Company Overview
- 12.1.2.2. Products
- 12.1.2.3. Company Financials
- 12.1.2.4. SWOT Analysis
- 12.1.3 Cloudbeds
- 12.1.3.1. Company Overview
- 12.1.3.2. Products
- 12.1.3.3. Company Financials
- 12.1.3.4. SWOT Analysis
- 12.1.4 PROS
- 12.1.4.1. Company Overview
- 12.1.4.2. Products
- 12.1.4.3. Company Financials
- 12.1.4.4. SWOT Analysis
- 12.1.5 RealPage
- 12.1.5.1. Company Overview
- 12.1.5.2. Products
- 12.1.5.3. Company Financials
- 12.1.5.4. SWOT Analysis
- 12.1.6 Integrated Decisions and Systems (SAS)
- 12.1.6.1. Company Overview
- 12.1.6.2. Products
- 12.1.6.3. Company Financials
- 12.1.6.4. SWOT Analysis
- 12.1.7 Mews
- 12.1.7.1. Company Overview
- 12.1.7.2. Products
- 12.1.7.3. Company Financials
- 12.1.7.4. SWOT Analysis
- 12.1.8 Atomize AB
- 12.1.8.1. Company Overview
- 12.1.8.2. Products
- 12.1.8.3. Company Financials
- 12.1.8.4. SWOT Analysis
- 12.1.9 Duetto
- 12.1.9.1. Company Overview
- 12.1.9.2. Products
- 12.1.9.3. Company Financials
- 12.1.9.4. SWOT Analysis
- 12.1.10 Onto Innovation
- 12.1.10.1. Company Overview
- 12.1.10.2. Products
- 12.1.10.3. Company Financials
- 12.1.10.4. SWOT Analysis
- 12.1.11 BEONx
- 12.1.11.1. Company Overview
- 12.1.11.2. Products
- 12.1.11.3. Company Financials
- 12.1.11.4. SWOT Analysis
- 12.1.12 RoomPriceGenie
- 12.1.12.1. Company Overview
- 12.1.12.2. Products
- 12.1.12.3. Company Financials
- 12.1.12.4. SWOT Analysis
- 12.1.13 SiteMinder
- 12.1.13.1. Company Overview
- 12.1.13.2. Products
- 12.1.13.3. Company Financials
- 12.1.13.4. SWOT Analysis
- 12.1.1 Synopsys
- 12.2. Market Entropy
- 12.2.1 Company's Key Areas Served
- 12.2.2 Recent Developments
- 12.3. Company Market Share Analysis 2025
- 12.3.1 Top 5 Companies Market Share Analysis
- 12.3.2 Top 3 Companies Market Share Analysis
- 12.4. List of Potential Customers
- 13. Research Methodology
List of Figures
- Figure 1: Global Yield Management Service Software Revenue Breakdown (million, %) by Region 2025 & 2033
- Figure 2: North America Yield Management Service Software Revenue (million), by Application 2025 & 2033
- Figure 3: North America Yield Management Service Software Revenue Share (%), by Application 2025 & 2033
- Figure 4: North America Yield Management Service Software Revenue (million), by Types 2025 & 2033
- Figure 5: North America Yield Management Service Software Revenue Share (%), by Types 2025 & 2033
- Figure 6: North America Yield Management Service Software Revenue (million), by Country 2025 & 2033
- Figure 7: North America Yield Management Service Software Revenue Share (%), by Country 2025 & 2033
- Figure 8: South America Yield Management Service Software Revenue (million), by Application 2025 & 2033
- Figure 9: South America Yield Management Service Software Revenue Share (%), by Application 2025 & 2033
- Figure 10: South America Yield Management Service Software Revenue (million), by Types 2025 & 2033
- Figure 11: South America Yield Management Service Software Revenue Share (%), by Types 2025 & 2033
- Figure 12: South America Yield Management Service Software Revenue (million), by Country 2025 & 2033
- Figure 13: South America Yield Management Service Software Revenue Share (%), by Country 2025 & 2033
- Figure 14: Europe Yield Management Service Software Revenue (million), by Application 2025 & 2033
- Figure 15: Europe Yield Management Service Software Revenue Share (%), by Application 2025 & 2033
- Figure 16: Europe Yield Management Service Software Revenue (million), by Types 2025 & 2033
- Figure 17: Europe Yield Management Service Software Revenue Share (%), by Types 2025 & 2033
- Figure 18: Europe Yield Management Service Software Revenue (million), by Country 2025 & 2033
- Figure 19: Europe Yield Management Service Software Revenue Share (%), by Country 2025 & 2033
- Figure 20: Middle East & Africa Yield Management Service Software Revenue (million), by Application 2025 & 2033
- Figure 21: Middle East & Africa Yield Management Service Software Revenue Share (%), by Application 2025 & 2033
- Figure 22: Middle East & Africa Yield Management Service Software Revenue (million), by Types 2025 & 2033
- Figure 23: Middle East & Africa Yield Management Service Software Revenue Share (%), by Types 2025 & 2033
- Figure 24: Middle East & Africa Yield Management Service Software Revenue (million), by Country 2025 & 2033
- Figure 25: Middle East & Africa Yield Management Service Software Revenue Share (%), by Country 2025 & 2033
- Figure 26: Asia Pacific Yield Management Service Software Revenue (million), by Application 2025 & 2033
- Figure 27: Asia Pacific Yield Management Service Software Revenue Share (%), by Application 2025 & 2033
- Figure 28: Asia Pacific Yield Management Service Software Revenue (million), by Types 2025 & 2033
- Figure 29: Asia Pacific Yield Management Service Software Revenue Share (%), by Types 2025 & 2033
- Figure 30: Asia Pacific Yield Management Service Software Revenue (million), by Country 2025 & 2033
- Figure 31: Asia Pacific Yield Management Service Software Revenue Share (%), by Country 2025 & 2033
List of Tables
- Table 1: Global Yield Management Service Software Revenue million Forecast, by Application 2020 & 2033
- Table 2: Global Yield Management Service Software Revenue million Forecast, by Types 2020 & 2033
- Table 3: Global Yield Management Service Software Revenue million Forecast, by Region 2020 & 2033
- Table 4: Global Yield Management Service Software Revenue million Forecast, by Application 2020 & 2033
- Table 5: Global Yield Management Service Software Revenue million Forecast, by Types 2020 & 2033
- Table 6: Global Yield Management Service Software Revenue million Forecast, by Country 2020 & 2033
- Table 7: United States Yield Management Service Software Revenue (million) Forecast, by Application 2020 & 2033
- Table 8: Canada Yield Management Service Software Revenue (million) Forecast, by Application 2020 & 2033
- Table 9: Mexico Yield Management Service Software Revenue (million) Forecast, by Application 2020 & 2033
- Table 10: Global Yield Management Service Software Revenue million Forecast, by Application 2020 & 2033
- Table 11: Global Yield Management Service Software Revenue million Forecast, by Types 2020 & 2033
- Table 12: Global Yield Management Service Software Revenue million Forecast, by Country 2020 & 2033
- Table 13: Brazil Yield Management Service Software Revenue (million) Forecast, by Application 2020 & 2033
- Table 14: Argentina Yield Management Service Software Revenue (million) Forecast, by Application 2020 & 2033
- Table 15: Rest of South America Yield Management Service Software Revenue (million) Forecast, by Application 2020 & 2033
- Table 16: Global Yield Management Service Software Revenue million Forecast, by Application 2020 & 2033
- Table 17: Global Yield Management Service Software Revenue million Forecast, by Types 2020 & 2033
- Table 18: Global Yield Management Service Software Revenue million Forecast, by Country 2020 & 2033
- Table 19: United Kingdom Yield Management Service Software Revenue (million) Forecast, by Application 2020 & 2033
- Table 20: Germany Yield Management Service Software Revenue (million) Forecast, by Application 2020 & 2033
- Table 21: France Yield Management Service Software Revenue (million) Forecast, by Application 2020 & 2033
- Table 22: Italy Yield Management Service Software Revenue (million) Forecast, by Application 2020 & 2033
- Table 23: Spain Yield Management Service Software Revenue (million) Forecast, by Application 2020 & 2033
- Table 24: Russia Yield Management Service Software Revenue (million) Forecast, by Application 2020 & 2033
- Table 25: Benelux Yield Management Service Software Revenue (million) Forecast, by Application 2020 & 2033
- Table 26: Nordics Yield Management Service Software Revenue (million) Forecast, by Application 2020 & 2033
- Table 27: Rest of Europe Yield Management Service Software Revenue (million) Forecast, by Application 2020 & 2033
- Table 28: Global Yield Management Service Software Revenue million Forecast, by Application 2020 & 2033
- Table 29: Global Yield Management Service Software Revenue million Forecast, by Types 2020 & 2033
- Table 30: Global Yield Management Service Software Revenue million Forecast, by Country 2020 & 2033
- Table 31: Turkey Yield Management Service Software Revenue (million) Forecast, by Application 2020 & 2033
- Table 32: Israel Yield Management Service Software Revenue (million) Forecast, by Application 2020 & 2033
- Table 33: GCC Yield Management Service Software Revenue (million) Forecast, by Application 2020 & 2033
- Table 34: North Africa Yield Management Service Software Revenue (million) Forecast, by Application 2020 & 2033
- Table 35: South Africa Yield Management Service Software Revenue (million) Forecast, by Application 2020 & 2033
- Table 36: Rest of Middle East & Africa Yield Management Service Software Revenue (million) Forecast, by Application 2020 & 2033
- Table 37: Global Yield Management Service Software Revenue million Forecast, by Application 2020 & 2033
- Table 38: Global Yield Management Service Software Revenue million Forecast, by Types 2020 & 2033
- Table 39: Global Yield Management Service Software Revenue million Forecast, by Country 2020 & 2033
- Table 40: China Yield Management Service Software Revenue (million) Forecast, by Application 2020 & 2033
- Table 41: India Yield Management Service Software Revenue (million) Forecast, by Application 2020 & 2033
- Table 42: Japan Yield Management Service Software Revenue (million) Forecast, by Application 2020 & 2033
- Table 43: South Korea Yield Management Service Software Revenue (million) Forecast, by Application 2020 & 2033
- Table 44: ASEAN Yield Management Service Software Revenue (million) Forecast, by Application 2020 & 2033
- Table 45: Oceania Yield Management Service Software Revenue (million) Forecast, by Application 2020 & 2033
- Table 46: Rest of Asia Pacific Yield Management Service Software Revenue (million) Forecast, by Application 2020 & 2033
Frequently Asked Questions
1. What is the projected Compound Annual Growth Rate (CAGR) of the Yield Management Service Software?
The projected CAGR is approximately XX%.
2. Which companies are prominent players in the Yield Management Service Software?
Key companies in the market include Synopsys, Infor (Koch Industries), Cloudbeds, PROS, RealPage, Integrated Decisions and Systems (SAS), Mews, Atomize AB, Duetto, Onto Innovation, BEONx, RoomPriceGenie, SiteMinder.
3. What are the main segments of the Yield Management Service Software?
The market segments include Application, Types.
4. Can you provide details about the market size?
The market size is estimated to be USD XXX million as of 2022.
5. What are some drivers contributing to market growth?
N/A
6. What are the notable trends driving market growth?
N/A
7. Are there any restraints impacting market growth?
N/A
8. Can you provide examples of recent developments in the market?
N/A
9. What pricing options are available for accessing the report?
Pricing options include single-user, multi-user, and enterprise licenses priced at USD 2900.00, USD 4350.00, and USD 5800.00 respectively.
10. Is the market size provided in terms of value or volume?
The market size is provided in terms of value, measured in million.
11. Are there any specific market keywords associated with the report?
Yes, the market keyword associated with the report is "Yield Management Service Software," which aids in identifying and referencing the specific market segment covered.
12. How do I determine which pricing option suits my needs best?
The pricing options vary based on user requirements and access needs. Individual users may opt for single-user licenses, while businesses requiring broader access may choose multi-user or enterprise licenses for cost-effective access to the report.
13. Are there any additional resources or data provided in the Yield Management Service Software report?
While the report offers comprehensive insights, it's advisable to review the specific contents or supplementary materials provided to ascertain if additional resources or data are available.
14. How can I stay updated on further developments or reports in the Yield Management Service Software?
To stay informed about further developments, trends, and reports in the Yield Management Service Software, consider subscribing to industry newsletters, following relevant companies and organizations, or regularly checking reputable industry news sources and publications.
Methodology
Step 1 - Identification of Relevant Samples Size from Population Database


Step 2 - Approaches for Defining Global Market Size (Value, Volume* & Price*)

Note*: In applicable scenarios
Step 3 - Data Sources
Primary Research
- Web Analytics
- Survey Reports
- Research Institute
- Latest Research Reports
- Opinion Leaders
Secondary Research
- Annual Reports
- White Paper
- Latest Press Release
- Industry Association
- Paid Database
- Investor Presentations

Step 4 - Data Triangulation
Involves using different sources of information in order to increase the validity of a study
These sources are likely to be stakeholders in a program - participants, other researchers, program staff, other community members, and so on.
Then we put all data in single framework & apply various statistical tools to find out the dynamic on the market.
During the analysis stage, feedback from the stakeholder groups would be compared to determine areas of agreement as well as areas of divergence