

Key Insights
The global market for Used Beverage Cans is poised for significant growth, driven by increasing consumer demand for convenient beverages and a growing emphasis on sustainable packaging solutions. With a current market size of approximately USD 65.9 billion in 2025, the industry is projected to expand at a robust Compound Annual Growth Rate (CAGR) of 5.3% through 2033. This upward trajectory is underpinned by the inherent recyclability of aluminum, which offers environmental advantages over virgin materials and aligns with circular economy principles. The rising popularity of carbonated soft drinks, alcoholic beverages, and a burgeoning fruit and vegetable juice sector are key application drivers, contributing to the sustained demand for beverage cans. Furthermore, advancements in can manufacturing technologies, leading to lighter yet durable designs, are also bolstering market expansion.
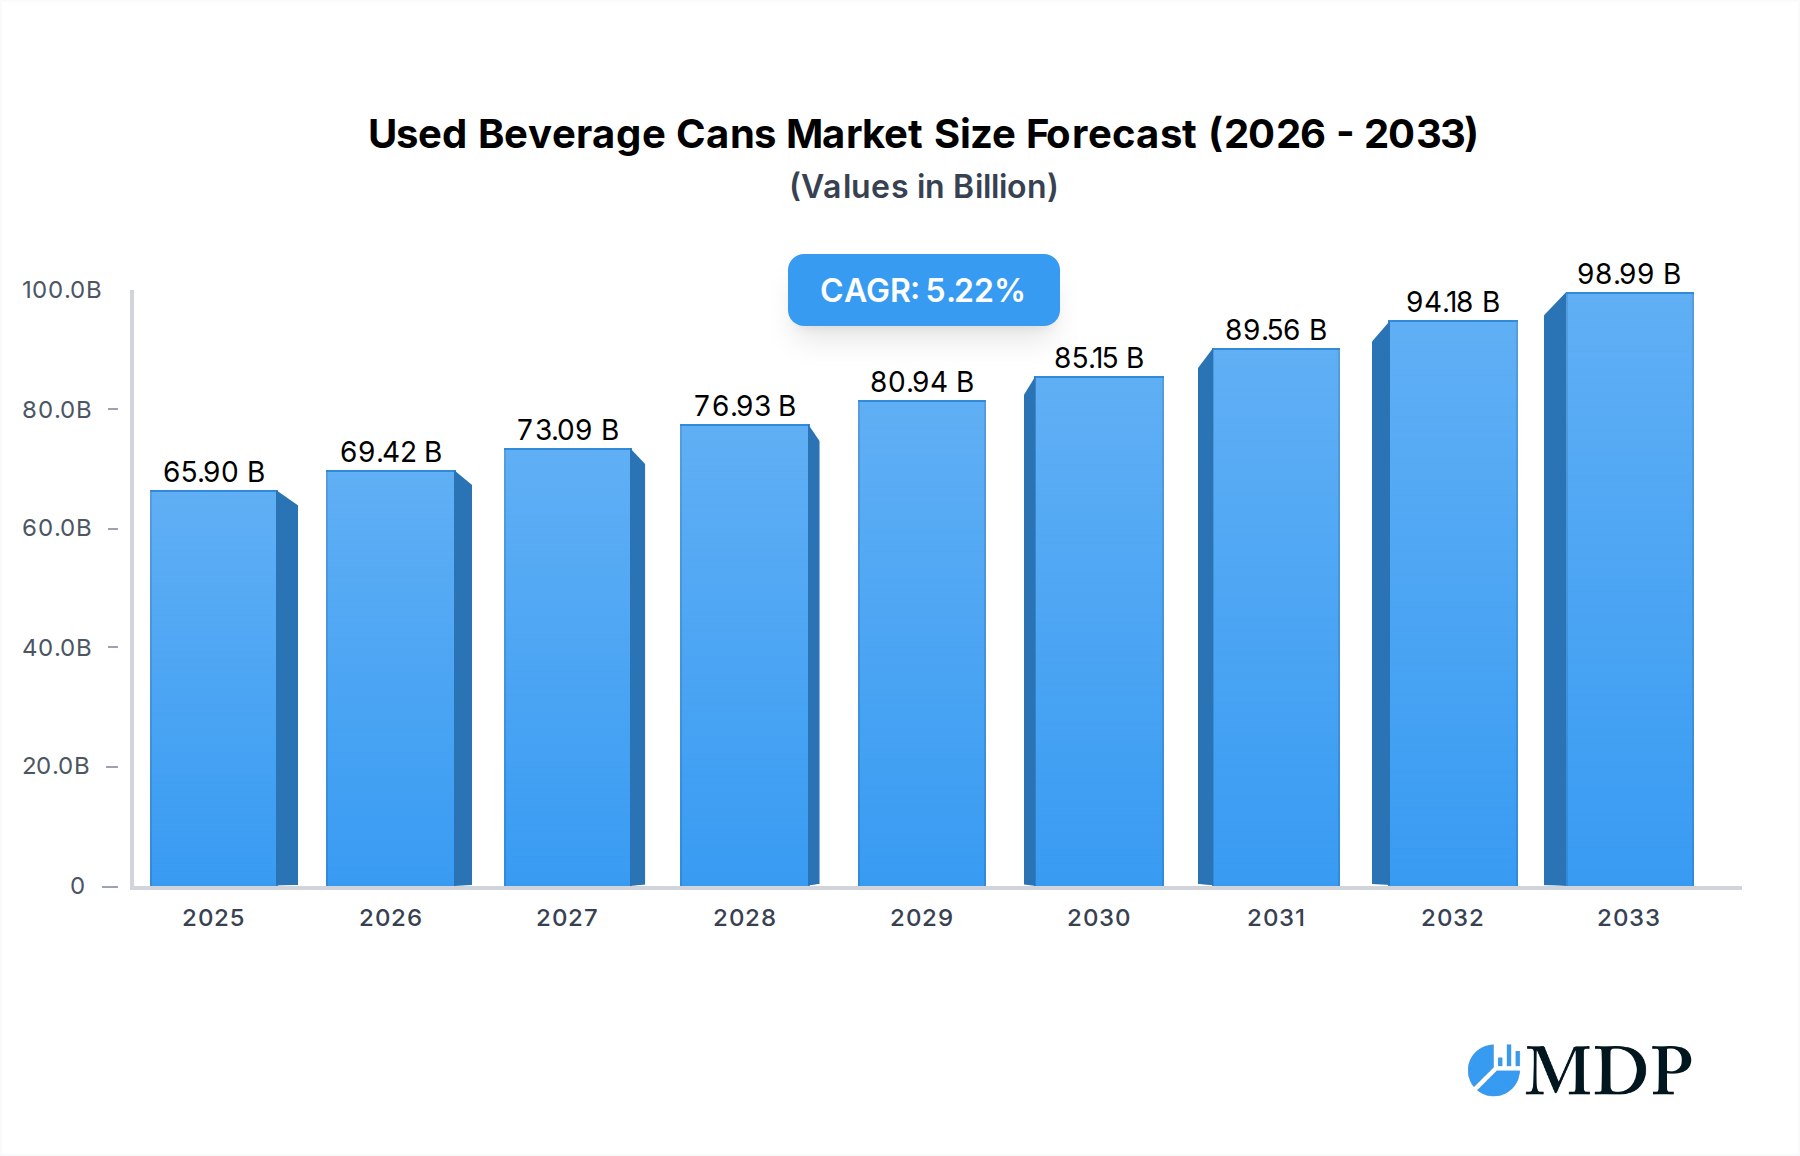
Used Beverage Cans Market Size (In Billion)
The market's robust growth is further supported by a strong emphasis on recycling initiatives and evolving consumer preferences. As environmental consciousness grows, consumers are increasingly favoring products packaged in recyclable materials, thereby boosting the demand for used beverage cans as feedstock for new production. The market is segmented into two primary types: three-piece cans and two-piece cans, with the latter gaining traction due to its efficiency in material usage and production. Key players such as Novelis, Ball Corporation, and Hydro are actively investing in innovative recycling technologies and expanding their production capacities to meet this escalating demand. Geographically, the Asia Pacific region, particularly China and India, is expected to exhibit the fastest growth, propelled by rapid urbanization and a burgeoning middle class. The North American and European markets, with their established recycling infrastructure and mature beverage industries, will continue to be significant contributors to the global market value.

Used Beverage Cans Company Market Share
Dive deep into the burgeoning Used Beverage Cans market with our comprehensive report, offering unparalleled insights into market dynamics, industry trends, leading segments, and strategic outlook. This report is an essential resource for stakeholders seeking to navigate the global beverage can recycling landscape and capitalize on opportunities within the aluminum can market. We analyze critical factors influencing growth, from evolving consumer preferences for sustainable packaging solutions to advancements in metal recycling technologies. The report covers the used beverage can value chain, from collection and sorting to reprocessing and reintroduction into manufacturing, providing actionable intelligence for recyclers, beverage manufacturers, and aluminum producers. Explore market concentration, innovation drivers, regulatory frameworks, product substitutes, and end-user trends shaping the circular economy for aluminum. With a study period spanning 2019 to 2033, a base year of 2025, and a forecast period from 2025 to 2033, this report delivers a robust analysis of the beverage packaging market.
Used Beverage Cans Market Dynamics & Concentration
The global Used Beverage Cans market exhibits a moderate to high concentration, with key players like Ball Corporation, Novelis, and Hydro dominating significant portions of the aluminum scrap market. Innovation drivers are primarily focused on enhancing recycling efficiency, reducing processing costs, and developing advanced sorting technologies to improve the quality of recovered aluminum. Regulatory frameworks, including extended producer responsibility (EPR) schemes and recycled content mandates, are increasingly shaping market dynamics, encouraging higher collection and recycling rates. Product substitutes, such as plastic bottles and glass containers, continue to present a competitive challenge, though the superior recyclability and lower carbon footprint of aluminum cans are gaining traction. End-user trends reveal a growing consumer preference for environmentally friendly packaging, driving demand for recycled aluminum in beverage cans. Mergers and acquisitions (M&A) activities are sporadic but strategically important, aimed at consolidating market share, expanding geographical reach, and acquiring advanced recycling capabilities. M&A deal counts are projected to increase as companies seek to secure supply chains and enhance sustainability credentials in the beverage can recycling industry. The market share of major players is estimated to be over 60% of the global processed used beverage cans.
Used Beverage Cans Industry Trends & Analysis
The Used Beverage Cans industry is poised for significant expansion, driven by a confluence of factors. The escalating global demand for beverages, particularly carbonated soft drinks and alcoholic beverages, directly fuels the need for aluminum cans. A critical growth driver is the increasing consumer awareness and preference for sustainable packaging, pushing manufacturers to adopt recycled aluminum solutions. This trend is further amplified by stringent government regulations and corporate sustainability goals worldwide, mandating higher recycled content in beverage packaging. Technological disruptions are revolutionizing the beverage can recycling process, with advancements in sorting technologies, such as eddy current separators and optical sorters, significantly improving the purity and efficiency of aluminum recovery. Innovations in smelting and refining techniques are also reducing energy consumption and environmental impact, making recycled aluminum more competitive. The market penetration of used beverage cans as a primary source of aluminum for new can production is projected to reach over 70% by the end of the forecast period. The compound annual growth rate (CAGR) for the Used Beverage Cans market is estimated to be approximately 4.8% from 2025 to 2033, reflecting robust underlying demand and supportive policy environments. Consumer preferences are clearly shifting towards brands that demonstrate a commitment to circular economy principles, with aluminum can recycling at the forefront. Competitive dynamics are characterized by intense competition among scrap processors, aluminum smelters, and beverage can manufacturers, all vying for efficient and cost-effective access to high-quality used beverage cans. Strategic partnerships and collaborations are becoming increasingly prevalent to optimize collection networks and secure feedstock for recycling operations, ensuring a stable supply of recycled aluminum for the beverage industry.
Leading Markets & Segments in Used Beverage Cans
The Carbonated Soft Drinks segment stands as the dominant force within the Used Beverage Cans market. This dominance is underpinned by the sheer volume of carbonated beverages consumed globally and the long-standing preference for aluminum cans as the packaging of choice for these products due to their excellent barrier properties, light weight, and perceived premium quality. The Application of Carbonated Soft Drinks accounts for an estimated 45% of the total used beverage cans collected and processed. The Two-Piece Cans segment is also highly significant, representing approximately 85% of all beverage cans manufactured. Their widespread adoption is attributed to their manufacturing efficiency, cost-effectiveness, and superior structural integrity for high-pressure contents, making them ideal for carbonated beverages.
- Dominant Region: North America and Europe currently lead in terms of both collection infrastructure and demand for recycled aluminum in beverage cans. This leadership is attributed to well-established recycling programs, strong consumer participation in recycling, and robust regulatory frameworks that promote sustainable packaging.
- Key Drivers of Dominance (Carbonated Soft Drinks & Two-Piece Cans):
- Economic Policies: Government incentives for recycling, deposit-return schemes, and mandates for recycled content in packaging significantly boost collection and processing.
- Infrastructure Development: Extensive network of collection centers, Material Recovery Facilities (MRFs), and recycling plants across these regions ensures efficient processing of used beverage cans.
- Consumer Awareness: High levels of environmental consciousness among consumers in these regions translate into greater participation in recycling programs.
- Beverage Industry Presence: A strong presence of major beverage manufacturers committed to using sustainable packaging drives demand for recycled aluminum.
- Technological Advancements: Early adoption and continuous improvement of recycling technologies in these regions have enhanced the quality and volume of recovered aluminum.
The Alcoholic Beverages segment also represents a substantial and growing market for used beverage cans, driven by the increasing popularity of canned alcoholic beverages like hard seltzers and craft beers. While Fruit & Vegetable Juices and Tea segments represent smaller but steadily growing applications, their contribution to the overall used beverage can market is notable, reflecting a broader trend towards aluminum packaging across diverse beverage categories.
Used Beverage Cans Product Developments
Innovations in the Used Beverage Cans sector are primarily centered on enhancing the efficiency and sustainability of the recycling process and improving the quality of recovered aluminum. Advancements in optical sorting and artificial intelligence (AI) are enabling more precise separation of aluminum alloys, leading to higher-purity recycled aluminum. This improved quality is crucial for meeting the stringent specifications of beverage can manufacturers. Furthermore, research into lower-temperature smelting and refining processes is reducing the energy footprint of recycling. Competitive advantages are derived from companies that can offer consistently high-quality recycled aluminum at competitive prices, supported by robust and transparent supply chains. The market is witnessing a rise in integrated recycling facilities that offer end-to-end solutions, from collection to the production of high-grade aluminum feedstock, thereby strengthening their market position and ensuring a reliable supply for the beverage can manufacturing industry.
Key Drivers of Used Beverage Cans Growth
Several key drivers are propelling the growth of the Used Beverage Cans market. Technologically, advancements in sorting and recycling efficiency are making it more economically viable and environmentally beneficial to process used beverage cans. Economically, increasing aluminum prices and the rising cost of virgin aluminum production favor the use of recycled materials. Regulatory factors, such as mandates for recycled content in packaging and extended producer responsibility (EPR) schemes, are creating a strong pull for used beverage cans. For instance, the European Union's target of 95% collection rate for beverage cans by 2029 is a significant regulatory driver. The growing consumer demand for sustainable packaging solutions further amplifies these drivers, pushing brands to adopt circular economy models.
Challenges in the Used Beverage Cans Market
Despite robust growth, the Used Beverage Cans market faces several challenges. Regulatory hurdles can arise from inconsistencies in recycling policies across different regions, creating complexity for international operators. Supply chain issues, including fluctuations in collection rates and contamination of recyclables, can impact the consistency and quality of feedstock. Competitive pressures from alternative packaging materials like plastics, which often have lower upfront costs, remain a concern. Quantifiable impacts include potential increases in processing costs due to contamination, leading to reduced yields of high-grade aluminum. Furthermore, the capital-intensive nature of advanced recycling technologies can be a barrier to entry for smaller players, affecting overall market accessibility and innovation.
Emerging Opportunities in Used Beverage Cans
The Used Beverage Cans market is ripe with emerging opportunities. Technological breakthroughs in areas like chemical recycling of aluminum alloys could unlock new avenues for processing lower-grade scrap, expanding the usable feedstock. Strategic partnerships between beverage manufacturers, recyclers, and technology providers are fostering innovation in collection systems and material recovery. Market expansion into developing economies, where aluminum can consumption is rising and recycling infrastructure is nascent, presents significant long-term growth potential. The increasing focus on ESG (Environmental, Social, and Governance) investing is also directing capital towards sustainable industries like aluminum recycling, creating funding opportunities for growth initiatives.
Leading Players in the Used Beverage Cans Sector
- Ball Corporation
- Novelis
- Hydro
- Hulamin
- Interco Trading Company
Key Milestones in Used Beverage Cans Industry
- 2019: Increased implementation of deposit-return schemes in several European countries, boosting collection rates.
- 2020: Ball Corporation announces significant investment in can recycling infrastructure.
- 2021: Novelis achieves record levels of recycled content in its aluminum products.
- 2022: Hydro expands its recycling capabilities with new state-of-the-art facilities.
- 2023: Growing adoption of AI-powered sorting technologies to enhance aluminum purity.
- 2024: Launch of new industry initiatives focused on achieving higher recycling rates and a truly circular economy for aluminum beverage cans.
- 2025 (Base Year): Projected increase in recycled content mandates across key markets.
- 2026-2033 (Forecast Period): Expected widespread integration of advanced recycling technologies and expansion into new geographical markets.
Strategic Outlook for Used Beverage Cans Market
The strategic outlook for the Used Beverage Cans market is overwhelmingly positive, driven by the unstoppable momentum towards a circular economy and heightened environmental consciousness. Growth accelerators include further advancements in recycling technologies that improve efficiency and reduce costs, making recycled aluminum even more attractive than virgin material. The ongoing expansion of deposit-return schemes globally, coupled with stricter government regulations on recycled content, will continue to bolster collection rates and supply. Furthermore, strategic collaborations between beverage producers, can manufacturers, and recycling firms will be crucial in optimizing the entire value chain, ensuring a consistent flow of high-quality recycled aluminum. The market is poised for sustained growth, with an increasing volume of used beverage cans being rerouted back into the production of new cans, solidifying aluminum's position as a leading sustainable packaging material.
Used Beverage Cans Segmentation
-
1. Application
- 1.1. Carbonated Soft Drinks
- 1.2. Alcoholic Beverages
- 1.3. Fruit & Vegetable Juices
- 1.4. Tea
- 1.5. Others
-
2. Types
- 2.1. Three-Piece Cans
- 2.2. Two-Piece Cans
Used Beverage Cans Segmentation By Geography
-
1. North America
- 1.1. United States
- 1.2. Canada
- 1.3. Mexico
-
2. South America
- 2.1. Brazil
- 2.2. Argentina
- 2.3. Rest of South America
-
3. Europe
- 3.1. United Kingdom
- 3.2. Germany
- 3.3. France
- 3.4. Italy
- 3.5. Spain
- 3.6. Russia
- 3.7. Benelux
- 3.8. Nordics
- 3.9. Rest of Europe
-
4. Middle East & Africa
- 4.1. Turkey
- 4.2. Israel
- 4.3. GCC
- 4.4. North Africa
- 4.5. South Africa
- 4.6. Rest of Middle East & Africa
-
5. Asia Pacific
- 5.1. China
- 5.2. India
- 5.3. Japan
- 5.4. South Korea
- 5.5. ASEAN
- 5.6. Oceania
- 5.7. Rest of Asia Pacific
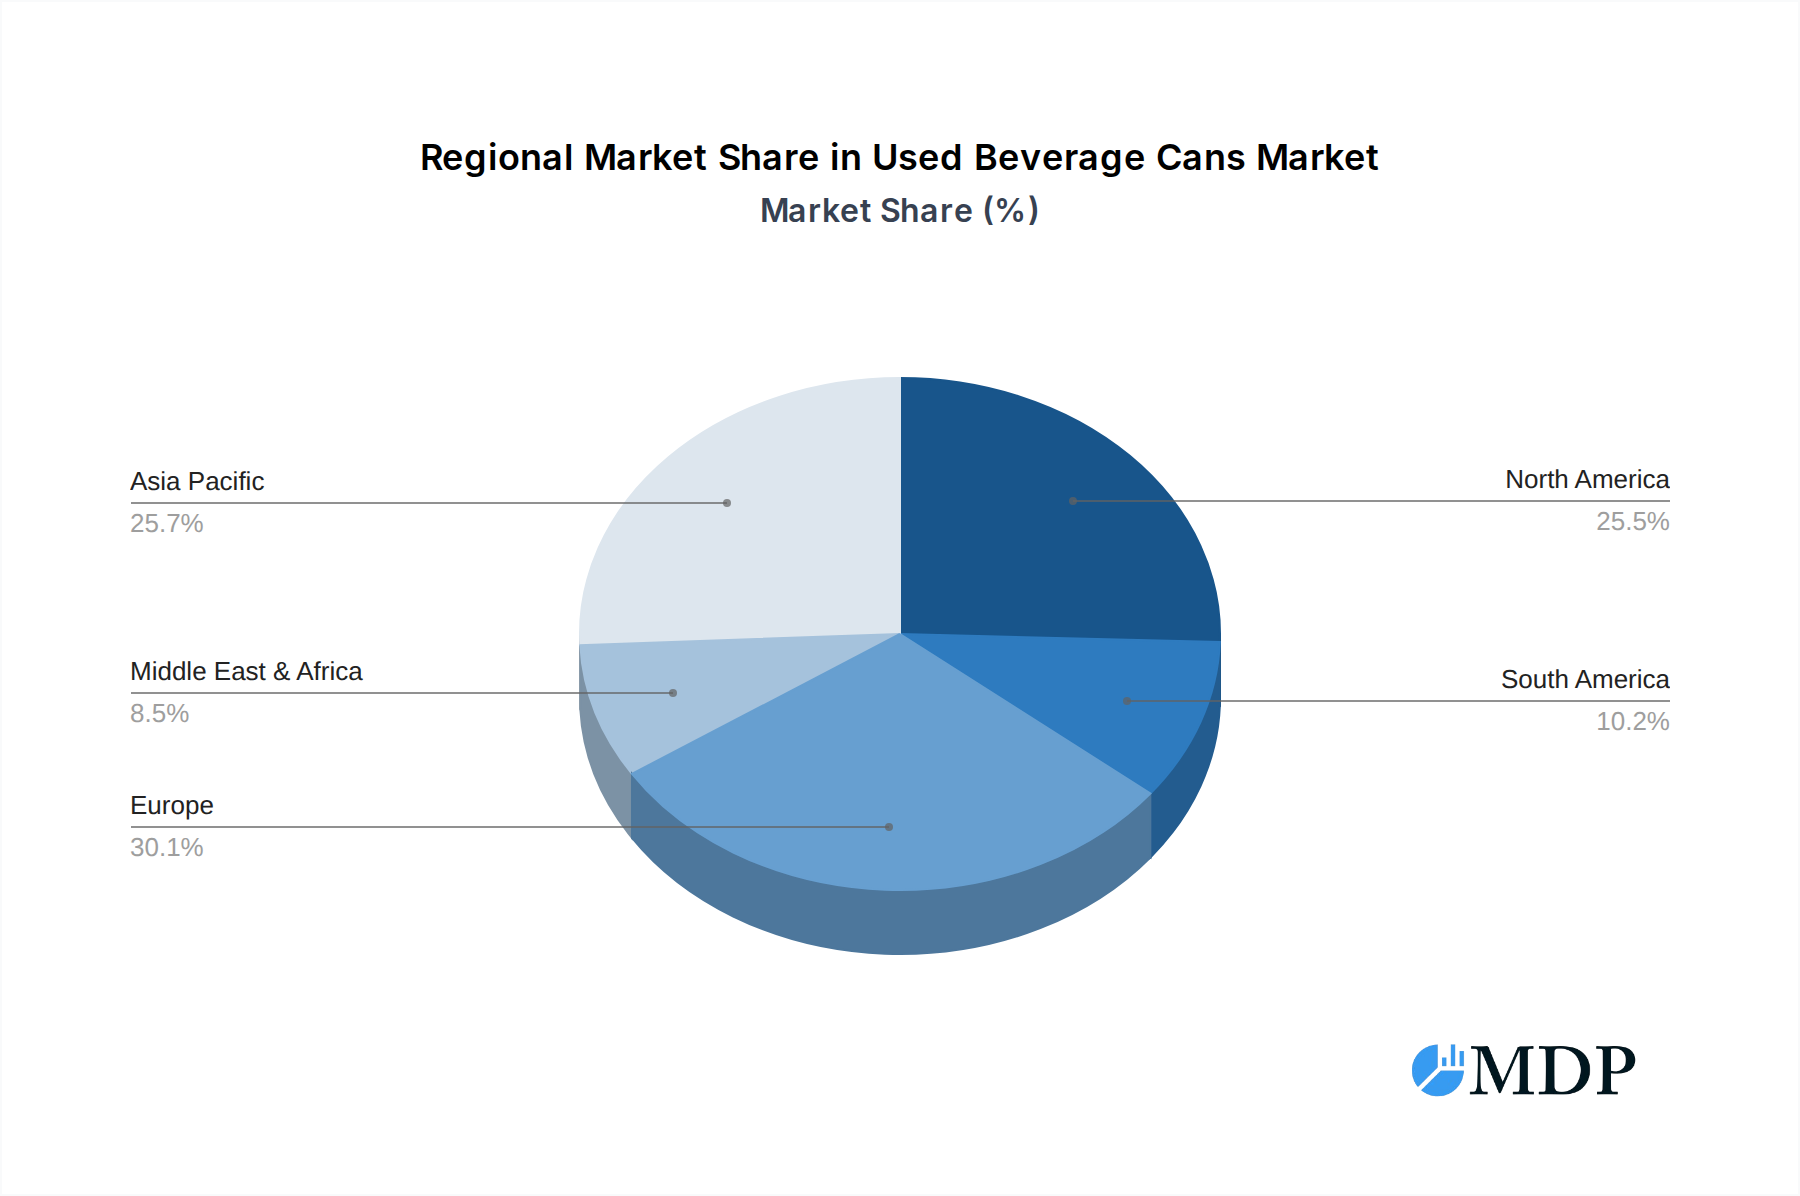
Used Beverage Cans Regional Market Share
Geographic Coverage of Used Beverage Cans
Used Beverage Cans REPORT HIGHLIGHTS
| Aspects | Details |
|---|---|
| Study Period | 2020-2034 |
| Base Year | 2025 |
| Estimated Year | 2026 |
| Forecast Period | 2026-2034 |
| Historical Period | 2020-2025 |
| Growth Rate | CAGR of 5.3% from 2020-2034 |
| Segmentation |
|
Table of Contents
- 1. Introduction
- 1.1. Research Scope
- 1.2. Market Segmentation
- 1.3. Research Methodology
- 1.4. Definitions and Assumptions
- 2. Executive Summary
- 2.1. Introduction
- 3. Market Dynamics
- 3.1. Introduction
- 3.2. Market Drivers
- 3.3. Market Restrains
- 3.4. Market Trends
- 4. Market Factor Analysis
- 4.1. Porters Five Forces
- 4.2. Supply/Value Chain
- 4.3. PESTEL analysis
- 4.4. Market Entropy
- 4.5. Patent/Trademark Analysis
- 5. Global Used Beverage Cans Analysis, Insights and Forecast, 2020-2032
- 5.1. Market Analysis, Insights and Forecast - by Application
- 5.1.1. Carbonated Soft Drinks
- 5.1.2. Alcoholic Beverages
- 5.1.3. Fruit & Vegetable Juices
- 5.1.4. Tea
- 5.1.5. Others
- 5.2. Market Analysis, Insights and Forecast - by Types
- 5.2.1. Three-Piece Cans
- 5.2.2. Two-Piece Cans
- 5.3. Market Analysis, Insights and Forecast - by Region
- 5.3.1. North America
- 5.3.2. South America
- 5.3.3. Europe
- 5.3.4. Middle East & Africa
- 5.3.5. Asia Pacific
- 5.1. Market Analysis, Insights and Forecast - by Application
- 6. North America Used Beverage Cans Analysis, Insights and Forecast, 2020-2032
- 6.1. Market Analysis, Insights and Forecast - by Application
- 6.1.1. Carbonated Soft Drinks
- 6.1.2. Alcoholic Beverages
- 6.1.3. Fruit & Vegetable Juices
- 6.1.4. Tea
- 6.1.5. Others
- 6.2. Market Analysis, Insights and Forecast - by Types
- 6.2.1. Three-Piece Cans
- 6.2.2. Two-Piece Cans
- 6.1. Market Analysis, Insights and Forecast - by Application
- 7. South America Used Beverage Cans Analysis, Insights and Forecast, 2020-2032
- 7.1. Market Analysis, Insights and Forecast - by Application
- 7.1.1. Carbonated Soft Drinks
- 7.1.2. Alcoholic Beverages
- 7.1.3. Fruit & Vegetable Juices
- 7.1.4. Tea
- 7.1.5. Others
- 7.2. Market Analysis, Insights and Forecast - by Types
- 7.2.1. Three-Piece Cans
- 7.2.2. Two-Piece Cans
- 7.1. Market Analysis, Insights and Forecast - by Application
- 8. Europe Used Beverage Cans Analysis, Insights and Forecast, 2020-2032
- 8.1. Market Analysis, Insights and Forecast - by Application
- 8.1.1. Carbonated Soft Drinks
- 8.1.2. Alcoholic Beverages
- 8.1.3. Fruit & Vegetable Juices
- 8.1.4. Tea
- 8.1.5. Others
- 8.2. Market Analysis, Insights and Forecast - by Types
- 8.2.1. Three-Piece Cans
- 8.2.2. Two-Piece Cans
- 8.1. Market Analysis, Insights and Forecast - by Application
- 9. Middle East & Africa Used Beverage Cans Analysis, Insights and Forecast, 2020-2032
- 9.1. Market Analysis, Insights and Forecast - by Application
- 9.1.1. Carbonated Soft Drinks
- 9.1.2. Alcoholic Beverages
- 9.1.3. Fruit & Vegetable Juices
- 9.1.4. Tea
- 9.1.5. Others
- 9.2. Market Analysis, Insights and Forecast - by Types
- 9.2.1. Three-Piece Cans
- 9.2.2. Two-Piece Cans
- 9.1. Market Analysis, Insights and Forecast - by Application
- 10. Asia Pacific Used Beverage Cans Analysis, Insights and Forecast, 2020-2032
- 10.1. Market Analysis, Insights and Forecast - by Application
- 10.1.1. Carbonated Soft Drinks
- 10.1.2. Alcoholic Beverages
- 10.1.3. Fruit & Vegetable Juices
- 10.1.4. Tea
- 10.1.5. Others
- 10.2. Market Analysis, Insights and Forecast - by Types
- 10.2.1. Three-Piece Cans
- 10.2.2. Two-Piece Cans
- 10.1. Market Analysis, Insights and Forecast - by Application
- 11. Competitive Analysis
- 11.1. Global Market Share Analysis 2025
- 11.2. Company Profiles
- 11.2.1 Interco Trading Company
- 11.2.1.1. Overview
- 11.2.1.2. Products
- 11.2.1.3. SWOT Analysis
- 11.2.1.4. Recent Developments
- 11.2.1.5. Financials (Based on Availability)
- 11.2.2 Novelis
- 11.2.2.1. Overview
- 11.2.2.2. Products
- 11.2.2.3. SWOT Analysis
- 11.2.2.4. Recent Developments
- 11.2.2.5. Financials (Based on Availability)
- 11.2.3 Ball Corporation
- 11.2.3.1. Overview
- 11.2.3.2. Products
- 11.2.3.3. SWOT Analysis
- 11.2.3.4. Recent Developments
- 11.2.3.5. Financials (Based on Availability)
- 11.2.4 Interco Trading Company
- 11.2.4.1. Overview
- 11.2.4.2. Products
- 11.2.4.3. SWOT Analysis
- 11.2.4.4. Recent Developments
- 11.2.4.5. Financials (Based on Availability)
- 11.2.5 Hydro
- 11.2.5.1. Overview
- 11.2.5.2. Products
- 11.2.5.3. SWOT Analysis
- 11.2.5.4. Recent Developments
- 11.2.5.5. Financials (Based on Availability)
- 11.2.6 Hulamin
- 11.2.6.1. Overview
- 11.2.6.2. Products
- 11.2.6.3. SWOT Analysis
- 11.2.6.4. Recent Developments
- 11.2.6.5. Financials (Based on Availability)
- 11.2.1 Interco Trading Company
List of Figures
- Figure 1: Global Used Beverage Cans Revenue Breakdown (undefined, %) by Region 2025 & 2033
- Figure 2: North America Used Beverage Cans Revenue (undefined), by Application 2025 & 2033
- Figure 3: North America Used Beverage Cans Revenue Share (%), by Application 2025 & 2033
- Figure 4: North America Used Beverage Cans Revenue (undefined), by Types 2025 & 2033
- Figure 5: North America Used Beverage Cans Revenue Share (%), by Types 2025 & 2033
- Figure 6: North America Used Beverage Cans Revenue (undefined), by Country 2025 & 2033
- Figure 7: North America Used Beverage Cans Revenue Share (%), by Country 2025 & 2033
- Figure 8: South America Used Beverage Cans Revenue (undefined), by Application 2025 & 2033
- Figure 9: South America Used Beverage Cans Revenue Share (%), by Application 2025 & 2033
- Figure 10: South America Used Beverage Cans Revenue (undefined), by Types 2025 & 2033
- Figure 11: South America Used Beverage Cans Revenue Share (%), by Types 2025 & 2033
- Figure 12: South America Used Beverage Cans Revenue (undefined), by Country 2025 & 2033
- Figure 13: South America Used Beverage Cans Revenue Share (%), by Country 2025 & 2033
- Figure 14: Europe Used Beverage Cans Revenue (undefined), by Application 2025 & 2033
- Figure 15: Europe Used Beverage Cans Revenue Share (%), by Application 2025 & 2033
- Figure 16: Europe Used Beverage Cans Revenue (undefined), by Types 2025 & 2033
- Figure 17: Europe Used Beverage Cans Revenue Share (%), by Types 2025 & 2033
- Figure 18: Europe Used Beverage Cans Revenue (undefined), by Country 2025 & 2033
- Figure 19: Europe Used Beverage Cans Revenue Share (%), by Country 2025 & 2033
- Figure 20: Middle East & Africa Used Beverage Cans Revenue (undefined), by Application 2025 & 2033
- Figure 21: Middle East & Africa Used Beverage Cans Revenue Share (%), by Application 2025 & 2033
- Figure 22: Middle East & Africa Used Beverage Cans Revenue (undefined), by Types 2025 & 2033
- Figure 23: Middle East & Africa Used Beverage Cans Revenue Share (%), by Types 2025 & 2033
- Figure 24: Middle East & Africa Used Beverage Cans Revenue (undefined), by Country 2025 & 2033
- Figure 25: Middle East & Africa Used Beverage Cans Revenue Share (%), by Country 2025 & 2033
- Figure 26: Asia Pacific Used Beverage Cans Revenue (undefined), by Application 2025 & 2033
- Figure 27: Asia Pacific Used Beverage Cans Revenue Share (%), by Application 2025 & 2033
- Figure 28: Asia Pacific Used Beverage Cans Revenue (undefined), by Types 2025 & 2033
- Figure 29: Asia Pacific Used Beverage Cans Revenue Share (%), by Types 2025 & 2033
- Figure 30: Asia Pacific Used Beverage Cans Revenue (undefined), by Country 2025 & 2033
- Figure 31: Asia Pacific Used Beverage Cans Revenue Share (%), by Country 2025 & 2033
List of Tables
- Table 1: Global Used Beverage Cans Revenue undefined Forecast, by Application 2020 & 2033
- Table 2: Global Used Beverage Cans Revenue undefined Forecast, by Types 2020 & 2033
- Table 3: Global Used Beverage Cans Revenue undefined Forecast, by Region 2020 & 2033
- Table 4: Global Used Beverage Cans Revenue undefined Forecast, by Application 2020 & 2033
- Table 5: Global Used Beverage Cans Revenue undefined Forecast, by Types 2020 & 2033
- Table 6: Global Used Beverage Cans Revenue undefined Forecast, by Country 2020 & 2033
- Table 7: United States Used Beverage Cans Revenue (undefined) Forecast, by Application 2020 & 2033
- Table 8: Canada Used Beverage Cans Revenue (undefined) Forecast, by Application 2020 & 2033
- Table 9: Mexico Used Beverage Cans Revenue (undefined) Forecast, by Application 2020 & 2033
- Table 10: Global Used Beverage Cans Revenue undefined Forecast, by Application 2020 & 2033
- Table 11: Global Used Beverage Cans Revenue undefined Forecast, by Types 2020 & 2033
- Table 12: Global Used Beverage Cans Revenue undefined Forecast, by Country 2020 & 2033
- Table 13: Brazil Used Beverage Cans Revenue (undefined) Forecast, by Application 2020 & 2033
- Table 14: Argentina Used Beverage Cans Revenue (undefined) Forecast, by Application 2020 & 2033
- Table 15: Rest of South America Used Beverage Cans Revenue (undefined) Forecast, by Application 2020 & 2033
- Table 16: Global Used Beverage Cans Revenue undefined Forecast, by Application 2020 & 2033
- Table 17: Global Used Beverage Cans Revenue undefined Forecast, by Types 2020 & 2033
- Table 18: Global Used Beverage Cans Revenue undefined Forecast, by Country 2020 & 2033
- Table 19: United Kingdom Used Beverage Cans Revenue (undefined) Forecast, by Application 2020 & 2033
- Table 20: Germany Used Beverage Cans Revenue (undefined) Forecast, by Application 2020 & 2033
- Table 21: France Used Beverage Cans Revenue (undefined) Forecast, by Application 2020 & 2033
- Table 22: Italy Used Beverage Cans Revenue (undefined) Forecast, by Application 2020 & 2033
- Table 23: Spain Used Beverage Cans Revenue (undefined) Forecast, by Application 2020 & 2033
- Table 24: Russia Used Beverage Cans Revenue (undefined) Forecast, by Application 2020 & 2033
- Table 25: Benelux Used Beverage Cans Revenue (undefined) Forecast, by Application 2020 & 2033
- Table 26: Nordics Used Beverage Cans Revenue (undefined) Forecast, by Application 2020 & 2033
- Table 27: Rest of Europe Used Beverage Cans Revenue (undefined) Forecast, by Application 2020 & 2033
- Table 28: Global Used Beverage Cans Revenue undefined Forecast, by Application 2020 & 2033
- Table 29: Global Used Beverage Cans Revenue undefined Forecast, by Types 2020 & 2033
- Table 30: Global Used Beverage Cans Revenue undefined Forecast, by Country 2020 & 2033
- Table 31: Turkey Used Beverage Cans Revenue (undefined) Forecast, by Application 2020 & 2033
- Table 32: Israel Used Beverage Cans Revenue (undefined) Forecast, by Application 2020 & 2033
- Table 33: GCC Used Beverage Cans Revenue (undefined) Forecast, by Application 2020 & 2033
- Table 34: North Africa Used Beverage Cans Revenue (undefined) Forecast, by Application 2020 & 2033
- Table 35: South Africa Used Beverage Cans Revenue (undefined) Forecast, by Application 2020 & 2033
- Table 36: Rest of Middle East & Africa Used Beverage Cans Revenue (undefined) Forecast, by Application 2020 & 2033
- Table 37: Global Used Beverage Cans Revenue undefined Forecast, by Application 2020 & 2033
- Table 38: Global Used Beverage Cans Revenue undefined Forecast, by Types 2020 & 2033
- Table 39: Global Used Beverage Cans Revenue undefined Forecast, by Country 2020 & 2033
- Table 40: China Used Beverage Cans Revenue (undefined) Forecast, by Application 2020 & 2033
- Table 41: India Used Beverage Cans Revenue (undefined) Forecast, by Application 2020 & 2033
- Table 42: Japan Used Beverage Cans Revenue (undefined) Forecast, by Application 2020 & 2033
- Table 43: South Korea Used Beverage Cans Revenue (undefined) Forecast, by Application 2020 & 2033
- Table 44: ASEAN Used Beverage Cans Revenue (undefined) Forecast, by Application 2020 & 2033
- Table 45: Oceania Used Beverage Cans Revenue (undefined) Forecast, by Application 2020 & 2033
- Table 46: Rest of Asia Pacific Used Beverage Cans Revenue (undefined) Forecast, by Application 2020 & 2033
Frequently Asked Questions
1. What is the projected Compound Annual Growth Rate (CAGR) of the Used Beverage Cans?
The projected CAGR is approximately 5.3%.
2. Which companies are prominent players in the Used Beverage Cans?
Key companies in the market include Interco Trading Company, Novelis, Ball Corporation, Interco Trading Company, Hydro, Hulamin.
3. What are the main segments of the Used Beverage Cans?
The market segments include Application, Types.
4. Can you provide details about the market size?
The market size is estimated to be USD XXX N/A as of 2022.
5. What are some drivers contributing to market growth?
N/A
6. What are the notable trends driving market growth?
N/A
7. Are there any restraints impacting market growth?
N/A
8. Can you provide examples of recent developments in the market?
N/A
9. What pricing options are available for accessing the report?
Pricing options include single-user, multi-user, and enterprise licenses priced at USD 4900.00, USD 7350.00, and USD 9800.00 respectively.
10. Is the market size provided in terms of value or volume?
The market size is provided in terms of value, measured in N/A.
11. Are there any specific market keywords associated with the report?
Yes, the market keyword associated with the report is "Used Beverage Cans," which aids in identifying and referencing the specific market segment covered.
12. How do I determine which pricing option suits my needs best?
The pricing options vary based on user requirements and access needs. Individual users may opt for single-user licenses, while businesses requiring broader access may choose multi-user or enterprise licenses for cost-effective access to the report.
13. Are there any additional resources or data provided in the Used Beverage Cans report?
While the report offers comprehensive insights, it's advisable to review the specific contents or supplementary materials provided to ascertain if additional resources or data are available.
14. How can I stay updated on further developments or reports in the Used Beverage Cans?
To stay informed about further developments, trends, and reports in the Used Beverage Cans, consider subscribing to industry newsletters, following relevant companies and organizations, or regularly checking reputable industry news sources and publications.
Methodology
Step 1 - Identification of Relevant Samples Size from Population Database


Step 2 - Approaches for Defining Global Market Size (Value, Volume* & Price*)

Note*: In applicable scenarios
Step 3 - Data Sources
Primary Research
- Web Analytics
- Survey Reports
- Research Institute
- Latest Research Reports
- Opinion Leaders
Secondary Research
- Annual Reports
- White Paper
- Latest Press Release
- Industry Association
- Paid Database
- Investor Presentations

Step 4 - Data Triangulation
Involves using different sources of information in order to increase the validity of a study
These sources are likely to be stakeholders in a program - participants, other researchers, program staff, other community members, and so on.
Then we put all data in single framework & apply various statistical tools to find out the dynamic on the market.
During the analysis stage, feedback from the stakeholder groups would be compared to determine areas of agreement as well as areas of divergence