

Key Insights
The Unmanned Sea Systems (USS) industry, encompassing Unmanned Underwater Vehicles (UUVs), Unmanned Surface Vehicles (USVs), and diverse capabilities like remotely operated and autonomous vehicles, is experiencing robust growth. Driven by increasing military spending on autonomous systems for surveillance, mine countermeasures, and anti-submarine warfare, coupled with rising commercial demand for oceanographic research, offshore energy exploration, and infrastructure inspection, the market is projected to expand significantly. The market's segmentation by application (military, commercial, and other) reflects this diverse demand. Technological advancements, particularly in AI-powered autonomy, improved sensor integration, and enhanced communication capabilities, are fueling this expansion. The adoption of hybrid propulsion systems and improved battery technologies are extending operational endurance, making UUVs and USVs increasingly versatile and cost-effective. Furthermore, the ongoing development of swarm technologies allows for coordinated operations of multiple unmanned vehicles, enhancing their overall effectiveness and situational awareness.
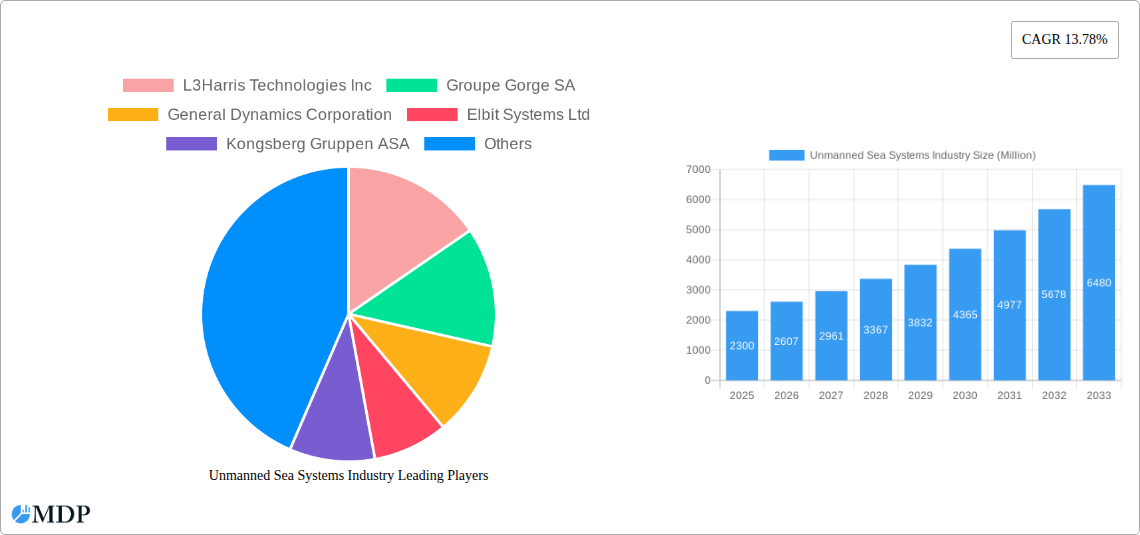
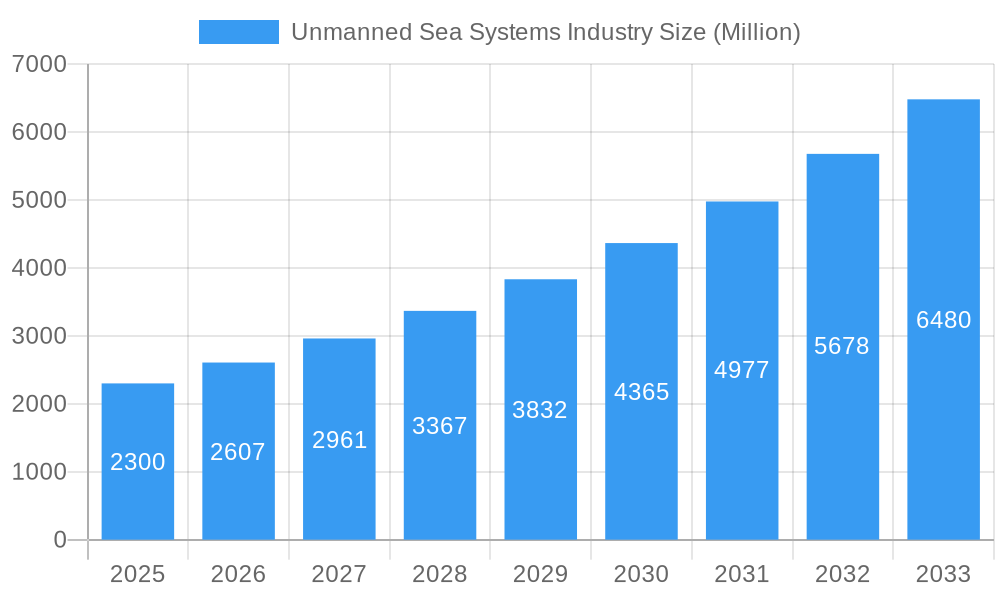
Unmanned Sea Systems Industry Market Size (In Billion)
However, the growth of the USS market faces some restraints. High initial investment costs for the development and deployment of these sophisticated systems can be a barrier to entry for smaller companies. Regulatory complexities surrounding the operation of autonomous vehicles in international waters also present challenges. Furthermore, ensuring robust cybersecurity measures to protect against malicious attacks and data breaches is crucial for the long-term sustainability of the industry. The competition amongst established defense contractors and emerging technology companies remains intense, creating a dynamic landscape shaped by technological innovation and strategic partnerships. Despite these challenges, the long-term outlook for the USS market remains positive, with a projected continued expansion throughout the forecast period due to its strategic importance across multiple sectors.
Unmanned Sea Systems Industry Company Market Share
Unmanned Sea Systems Industry: A Comprehensive Market Report (2019-2033)
This in-depth report provides a comprehensive analysis of the Unmanned Sea Systems (USS) industry, offering crucial insights for stakeholders navigating this rapidly evolving market. The study period spans 2019-2033, with a base year of 2025 and a forecast period of 2025-2033. Valuations are expressed in millions of USD. This report is essential for strategic decision-making, investment planning, and understanding the future trajectory of this dynamic sector. The market is projected to reach xx Million by 2033, exhibiting a robust CAGR of xx%.
Unmanned Sea Systems Industry Market Dynamics & Concentration
The Unmanned Sea Systems (USS) market is currently characterized by a moderately consolidated competitive landscape, with a few dominant players commanding a significant portion of the market share. However, this dynamic is evolving rapidly with the emergence of agile technology innovators and the escalating adoption of USS across a widening array of applications. Industry analysis indicates that the top five companies collectively hold approximately 40% of the market share, with the remainder distributed among a multitude of smaller enterprises and burgeoning startups. The primary engine driving market growth is relentless innovation, spurred by breakthroughs in autonomy, artificial intelligence (AI), and advanced sensor technologies. Navigating the market also necessitates adherence to stringent regulatory frameworks, particularly concerning operational safety, data security, and environmental impact. While traditional manned vessels remain a significant presence, they are increasingly facing robust competition from the cost-effectiveness, adaptability, and enhanced operational efficiency offered by USS. The sector has witnessed substantial Merger & Acquisition (M&A) activity, with an estimated XX M&A deals occurring between 2019 and 2024. This trend underscores the strategic imperative for established entities to integrate cutting-edge technologies and expand their market footprint.
- Market Concentration: The top five key players collectively control approximately 40% of the global market share, indicating a degree of consolidation.
- Innovation Drivers: Continued advancements in AI, sophisticated autonomy, and next-generation sensor suites are pivotal to market expansion and the development of novel capabilities.
- Regulatory Frameworks: Evolving and stringent regulations pertaining to safety, data privacy, and operational standards are crucial influencing factors for market entrants and established players alike.
- Product Substitutes: Traditional manned maritime systems continue to be the primary substitute, though USS are increasingly demonstrating superior cost-efficiency and operational advantages.
- End-User Trends: There is a pronounced and growing trend of USS adoption across a broad spectrum of applications, encompassing defense, commercial maritime operations, scientific research, and environmental monitoring.
- M&A Activity: The period from 2019 to 2024 saw an estimated XX significant Merger & Acquisition deals, reflecting strategic consolidation and the pursuit of technological advancement.
Unmanned Sea Systems Industry Industry Trends & Analysis
The Unmanned Sea Systems industry is experiencing exponential growth, driven by several key factors. The increasing demand for maritime surveillance, offshore operations, and underwater exploration is significantly boosting the adoption of USS. Technological advancements, such as the development of more robust and reliable autonomous systems, are expanding the capabilities and applications of these systems. Consumer preferences are shifting towards cost-effective and efficient solutions, making USS an attractive alternative to traditional methods. Competitive dynamics are marked by fierce innovation and strategic partnerships, as companies strive to maintain a leading edge in this rapidly evolving landscape. The market is projected to experience significant growth in the forecast period (2025-2033), with certain segments exhibiting even higher CAGRs. For instance, the Autonomous Vehicle segment is expected to show a CAGR of xx%, driven by continuous technological breakthroughs and increased acceptance across diverse sectors. Market penetration is steadily increasing, especially in the military and commercial sectors, projected to reach xx% by 2033.
Leading Markets & Segments in Unmanned Sea Systems Industry
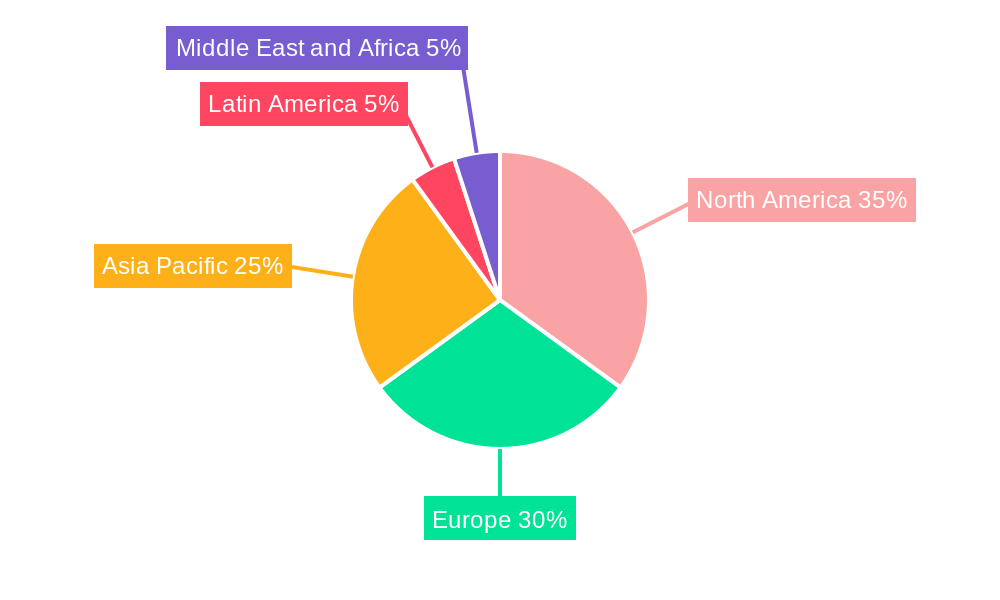
North America currently spearheads the Unmanned Sea Systems market, largely propelled by substantial government investment, robust defense spending, and a mature technological ecosystem. Concurrently, the Asia-Pacific region is emerging as a high-growth market, fueled by escalating investments in maritime infrastructure and enhanced security initiatives. Within the USS market segmentation:
- Type: Unmanned Underwater Vehicles (UUVs) continue to lead in terms of revenue generation, predominantly driven by their critical roles in defense applications. Unmanned Surface Vehicles (USVs) are experiencing a significant surge in adoption for a variety of commercial purposes.
- Capability: The demand for autonomous USS is experiencing exponential growth, a trend directly attributable to breakthroughs in AI and machine learning algorithms, outpacing the expansion of remotely operated vehicles (ROVs).
- Application: The Military segment remains the largest contributor to market share, while the Commercial sector exhibits immense growth potential. Other vital applications, including scientific exploration and environmental monitoring, are also playing an increasingly important role in overall market expansion.
Key Regional Drivers:
- North America: Characterized by substantial government expenditure (defense and research), advanced technological infrastructure, and well-established supply chains.
- Asia-Pacific: Experiencing growth due to significant infrastructure development, heightened maritime security concerns, and robust economic expansion.
- Europe: Demonstrates strong momentum driven by considerable government investment in defense modernization and strategic research and development initiatives.
Unmanned Sea Systems Industry Product Developments
Recent product innovations focus on enhancing autonomy, increasing operational range, and improving sensor integration. The development of hybrid systems combining ROV and AUV capabilities provides flexibility and enhanced operational efficiency. Miniaturization and cost reduction efforts are broadening the applications of USS, opening up new market segments. The integration of advanced AI and machine learning algorithms allows for improved decision-making and enhanced situational awareness. These developments are addressing crucial aspects like endurance, payload capacity, and data processing, significantly improving market fit and competitive advantages.
Key Drivers of Unmanned Sea Systems Industry Growth
Technological advancements in autonomy, AI, and sensor technologies are paramount, enabling the development of more sophisticated and capable systems. Increasing government spending on defense and maritime security is a crucial economic driver, particularly in North America and the Asia-Pacific regions. Furthermore, favorable regulatory frameworks supporting innovation and technological adoption accelerate market expansion. The growing demand for efficient and cost-effective solutions across various sectors, including offshore energy, environmental monitoring, and scientific research, significantly contributes to market growth.
Challenges in the Unmanned Sea Systems Industry Market
Regulatory hurdles, particularly concerning safety, operational procedures, and data security, pose challenges to market expansion. Supply chain disruptions and the complexities of maintaining the reliable supply of specialized components can affect production and timely delivery. Intense competitive pressures among established players and emerging companies necessitate continuous innovation and strategic adaptation. These challenges, if not effectively managed, can hinder the overall growth of the industry.
Emerging Opportunities in Unmanned Sea Systems Industry
The Unmanned Sea Systems industry is ripe with emerging opportunities, driven by continuous technological advancements. Key areas of innovation include enhanced underwater communication systems, extended battery life for prolonged missions, and the development of more sophisticated and multi-functional sensor technologies. Strategic collaborations between leading technology providers, system integrators, and diverse end-users are instrumental in fostering the creation of novel and effective solutions. The expansion into new and niche market segments, such as comprehensive underwater infrastructure inspection and advanced oceanographic research, presents substantial avenues for future growth. The widespread adoption of USS across various sectors is poised to catalyze significant market expansion and drive substantial improvements in operational efficiency and data acquisition capabilities.
Leading Players in the Unmanned Sea Systems Industry Sector
Key Milestones in Unmanned Sea Systems Industry Industry
- September 2023: HII received a USD 19 million contract (USD 347 million ceiling) from the US Navy for REMUS 300 deliveries through 2028.
- October 2023: Lockheed Martin Corporation secured an USD 11 million contract for Extra Large Unmanned Undersea Vehicle (UUV) engineering support.
These contracts highlight the increasing investment in UUV technology and the growing demand for advanced unmanned sea systems within the defense sector.
Strategic Outlook for Unmanned Sea Systems Industry Market
The trajectory for the Unmanned Sea Systems market is exceptionally promising, marked by significant growth potential fueled by ongoing technological advancements, increasing integration across diverse industries, and the development of supportive regulatory frameworks. Strategic alliances and targeted acquisitions are anticipated to continue shaping the industry's competitive dynamics. Companies that prioritize the development of advanced autonomy features, seamless sensor integration, and enhanced operational capabilities will be exceptionally well-positioned to capitalize on this expanding market. The long-term outlook consistently points towards sustained and robust expansion for the Unmanned Sea Systems industry, promising further innovation and broader application.
Unmanned Sea Systems Industry Segmentation
- 1. Production Analysis
- 2. Consumption Analysis
- 3. Import Market Analysis (Value & Volume)
- 4. Export Market Analysis (Value & Volume)
- 5. Price Trend Analysis
Unmanned Sea Systems Industry Segmentation By Geography
-
1. North America
- 1.1. United States
- 1.2. Canada
- 1.3. Mexico
-
2. South America
- 2.1. Brazil
- 2.2. Argentina
- 2.3. Rest of South America
-
3. Europe
- 3.1. United Kingdom
- 3.2. Germany
- 3.3. France
- 3.4. Italy
- 3.5. Spain
- 3.6. Russia
- 3.7. Benelux
- 3.8. Nordics
- 3.9. Rest of Europe
-
4. Middle East & Africa
- 4.1. Turkey
- 4.2. Israel
- 4.3. GCC
- 4.4. North Africa
- 4.5. South Africa
- 4.6. Rest of Middle East & Africa
-
5. Asia Pacific
- 5.1. China
- 5.2. India
- 5.3. Japan
- 5.4. South Korea
- 5.5. ASEAN
- 5.6. Oceania
- 5.7. Rest of Asia Pacific
Unmanned Sea Systems Industry Regional Market Share
Geographic Coverage of Unmanned Sea Systems Industry
Unmanned Sea Systems Industry REPORT HIGHLIGHTS
| Aspects | Details |
|---|---|
| Study Period | 2020-2034 |
| Base Year | 2025 |
| Estimated Year | 2026 |
| Forecast Period | 2026-2034 |
| Historical Period | 2020-2025 |
| Growth Rate | CAGR of 13.78% from 2020-2034 |
| Segmentation |
|
Table of Contents
- 1. Introduction
- 1.1. Research Scope
- 1.2. Market Segmentation
- 1.3. Research Objective
- 1.4. Definitions and Assumptions
- 2. Executive Summary
- 2.1. Market Snapshot
- 3. Market Dynamics
- 3.1. Market Drivers
- 3.2. Market Restrains
- 3.3. Market Trends
- 3.4. Market Opportunities
- 4. Market Factor Analysis
- 4.1. Porters Five Forces
- 4.1.1. Bargaining Power of Suppliers
- 4.1.2. Bargaining Power of Buyers
- 4.1.3. Threat of New Entrants
- 4.1.4. Threat of Substitutes
- 4.1.5. Competitive Rivalry
- 4.2. PESTEL analysis
- 4.3. BCG Analysis
- 4.3.1. Stars (High Growth, High Market Share)
- 4.3.2. Cash Cows (Low Growth, High Market Share)
- 4.3.3. Question Mark (High Growth, Low Market Share)
- 4.3.4. Dogs (Low Growth, Low Market Share)
- 4.4. Ansoff Matrix Analysis
- 4.5. Supply Chain Analysis
- 4.6. Regulatory Landscape
- 4.7. Current Market Potential and Opportunity Assessment (TAM–SAM–SOM Framework)
- 4.8. MDP Analyst Note
- 4.1. Porters Five Forces
- 5. Market Analysis, Insights and Forecast 2021-2033
- 5.1. Market Analysis, Insights and Forecast - by Production Analysis
- 5.2. Market Analysis, Insights and Forecast - by Consumption Analysis
- 5.3. Market Analysis, Insights and Forecast - by Import Market Analysis (Value & Volume)
- 5.4. Market Analysis, Insights and Forecast - by Export Market Analysis (Value & Volume)
- 5.5. Market Analysis, Insights and Forecast - by Price Trend Analysis
- 5.6. Market Analysis, Insights and Forecast - by Region
- 5.6.1. North America
- 5.6.2. South America
- 5.6.3. Europe
- 5.6.4. Middle East & Africa
- 5.6.5. Asia Pacific
- 6. Global Unmanned Sea Systems Industry Analysis, Insights and Forecast, 2021-2033
- 6.1. Market Analysis, Insights and Forecast - by Production Analysis
- 6.2. Market Analysis, Insights and Forecast - by Consumption Analysis
- 6.3. Market Analysis, Insights and Forecast - by Import Market Analysis (Value & Volume)
- 6.4. Market Analysis, Insights and Forecast - by Export Market Analysis (Value & Volume)
- 6.5. Market Analysis, Insights and Forecast - by Price Trend Analysis
- 7. North America Unmanned Sea Systems Industry Analysis, Insights and Forecast, 2020-2032
- 7.1. Market Analysis, Insights and Forecast - by Production Analysis
- 7.2. Market Analysis, Insights and Forecast - by Consumption Analysis
- 7.3. Market Analysis, Insights and Forecast - by Import Market Analysis (Value & Volume)
- 7.4. Market Analysis, Insights and Forecast - by Export Market Analysis (Value & Volume)
- 7.5. Market Analysis, Insights and Forecast - by Price Trend Analysis
- 8. South America Unmanned Sea Systems Industry Analysis, Insights and Forecast, 2020-2032
- 8.1. Market Analysis, Insights and Forecast - by Production Analysis
- 8.2. Market Analysis, Insights and Forecast - by Consumption Analysis
- 8.3. Market Analysis, Insights and Forecast - by Import Market Analysis (Value & Volume)
- 8.4. Market Analysis, Insights and Forecast - by Export Market Analysis (Value & Volume)
- 8.5. Market Analysis, Insights and Forecast - by Price Trend Analysis
- 9. Europe Unmanned Sea Systems Industry Analysis, Insights and Forecast, 2020-2032
- 9.1. Market Analysis, Insights and Forecast - by Production Analysis
- 9.2. Market Analysis, Insights and Forecast - by Consumption Analysis
- 9.3. Market Analysis, Insights and Forecast - by Import Market Analysis (Value & Volume)
- 9.4. Market Analysis, Insights and Forecast - by Export Market Analysis (Value & Volume)
- 9.5. Market Analysis, Insights and Forecast - by Price Trend Analysis
- 10. Middle East & Africa Unmanned Sea Systems Industry Analysis, Insights and Forecast, 2020-2032
- 10.1. Market Analysis, Insights and Forecast - by Production Analysis
- 10.2. Market Analysis, Insights and Forecast - by Consumption Analysis
- 10.3. Market Analysis, Insights and Forecast - by Import Market Analysis (Value & Volume)
- 10.4. Market Analysis, Insights and Forecast - by Export Market Analysis (Value & Volume)
- 10.5. Market Analysis, Insights and Forecast - by Price Trend Analysis
- 11. Asia Pacific Unmanned Sea Systems Industry Analysis, Insights and Forecast, 2020-2032
- 11.1. Market Analysis, Insights and Forecast - by Production Analysis
- 11.2. Market Analysis, Insights and Forecast - by Consumption Analysis
- 11.3. Market Analysis, Insights and Forecast - by Import Market Analysis (Value & Volume)
- 11.4. Market Analysis, Insights and Forecast - by Export Market Analysis (Value & Volume)
- 11.5. Market Analysis, Insights and Forecast - by Price Trend Analysis
- 12. Competitive Analysis
- 12.1. Company Profiles
- 12.1.1 L3Harris Technologies Inc
- 12.1.1.1. Company Overview
- 12.1.1.2. Products
- 12.1.1.3. Company Financials
- 12.1.1.4. SWOT Analysis
- 12.1.2 Groupe Gorge SA
- 12.1.2.1. Company Overview
- 12.1.2.2. Products
- 12.1.2.3. Company Financials
- 12.1.2.4. SWOT Analysis
- 12.1.3 General Dynamics Corporation
- 12.1.3.1. Company Overview
- 12.1.3.2. Products
- 12.1.3.3. Company Financials
- 12.1.3.4. SWOT Analysis
- 12.1.4 Elbit Systems Ltd
- 12.1.4.1. Company Overview
- 12.1.4.2. Products
- 12.1.4.3. Company Financials
- 12.1.4.4. SWOT Analysis
- 12.1.5 Kongsberg Gruppen ASA
- 12.1.5.1. Company Overview
- 12.1.5.2. Products
- 12.1.5.3. Company Financials
- 12.1.5.4. SWOT Analysis
- 12.1.6 Lockheed Martin Corporation
- 12.1.6.1. Company Overview
- 12.1.6.2. Products
- 12.1.6.3. Company Financials
- 12.1.6.4. SWOT Analysis
- 12.1.7 Maritime Robotics AS
- 12.1.7.1. Company Overview
- 12.1.7.2. Products
- 12.1.7.3. Company Financials
- 12.1.7.4. SWOT Analysis
- 12.1.8 Teledyne Technologies Incorporated
- 12.1.8.1. Company Overview
- 12.1.8.2. Products
- 12.1.8.3. Company Financials
- 12.1.8.4. SWOT Analysis
- 12.1.9 thyssenkrupp AG
- 12.1.9.1. Company Overview
- 12.1.9.2. Products
- 12.1.9.3. Company Financials
- 12.1.9.4. SWOT Analysis
- 12.1.10 BAE Systems plc
- 12.1.10.1. Company Overview
- 12.1.10.2. Products
- 12.1.10.3. Company Financials
- 12.1.10.4. SWOT Analysis
- 12.1.11 Saab AB
- 12.1.11.1. Company Overview
- 12.1.11.2. Products
- 12.1.11.3. Company Financials
- 12.1.11.4. SWOT Analysis
- 12.1.12 The Boeing Company
- 12.1.12.1. Company Overview
- 12.1.12.2. Products
- 12.1.12.3. Company Financials
- 12.1.12.4. SWOT Analysis
- 12.1.1 L3Harris Technologies Inc
- 12.2. Market Entropy
- 12.2.1 Company's Key Areas Served
- 12.2.2 Recent Developments
- 12.3. Company Market Share Analysis 2025
- 12.3.1 Top 5 Companies Market Share Analysis
- 12.3.2 Top 3 Companies Market Share Analysis
- 12.4. List of Potential Customers
- 13. Research Methodology
List of Figures
- Figure 1: Global Unmanned Sea Systems Industry Revenue Breakdown (Million, %) by Region 2025 & 2033
- Figure 2: North America Unmanned Sea Systems Industry Revenue (Million), by Production Analysis 2025 & 2033
- Figure 3: North America Unmanned Sea Systems Industry Revenue Share (%), by Production Analysis 2025 & 2033
- Figure 4: North America Unmanned Sea Systems Industry Revenue (Million), by Consumption Analysis 2025 & 2033
- Figure 5: North America Unmanned Sea Systems Industry Revenue Share (%), by Consumption Analysis 2025 & 2033
- Figure 6: North America Unmanned Sea Systems Industry Revenue (Million), by Import Market Analysis (Value & Volume) 2025 & 2033
- Figure 7: North America Unmanned Sea Systems Industry Revenue Share (%), by Import Market Analysis (Value & Volume) 2025 & 2033
- Figure 8: North America Unmanned Sea Systems Industry Revenue (Million), by Export Market Analysis (Value & Volume) 2025 & 2033
- Figure 9: North America Unmanned Sea Systems Industry Revenue Share (%), by Export Market Analysis (Value & Volume) 2025 & 2033
- Figure 10: North America Unmanned Sea Systems Industry Revenue (Million), by Price Trend Analysis 2025 & 2033
- Figure 11: North America Unmanned Sea Systems Industry Revenue Share (%), by Price Trend Analysis 2025 & 2033
- Figure 12: North America Unmanned Sea Systems Industry Revenue (Million), by Country 2025 & 2033
- Figure 13: North America Unmanned Sea Systems Industry Revenue Share (%), by Country 2025 & 2033
- Figure 14: South America Unmanned Sea Systems Industry Revenue (Million), by Production Analysis 2025 & 2033
- Figure 15: South America Unmanned Sea Systems Industry Revenue Share (%), by Production Analysis 2025 & 2033
- Figure 16: South America Unmanned Sea Systems Industry Revenue (Million), by Consumption Analysis 2025 & 2033
- Figure 17: South America Unmanned Sea Systems Industry Revenue Share (%), by Consumption Analysis 2025 & 2033
- Figure 18: South America Unmanned Sea Systems Industry Revenue (Million), by Import Market Analysis (Value & Volume) 2025 & 2033
- Figure 19: South America Unmanned Sea Systems Industry Revenue Share (%), by Import Market Analysis (Value & Volume) 2025 & 2033
- Figure 20: South America Unmanned Sea Systems Industry Revenue (Million), by Export Market Analysis (Value & Volume) 2025 & 2033
- Figure 21: South America Unmanned Sea Systems Industry Revenue Share (%), by Export Market Analysis (Value & Volume) 2025 & 2033
- Figure 22: South America Unmanned Sea Systems Industry Revenue (Million), by Price Trend Analysis 2025 & 2033
- Figure 23: South America Unmanned Sea Systems Industry Revenue Share (%), by Price Trend Analysis 2025 & 2033
- Figure 24: South America Unmanned Sea Systems Industry Revenue (Million), by Country 2025 & 2033
- Figure 25: South America Unmanned Sea Systems Industry Revenue Share (%), by Country 2025 & 2033
- Figure 26: Europe Unmanned Sea Systems Industry Revenue (Million), by Production Analysis 2025 & 2033
- Figure 27: Europe Unmanned Sea Systems Industry Revenue Share (%), by Production Analysis 2025 & 2033
- Figure 28: Europe Unmanned Sea Systems Industry Revenue (Million), by Consumption Analysis 2025 & 2033
- Figure 29: Europe Unmanned Sea Systems Industry Revenue Share (%), by Consumption Analysis 2025 & 2033
- Figure 30: Europe Unmanned Sea Systems Industry Revenue (Million), by Import Market Analysis (Value & Volume) 2025 & 2033
- Figure 31: Europe Unmanned Sea Systems Industry Revenue Share (%), by Import Market Analysis (Value & Volume) 2025 & 2033
- Figure 32: Europe Unmanned Sea Systems Industry Revenue (Million), by Export Market Analysis (Value & Volume) 2025 & 2033
- Figure 33: Europe Unmanned Sea Systems Industry Revenue Share (%), by Export Market Analysis (Value & Volume) 2025 & 2033
- Figure 34: Europe Unmanned Sea Systems Industry Revenue (Million), by Price Trend Analysis 2025 & 2033
- Figure 35: Europe Unmanned Sea Systems Industry Revenue Share (%), by Price Trend Analysis 2025 & 2033
- Figure 36: Europe Unmanned Sea Systems Industry Revenue (Million), by Country 2025 & 2033
- Figure 37: Europe Unmanned Sea Systems Industry Revenue Share (%), by Country 2025 & 2033
- Figure 38: Middle East & Africa Unmanned Sea Systems Industry Revenue (Million), by Production Analysis 2025 & 2033
- Figure 39: Middle East & Africa Unmanned Sea Systems Industry Revenue Share (%), by Production Analysis 2025 & 2033
- Figure 40: Middle East & Africa Unmanned Sea Systems Industry Revenue (Million), by Consumption Analysis 2025 & 2033
- Figure 41: Middle East & Africa Unmanned Sea Systems Industry Revenue Share (%), by Consumption Analysis 2025 & 2033
- Figure 42: Middle East & Africa Unmanned Sea Systems Industry Revenue (Million), by Import Market Analysis (Value & Volume) 2025 & 2033
- Figure 43: Middle East & Africa Unmanned Sea Systems Industry Revenue Share (%), by Import Market Analysis (Value & Volume) 2025 & 2033
- Figure 44: Middle East & Africa Unmanned Sea Systems Industry Revenue (Million), by Export Market Analysis (Value & Volume) 2025 & 2033
- Figure 45: Middle East & Africa Unmanned Sea Systems Industry Revenue Share (%), by Export Market Analysis (Value & Volume) 2025 & 2033
- Figure 46: Middle East & Africa Unmanned Sea Systems Industry Revenue (Million), by Price Trend Analysis 2025 & 2033
- Figure 47: Middle East & Africa Unmanned Sea Systems Industry Revenue Share (%), by Price Trend Analysis 2025 & 2033
- Figure 48: Middle East & Africa Unmanned Sea Systems Industry Revenue (Million), by Country 2025 & 2033
- Figure 49: Middle East & Africa Unmanned Sea Systems Industry Revenue Share (%), by Country 2025 & 2033
- Figure 50: Asia Pacific Unmanned Sea Systems Industry Revenue (Million), by Production Analysis 2025 & 2033
- Figure 51: Asia Pacific Unmanned Sea Systems Industry Revenue Share (%), by Production Analysis 2025 & 2033
- Figure 52: Asia Pacific Unmanned Sea Systems Industry Revenue (Million), by Consumption Analysis 2025 & 2033
- Figure 53: Asia Pacific Unmanned Sea Systems Industry Revenue Share (%), by Consumption Analysis 2025 & 2033
- Figure 54: Asia Pacific Unmanned Sea Systems Industry Revenue (Million), by Import Market Analysis (Value & Volume) 2025 & 2033
- Figure 55: Asia Pacific Unmanned Sea Systems Industry Revenue Share (%), by Import Market Analysis (Value & Volume) 2025 & 2033
- Figure 56: Asia Pacific Unmanned Sea Systems Industry Revenue (Million), by Export Market Analysis (Value & Volume) 2025 & 2033
- Figure 57: Asia Pacific Unmanned Sea Systems Industry Revenue Share (%), by Export Market Analysis (Value & Volume) 2025 & 2033
- Figure 58: Asia Pacific Unmanned Sea Systems Industry Revenue (Million), by Price Trend Analysis 2025 & 2033
- Figure 59: Asia Pacific Unmanned Sea Systems Industry Revenue Share (%), by Price Trend Analysis 2025 & 2033
- Figure 60: Asia Pacific Unmanned Sea Systems Industry Revenue (Million), by Country 2025 & 2033
- Figure 61: Asia Pacific Unmanned Sea Systems Industry Revenue Share (%), by Country 2025 & 2033
List of Tables
- Table 1: Global Unmanned Sea Systems Industry Revenue Million Forecast, by Production Analysis 2020 & 2033
- Table 2: Global Unmanned Sea Systems Industry Revenue Million Forecast, by Consumption Analysis 2020 & 2033
- Table 3: Global Unmanned Sea Systems Industry Revenue Million Forecast, by Import Market Analysis (Value & Volume) 2020 & 2033
- Table 4: Global Unmanned Sea Systems Industry Revenue Million Forecast, by Export Market Analysis (Value & Volume) 2020 & 2033
- Table 5: Global Unmanned Sea Systems Industry Revenue Million Forecast, by Price Trend Analysis 2020 & 2033
- Table 6: Global Unmanned Sea Systems Industry Revenue Million Forecast, by Region 2020 & 2033
- Table 7: Global Unmanned Sea Systems Industry Revenue Million Forecast, by Production Analysis 2020 & 2033
- Table 8: Global Unmanned Sea Systems Industry Revenue Million Forecast, by Consumption Analysis 2020 & 2033
- Table 9: Global Unmanned Sea Systems Industry Revenue Million Forecast, by Import Market Analysis (Value & Volume) 2020 & 2033
- Table 10: Global Unmanned Sea Systems Industry Revenue Million Forecast, by Export Market Analysis (Value & Volume) 2020 & 2033
- Table 11: Global Unmanned Sea Systems Industry Revenue Million Forecast, by Price Trend Analysis 2020 & 2033
- Table 12: Global Unmanned Sea Systems Industry Revenue Million Forecast, by Country 2020 & 2033
- Table 13: United States Unmanned Sea Systems Industry Revenue (Million) Forecast, by Application 2020 & 2033
- Table 14: Canada Unmanned Sea Systems Industry Revenue (Million) Forecast, by Application 2020 & 2033
- Table 15: Mexico Unmanned Sea Systems Industry Revenue (Million) Forecast, by Application 2020 & 2033
- Table 16: Global Unmanned Sea Systems Industry Revenue Million Forecast, by Production Analysis 2020 & 2033
- Table 17: Global Unmanned Sea Systems Industry Revenue Million Forecast, by Consumption Analysis 2020 & 2033
- Table 18: Global Unmanned Sea Systems Industry Revenue Million Forecast, by Import Market Analysis (Value & Volume) 2020 & 2033
- Table 19: Global Unmanned Sea Systems Industry Revenue Million Forecast, by Export Market Analysis (Value & Volume) 2020 & 2033
- Table 20: Global Unmanned Sea Systems Industry Revenue Million Forecast, by Price Trend Analysis 2020 & 2033
- Table 21: Global Unmanned Sea Systems Industry Revenue Million Forecast, by Country 2020 & 2033
- Table 22: Brazil Unmanned Sea Systems Industry Revenue (Million) Forecast, by Application 2020 & 2033
- Table 23: Argentina Unmanned Sea Systems Industry Revenue (Million) Forecast, by Application 2020 & 2033
- Table 24: Rest of South America Unmanned Sea Systems Industry Revenue (Million) Forecast, by Application 2020 & 2033
- Table 25: Global Unmanned Sea Systems Industry Revenue Million Forecast, by Production Analysis 2020 & 2033
- Table 26: Global Unmanned Sea Systems Industry Revenue Million Forecast, by Consumption Analysis 2020 & 2033
- Table 27: Global Unmanned Sea Systems Industry Revenue Million Forecast, by Import Market Analysis (Value & Volume) 2020 & 2033
- Table 28: Global Unmanned Sea Systems Industry Revenue Million Forecast, by Export Market Analysis (Value & Volume) 2020 & 2033
- Table 29: Global Unmanned Sea Systems Industry Revenue Million Forecast, by Price Trend Analysis 2020 & 2033
- Table 30: Global Unmanned Sea Systems Industry Revenue Million Forecast, by Country 2020 & 2033
- Table 31: United Kingdom Unmanned Sea Systems Industry Revenue (Million) Forecast, by Application 2020 & 2033
- Table 32: Germany Unmanned Sea Systems Industry Revenue (Million) Forecast, by Application 2020 & 2033
- Table 33: France Unmanned Sea Systems Industry Revenue (Million) Forecast, by Application 2020 & 2033
- Table 34: Italy Unmanned Sea Systems Industry Revenue (Million) Forecast, by Application 2020 & 2033
- Table 35: Spain Unmanned Sea Systems Industry Revenue (Million) Forecast, by Application 2020 & 2033
- Table 36: Russia Unmanned Sea Systems Industry Revenue (Million) Forecast, by Application 2020 & 2033
- Table 37: Benelux Unmanned Sea Systems Industry Revenue (Million) Forecast, by Application 2020 & 2033
- Table 38: Nordics Unmanned Sea Systems Industry Revenue (Million) Forecast, by Application 2020 & 2033
- Table 39: Rest of Europe Unmanned Sea Systems Industry Revenue (Million) Forecast, by Application 2020 & 2033
- Table 40: Global Unmanned Sea Systems Industry Revenue Million Forecast, by Production Analysis 2020 & 2033
- Table 41: Global Unmanned Sea Systems Industry Revenue Million Forecast, by Consumption Analysis 2020 & 2033
- Table 42: Global Unmanned Sea Systems Industry Revenue Million Forecast, by Import Market Analysis (Value & Volume) 2020 & 2033
- Table 43: Global Unmanned Sea Systems Industry Revenue Million Forecast, by Export Market Analysis (Value & Volume) 2020 & 2033
- Table 44: Global Unmanned Sea Systems Industry Revenue Million Forecast, by Price Trend Analysis 2020 & 2033
- Table 45: Global Unmanned Sea Systems Industry Revenue Million Forecast, by Country 2020 & 2033
- Table 46: Turkey Unmanned Sea Systems Industry Revenue (Million) Forecast, by Application 2020 & 2033
- Table 47: Israel Unmanned Sea Systems Industry Revenue (Million) Forecast, by Application 2020 & 2033
- Table 48: GCC Unmanned Sea Systems Industry Revenue (Million) Forecast, by Application 2020 & 2033
- Table 49: North Africa Unmanned Sea Systems Industry Revenue (Million) Forecast, by Application 2020 & 2033
- Table 50: South Africa Unmanned Sea Systems Industry Revenue (Million) Forecast, by Application 2020 & 2033
- Table 51: Rest of Middle East & Africa Unmanned Sea Systems Industry Revenue (Million) Forecast, by Application 2020 & 2033
- Table 52: Global Unmanned Sea Systems Industry Revenue Million Forecast, by Production Analysis 2020 & 2033
- Table 53: Global Unmanned Sea Systems Industry Revenue Million Forecast, by Consumption Analysis 2020 & 2033
- Table 54: Global Unmanned Sea Systems Industry Revenue Million Forecast, by Import Market Analysis (Value & Volume) 2020 & 2033
- Table 55: Global Unmanned Sea Systems Industry Revenue Million Forecast, by Export Market Analysis (Value & Volume) 2020 & 2033
- Table 56: Global Unmanned Sea Systems Industry Revenue Million Forecast, by Price Trend Analysis 2020 & 2033
- Table 57: Global Unmanned Sea Systems Industry Revenue Million Forecast, by Country 2020 & 2033
- Table 58: China Unmanned Sea Systems Industry Revenue (Million) Forecast, by Application 2020 & 2033
- Table 59: India Unmanned Sea Systems Industry Revenue (Million) Forecast, by Application 2020 & 2033
- Table 60: Japan Unmanned Sea Systems Industry Revenue (Million) Forecast, by Application 2020 & 2033
- Table 61: South Korea Unmanned Sea Systems Industry Revenue (Million) Forecast, by Application 2020 & 2033
- Table 62: ASEAN Unmanned Sea Systems Industry Revenue (Million) Forecast, by Application 2020 & 2033
- Table 63: Oceania Unmanned Sea Systems Industry Revenue (Million) Forecast, by Application 2020 & 2033
- Table 64: Rest of Asia Pacific Unmanned Sea Systems Industry Revenue (Million) Forecast, by Application 2020 & 2033
Frequently Asked Questions
1. What is the projected Compound Annual Growth Rate (CAGR) of the Unmanned Sea Systems Industry?
The projected CAGR is approximately 13.78%.
2. Which companies are prominent players in the Unmanned Sea Systems Industry?
Key companies in the market include L3Harris Technologies Inc, Groupe Gorge SA, General Dynamics Corporation, Elbit Systems Ltd, Kongsberg Gruppen ASA, Lockheed Martin Corporation, Maritime Robotics AS, Teledyne Technologies Incorporated, thyssenkrupp AG, BAE Systems plc, Saab AB, The Boeing Company.
3. What are the main segments of the Unmanned Sea Systems Industry?
The market segments include Production Analysis, Consumption Analysis, Import Market Analysis (Value & Volume), Export Market Analysis (Value & Volume), Price Trend Analysis.
4. Can you provide details about the market size?
The market size is estimated to be USD 2.30 Million as of 2022.
5. What are some drivers contributing to market growth?
Increase in Internet of Things (IoT) and Autonomous Systems; Rise in Demand for Military and Defense Satellite Communication Solutions.
6. What are the notable trends driving market growth?
Remotely Operated Vehicles (ROVs) Segment Will Showcase Significant Growth During the Forecast Period.
7. Are there any restraints impacting market growth?
Cybersecurity Threats to Satellite Communication; Interference in Transmission of Data.
8. Can you provide examples of recent developments in the market?
October 2023: The Naval Sea Systems Command, Washington, DC, signed a modification contract with Lockheed Martin Corporation to provide engineering support for Extra Large Unmanned Undersea Vehicle (UUV). The value of the contract was USD 11 million, and it will be completed by September 2024.
9. What pricing options are available for accessing the report?
Pricing options include single-user, multi-user, and enterprise licenses priced at USD 4750, USD 5250, and USD 8750 respectively.
10. Is the market size provided in terms of value or volume?
The market size is provided in terms of value, measured in Million.
11. Are there any specific market keywords associated with the report?
Yes, the market keyword associated with the report is "Unmanned Sea Systems Industry," which aids in identifying and referencing the specific market segment covered.
12. How do I determine which pricing option suits my needs best?
The pricing options vary based on user requirements and access needs. Individual users may opt for single-user licenses, while businesses requiring broader access may choose multi-user or enterprise licenses for cost-effective access to the report.
13. Are there any additional resources or data provided in the Unmanned Sea Systems Industry report?
While the report offers comprehensive insights, it's advisable to review the specific contents or supplementary materials provided to ascertain if additional resources or data are available.
14. How can I stay updated on further developments or reports in the Unmanned Sea Systems Industry?
To stay informed about further developments, trends, and reports in the Unmanned Sea Systems Industry, consider subscribing to industry newsletters, following relevant companies and organizations, or regularly checking reputable industry news sources and publications.
Methodology
Step 1 - Identification of Relevant Samples Size from Population Database


Step 2 - Approaches for Defining Global Market Size (Value, Volume* & Price*)

Note*: In applicable scenarios
Step 3 - Data Sources
Primary Research
- Web Analytics
- Survey Reports
- Research Institute
- Latest Research Reports
- Opinion Leaders
Secondary Research
- Annual Reports
- White Paper
- Latest Press Release
- Industry Association
- Paid Database
- Investor Presentations

Step 4 - Data Triangulation
Involves using different sources of information in order to increase the validity of a study
These sources are likely to be stakeholders in a program - participants, other researchers, program staff, other community members, and so on.
Then we put all data in single framework & apply various statistical tools to find out the dynamic on the market.
During the analysis stage, feedback from the stakeholder groups would be compared to determine areas of agreement as well as areas of divergence