

Key Insights
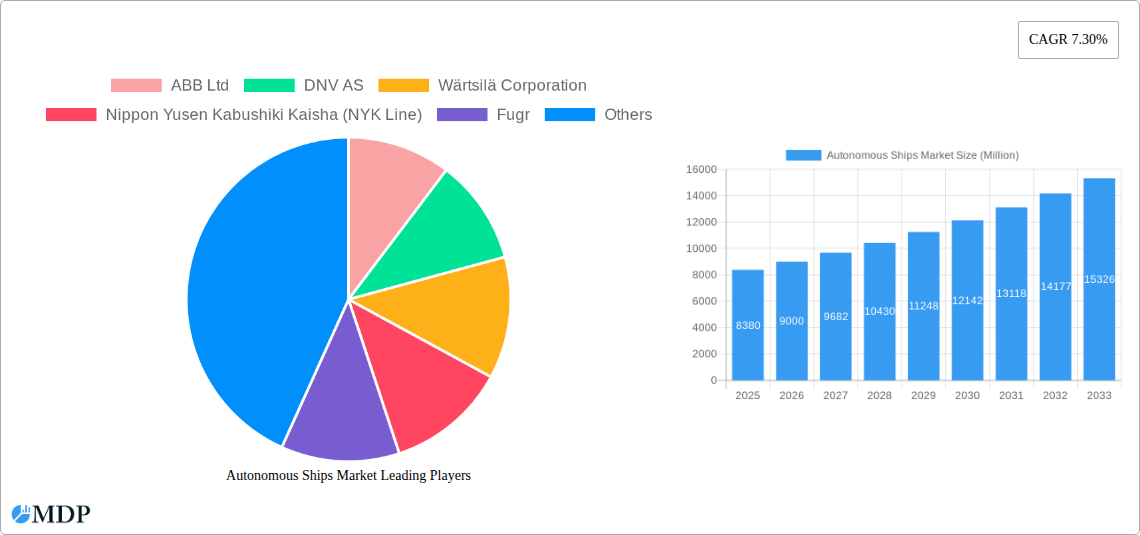
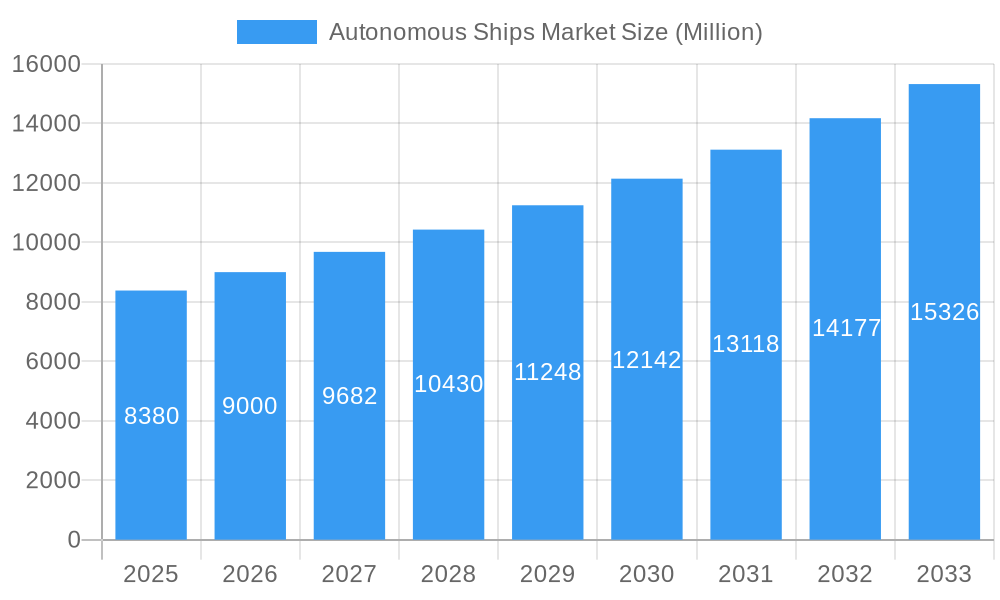
The autonomous ships market is experiencing significant growth, driven by increasing demand for enhanced safety, efficiency, and reduced operational costs within the maritime industry. The market, valued at $8.38 billion in 2025, is projected to expand at a compound annual growth rate (CAGR) of 7.30% from 2025 to 2033. This growth is fueled by several key factors. Firstly, advancements in artificial intelligence (AI), sensor technologies, and communication systems are enabling the development of more sophisticated and reliable autonomous navigation systems. Secondly, the maritime industry faces increasing pressure to improve safety and reduce human error, which autonomous ships directly address. Thirdly, the potential for significant cost savings through reduced crew expenses and optimized fuel consumption is a compelling driver for adoption. The market segmentation reveals a strong focus on partially autonomous ships, which are currently more commercially viable due to their lower technological complexity and regulatory hurdles compared to fully autonomous vessels. Commercial applications are currently dominating, particularly in cargo shipping, with military applications emerging as a key growth area in the long term. Leading players such as ABB, Kongsberg Gruppen, and Rolls-Royce are actively investing in research and development, further accelerating market expansion. Geographical distribution shows a strong presence across North America, Europe, and Asia-Pacific, reflecting the concentration of shipping activity and technological advancement in these regions.
Autonomous Ships Market Market Size (In Billion)
Challenges remain, however. Regulatory frameworks for autonomous ships are still evolving, creating uncertainty and potentially slowing down wider adoption. The high initial investment costs associated with autonomous ship technology can present a barrier to entry for smaller shipping companies. Concerns regarding cybersecurity and the potential for malicious attacks on autonomous vessels also need to be addressed. Despite these obstacles, the long-term outlook for the autonomous ships market remains positive. The continued development of more robust technologies, clearer regulatory guidelines, and decreasing costs are expected to drive substantial market growth over the forecast period. The increasing adoption of partially autonomous features will likely serve as a bridge to the wider integration of fully autonomous vessels in the coming years.
Autonomous Ships Market Company Market Share
Autonomous Ships Market: A Comprehensive Report (2019-2033)
This comprehensive report provides an in-depth analysis of the Autonomous Ships Market, offering invaluable insights for industry stakeholders, investors, and strategists. Covering the period from 2019 to 2033, with a focus on 2025, this report meticulously examines market dynamics, technological advancements, leading players, and future growth prospects. The market is poised for significant expansion, driven by technological breakthroughs and increasing demand across commercial and military applications. Download now to gain a competitive edge.
Autonomous Ships Market Market Dynamics & Concentration
The Autonomous Ships Market is experiencing dynamic growth, fueled by technological innovation and evolving regulatory landscapes. Market concentration is moderate, with several key players vying for dominance. The market share is currently distributed as follows: HD Hyundai Heavy Industries holds approximately xx%, followed by Kongsberg Gruppen ASA at xx%, ABB Ltd at xx%, and Wärtsilä Corporation at xx%. The remaining market share is distributed amongst other prominent players.
Several factors drive innovation, including advancements in AI, sensor technology, and communication systems. Stringent safety regulations and international maritime standards significantly influence market development. Product substitutes, such as traditional manned vessels, still hold a considerable market share, though their dominance is steadily declining due to the cost-effectiveness and efficiency gains offered by autonomous solutions. End-user trends reflect a growing preference for automation to enhance safety, reduce operational costs, and improve efficiency.
The past five years have witnessed a surge in M&A activity, with approximately xx major deals recorded. This consolidation is expected to accelerate as companies seek to expand their market presence and secure technological advantages.
Autonomous Ships Market Industry Trends & Analysis
The Autonomous Ships Market exhibits a robust Compound Annual Growth Rate (CAGR) of xx% during the forecast period (2025-2033), fueled by several key trends. Technological advancements, such as the development of advanced AI-powered navigation systems and improved sensor technologies, are significantly driving market expansion. This is further augmented by the increasing demand for autonomous vessels in the commercial sector, particularly in container shipping, bulk carriers, and tankers, driven by the need for increased efficiency and cost reduction. The market penetration of autonomous ships is currently at xx% and is projected to reach xx% by 2033. Consumer preferences are shifting towards autonomous solutions due to improved safety, reduced crew costs, and enhanced operational reliability. Competitive dynamics are shaping market strategies, with leading players focusing on innovation, strategic partnerships, and geographic expansion.
Leading Markets & Segments in Autonomous Ships Market
The Asia-Pacific region currently dominates the Autonomous Ships Market, driven by substantial investments in infrastructure development and supportive government policies. China and Japan are key contributors to this regional leadership. Within the segment types, the Partially Autonomous segment currently holds the largest market share due to its relatively lower initial investment costs and less complex regulatory requirements compared to fully autonomous vessels. However, the Fully Autonomous segment is expected to experience significant growth in the forecast period. The Commercial application segment is currently dominant due to the considerable cost savings and efficiency gains offered by automation in shipping. However, the Military segment is projected to see significant growth due to the potential for autonomous naval vessels to enhance defense capabilities.
- Key Drivers for Asia-Pacific Dominance:
- Favorable government policies promoting technological advancements.
- Robust maritime infrastructure.
- High concentration of shipping activities.
- Significant investments in research and development.
Autonomous Ships Market Product Developments
Recent product innovations focus on enhancing autonomy levels, improving navigational accuracy, and integrating advanced sensor systems for enhanced situational awareness. These developments address market needs for greater safety, reliability, and efficiency. Key competitive advantages stem from superior technological capabilities, enhanced operational efficiency, and the ability to offer comprehensive solutions integrating hardware and software. The trend towards greater levels of autonomy is expected to continue, leading to the development of fully autonomous vessels capable of operating without human intervention for extended periods.
Key Drivers of Autonomous Ships Market Growth
Technological advancements, particularly in artificial intelligence (AI), sensor technology, and communication systems, are primary drivers. The economic benefits of reduced crew costs, increased operational efficiency, and enhanced safety are also key factors. Furthermore, supportive government regulations and policies are encouraging the adoption of autonomous shipping solutions. For example, the investment and initiatives undertaken by governments in countries like China and Japan accelerate the market's growth.
Challenges in the Autonomous Ships Market Market
Regulatory hurdles, including the development and implementation of international standards for autonomous vessels, pose a significant challenge. Supply chain disruptions can also impact the availability of critical components, delaying project timelines and increasing costs. Intense competition among established players and new entrants creates pressure on pricing and profit margins. This results in a margin squeeze for market players leading to revenue losses.
Emerging Opportunities in Autonomous Ships Market
Technological breakthroughs, such as the development of more sophisticated AI algorithms and improved communication technologies, present significant opportunities. Strategic partnerships between technology providers and shipping companies can unlock synergies and accelerate market adoption. Expanding into new geographical markets, particularly in developing economies, offers further growth potential.
Leading Players in the Autonomous Ships Market Sector
- ABB Ltd
- DNV AS
- Wärtsilä Corporation
- Nippon Yusen Kabushiki Kaisha (NYK Line)
- Fugro
- Kongsberg Gruppen ASA
- MITSUI E&S Co Ltd
- Vigor Industrial LLC
- Rolls-Royce plc
- Praxis Automation Technology B V
- Hanwha Corporation
- HD Hyundai Heavy Industries Co Ltd
Key Milestones in Autonomous Ships Market Industry
- August 2022: Avikus, a subsidiary of HD Hyundai Heavy Industries, secured an order for its autonomous navigation solution (HiNAS 2.0) to be installed on 23 vessels for SK Shipping and Sinokor Merchant Marine. This signifies a major step towards widespread adoption of autonomous navigation technologies.
- February 2023: Austal USA delivered an autonomous-capable EPF 13 ship to the US Navy. The integration of automated maintenance and health monitoring systems demonstrates the growing capabilities of autonomous vessels for extended, unmanned operations.
Strategic Outlook for Autonomous Ships Market Market
The Autonomous Ships Market presents significant growth potential, driven by ongoing technological advancements, supportive regulatory frameworks, and rising demand across various sectors. Companies can capitalize on this by investing in research and development, forming strategic partnerships, and expanding into new geographical markets. The future will likely see increased levels of autonomy, leading to greater efficiency, cost savings, and environmental benefits. The market is expected to continue its strong growth trajectory, presenting substantial opportunities for innovation and investment.
Autonomous Ships Market Segmentation
-
1. Type
- 1.1. Partially Autonomous
- 1.2. Remotely Controlled Ship
- 1.3. Fully Autonomous
-
2. Application
- 2.1. Commercial
- 2.2. Military
Autonomous Ships Market Segmentation By Geography
-
1. North America
- 1.1. United States
- 1.2. Canada
-
2. Europe
- 2.1. United Kingdom
- 2.2. Germany
- 2.3. France
- 2.4. Italy
- 2.5. Russia
- 2.6. Rest of Europe
-
3. Asia Pacific
- 3.1. China
- 3.2. India
- 3.3. Japan
- 3.4. South Korea
- 3.5. Australia
- 3.6. Rest of Asia Pacific
-
4. Latin America
- 4.1. Brazil
- 4.2. Rest of Latin America
-
5. Middle East and Africa
- 5.1. Saudi Arabia
- 5.2. United Arab Emirates
- 5.3. Qatar
- 5.4. Egypt
- 5.5. South Africa
- 5.6. Rest of Middle East and Africa
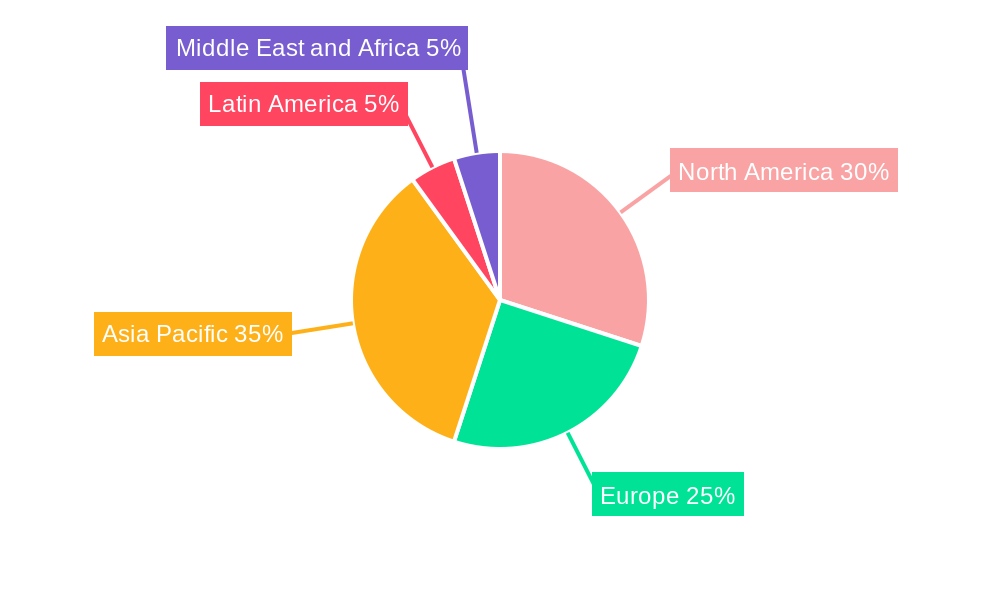
Autonomous Ships Market Regional Market Share
Geographic Coverage of Autonomous Ships Market
Autonomous Ships Market REPORT HIGHLIGHTS
| Aspects | Details |
|---|---|
| Study Period | 2020-2034 |
| Base Year | 2025 |
| Estimated Year | 2026 |
| Forecast Period | 2026-2034 |
| Historical Period | 2020-2025 |
| Growth Rate | CAGR of 7.30% from 2020-2034 |
| Segmentation |
|
Table of Contents
- 1. Introduction
- 1.1. Research Scope
- 1.2. Market Segmentation
- 1.3. Research Objective
- 1.4. Definitions and Assumptions
- 2. Executive Summary
- 2.1. Market Snapshot
- 3. Market Dynamics
- 3.1. Market Drivers
- 3.2. Market Restrains
- 3.3. Market Trends
- 3.4. Market Opportunities
- 4. Market Factor Analysis
- 4.1. Porters Five Forces
- 4.1.1. Bargaining Power of Suppliers
- 4.1.2. Bargaining Power of Buyers
- 4.1.3. Threat of New Entrants
- 4.1.4. Threat of Substitutes
- 4.1.5. Competitive Rivalry
- 4.2. PESTEL analysis
- 4.3. BCG Analysis
- 4.3.1. Stars (High Growth, High Market Share)
- 4.3.2. Cash Cows (Low Growth, High Market Share)
- 4.3.3. Question Mark (High Growth, Low Market Share)
- 4.3.4. Dogs (Low Growth, Low Market Share)
- 4.4. Ansoff Matrix Analysis
- 4.5. Supply Chain Analysis
- 4.6. Regulatory Landscape
- 4.7. Current Market Potential and Opportunity Assessment (TAM–SAM–SOM Framework)
- 4.8. MDP Analyst Note
- 4.1. Porters Five Forces
- 5. Market Analysis, Insights and Forecast 2021-2033
- 5.1. Market Analysis, Insights and Forecast - by Type
- 5.1.1. Partially Autonomous
- 5.1.2. Remotely Controlled Ship
- 5.1.3. Fully Autonomous
- 5.2. Market Analysis, Insights and Forecast - by Application
- 5.2.1. Commercial
- 5.2.2. Military
- 5.3. Market Analysis, Insights and Forecast - by Region
- 5.3.1. North America
- 5.3.2. Europe
- 5.3.3. Asia Pacific
- 5.3.4. Latin America
- 5.3.5. Middle East and Africa
- 5.1. Market Analysis, Insights and Forecast - by Type
- 6. Global Autonomous Ships Market Analysis, Insights and Forecast, 2021-2033
- 6.1. Market Analysis, Insights and Forecast - by Type
- 6.1.1. Partially Autonomous
- 6.1.2. Remotely Controlled Ship
- 6.1.3. Fully Autonomous
- 6.2. Market Analysis, Insights and Forecast - by Application
- 6.2.1. Commercial
- 6.2.2. Military
- 6.1. Market Analysis, Insights and Forecast - by Type
- 7. North America Autonomous Ships Market Analysis, Insights and Forecast, 2020-2032
- 7.1. Market Analysis, Insights and Forecast - by Type
- 7.1.1. Partially Autonomous
- 7.1.2. Remotely Controlled Ship
- 7.1.3. Fully Autonomous
- 7.2. Market Analysis, Insights and Forecast - by Application
- 7.2.1. Commercial
- 7.2.2. Military
- 7.1. Market Analysis, Insights and Forecast - by Type
- 8. Europe Autonomous Ships Market Analysis, Insights and Forecast, 2020-2032
- 8.1. Market Analysis, Insights and Forecast - by Type
- 8.1.1. Partially Autonomous
- 8.1.2. Remotely Controlled Ship
- 8.1.3. Fully Autonomous
- 8.2. Market Analysis, Insights and Forecast - by Application
- 8.2.1. Commercial
- 8.2.2. Military
- 8.1. Market Analysis, Insights and Forecast - by Type
- 9. Asia Pacific Autonomous Ships Market Analysis, Insights and Forecast, 2020-2032
- 9.1. Market Analysis, Insights and Forecast - by Type
- 9.1.1. Partially Autonomous
- 9.1.2. Remotely Controlled Ship
- 9.1.3. Fully Autonomous
- 9.2. Market Analysis, Insights and Forecast - by Application
- 9.2.1. Commercial
- 9.2.2. Military
- 9.1. Market Analysis, Insights and Forecast - by Type
- 10. Latin America Autonomous Ships Market Analysis, Insights and Forecast, 2020-2032
- 10.1. Market Analysis, Insights and Forecast - by Type
- 10.1.1. Partially Autonomous
- 10.1.2. Remotely Controlled Ship
- 10.1.3. Fully Autonomous
- 10.2. Market Analysis, Insights and Forecast - by Application
- 10.2.1. Commercial
- 10.2.2. Military
- 10.1. Market Analysis, Insights and Forecast - by Type
- 11. Middle East and Africa Autonomous Ships Market Analysis, Insights and Forecast, 2020-2032
- 11.1. Market Analysis, Insights and Forecast - by Type
- 11.1.1. Partially Autonomous
- 11.1.2. Remotely Controlled Ship
- 11.1.3. Fully Autonomous
- 11.2. Market Analysis, Insights and Forecast - by Application
- 11.2.1. Commercial
- 11.2.2. Military
- 11.1. Market Analysis, Insights and Forecast - by Type
- 12. Competitive Analysis
- 12.1. Company Profiles
- 12.1.1 ABB Ltd
- 12.1.1.1. Company Overview
- 12.1.1.2. Products
- 12.1.1.3. Company Financials
- 12.1.1.4. SWOT Analysis
- 12.1.2 DNV AS
- 12.1.2.1. Company Overview
- 12.1.2.2. Products
- 12.1.2.3. Company Financials
- 12.1.2.4. SWOT Analysis
- 12.1.3 Wärtsilä Corporation
- 12.1.3.1. Company Overview
- 12.1.3.2. Products
- 12.1.3.3. Company Financials
- 12.1.3.4. SWOT Analysis
- 12.1.4 Nippon Yusen Kabushiki Kaisha (NYK Line)
- 12.1.4.1. Company Overview
- 12.1.4.2. Products
- 12.1.4.3. Company Financials
- 12.1.4.4. SWOT Analysis
- 12.1.5 Fugr
- 12.1.5.1. Company Overview
- 12.1.5.2. Products
- 12.1.5.3. Company Financials
- 12.1.5.4. SWOT Analysis
- 12.1.6 Kongsberg Gruppen ASA
- 12.1.6.1. Company Overview
- 12.1.6.2. Products
- 12.1.6.3. Company Financials
- 12.1.6.4. SWOT Analysis
- 12.1.7 MITSUI E&S Co Ltd
- 12.1.7.1. Company Overview
- 12.1.7.2. Products
- 12.1.7.3. Company Financials
- 12.1.7.4. SWOT Analysis
- 12.1.8 Vigor Industrial LLC
- 12.1.8.1. Company Overview
- 12.1.8.2. Products
- 12.1.8.3. Company Financials
- 12.1.8.4. SWOT Analysis
- 12.1.9 Rolls-Royce plc
- 12.1.9.1. Company Overview
- 12.1.9.2. Products
- 12.1.9.3. Company Financials
- 12.1.9.4. SWOT Analysis
- 12.1.10 Praxis Automation Technology B V
- 12.1.10.1. Company Overview
- 12.1.10.2. Products
- 12.1.10.3. Company Financials
- 12.1.10.4. SWOT Analysis
- 12.1.11 Hanwha Corporation
- 12.1.11.1. Company Overview
- 12.1.11.2. Products
- 12.1.11.3. Company Financials
- 12.1.11.4. SWOT Analysis
- 12.1.12 HD Hyundai Heavy Industries Co Ltd
- 12.1.12.1. Company Overview
- 12.1.12.2. Products
- 12.1.12.3. Company Financials
- 12.1.12.4. SWOT Analysis
- 12.1.1 ABB Ltd
- 12.2. Market Entropy
- 12.2.1 Company's Key Areas Served
- 12.2.2 Recent Developments
- 12.3. Company Market Share Analysis 2025
- 12.3.1 Top 5 Companies Market Share Analysis
- 12.3.2 Top 3 Companies Market Share Analysis
- 12.4. List of Potential Customers
- 13. Research Methodology
List of Figures
- Figure 1: Global Autonomous Ships Market Revenue Breakdown (Million, %) by Region 2025 & 2033
- Figure 2: North America Autonomous Ships Market Revenue (Million), by Type 2025 & 2033
- Figure 3: North America Autonomous Ships Market Revenue Share (%), by Type 2025 & 2033
- Figure 4: North America Autonomous Ships Market Revenue (Million), by Application 2025 & 2033
- Figure 5: North America Autonomous Ships Market Revenue Share (%), by Application 2025 & 2033
- Figure 6: North America Autonomous Ships Market Revenue (Million), by Country 2025 & 2033
- Figure 7: North America Autonomous Ships Market Revenue Share (%), by Country 2025 & 2033
- Figure 8: Europe Autonomous Ships Market Revenue (Million), by Type 2025 & 2033
- Figure 9: Europe Autonomous Ships Market Revenue Share (%), by Type 2025 & 2033
- Figure 10: Europe Autonomous Ships Market Revenue (Million), by Application 2025 & 2033
- Figure 11: Europe Autonomous Ships Market Revenue Share (%), by Application 2025 & 2033
- Figure 12: Europe Autonomous Ships Market Revenue (Million), by Country 2025 & 2033
- Figure 13: Europe Autonomous Ships Market Revenue Share (%), by Country 2025 & 2033
- Figure 14: Asia Pacific Autonomous Ships Market Revenue (Million), by Type 2025 & 2033
- Figure 15: Asia Pacific Autonomous Ships Market Revenue Share (%), by Type 2025 & 2033
- Figure 16: Asia Pacific Autonomous Ships Market Revenue (Million), by Application 2025 & 2033
- Figure 17: Asia Pacific Autonomous Ships Market Revenue Share (%), by Application 2025 & 2033
- Figure 18: Asia Pacific Autonomous Ships Market Revenue (Million), by Country 2025 & 2033
- Figure 19: Asia Pacific Autonomous Ships Market Revenue Share (%), by Country 2025 & 2033
- Figure 20: Latin America Autonomous Ships Market Revenue (Million), by Type 2025 & 2033
- Figure 21: Latin America Autonomous Ships Market Revenue Share (%), by Type 2025 & 2033
- Figure 22: Latin America Autonomous Ships Market Revenue (Million), by Application 2025 & 2033
- Figure 23: Latin America Autonomous Ships Market Revenue Share (%), by Application 2025 & 2033
- Figure 24: Latin America Autonomous Ships Market Revenue (Million), by Country 2025 & 2033
- Figure 25: Latin America Autonomous Ships Market Revenue Share (%), by Country 2025 & 2033
- Figure 26: Middle East and Africa Autonomous Ships Market Revenue (Million), by Type 2025 & 2033
- Figure 27: Middle East and Africa Autonomous Ships Market Revenue Share (%), by Type 2025 & 2033
- Figure 28: Middle East and Africa Autonomous Ships Market Revenue (Million), by Application 2025 & 2033
- Figure 29: Middle East and Africa Autonomous Ships Market Revenue Share (%), by Application 2025 & 2033
- Figure 30: Middle East and Africa Autonomous Ships Market Revenue (Million), by Country 2025 & 2033
- Figure 31: Middle East and Africa Autonomous Ships Market Revenue Share (%), by Country 2025 & 2033
List of Tables
- Table 1: Global Autonomous Ships Market Revenue Million Forecast, by Type 2020 & 2033
- Table 2: Global Autonomous Ships Market Revenue Million Forecast, by Application 2020 & 2033
- Table 3: Global Autonomous Ships Market Revenue Million Forecast, by Region 2020 & 2033
- Table 4: Global Autonomous Ships Market Revenue Million Forecast, by Type 2020 & 2033
- Table 5: Global Autonomous Ships Market Revenue Million Forecast, by Application 2020 & 2033
- Table 6: Global Autonomous Ships Market Revenue Million Forecast, by Country 2020 & 2033
- Table 7: United States Autonomous Ships Market Revenue (Million) Forecast, by Application 2020 & 2033
- Table 8: Canada Autonomous Ships Market Revenue (Million) Forecast, by Application 2020 & 2033
- Table 9: Global Autonomous Ships Market Revenue Million Forecast, by Type 2020 & 2033
- Table 10: Global Autonomous Ships Market Revenue Million Forecast, by Application 2020 & 2033
- Table 11: Global Autonomous Ships Market Revenue Million Forecast, by Country 2020 & 2033
- Table 12: United Kingdom Autonomous Ships Market Revenue (Million) Forecast, by Application 2020 & 2033
- Table 13: Germany Autonomous Ships Market Revenue (Million) Forecast, by Application 2020 & 2033
- Table 14: France Autonomous Ships Market Revenue (Million) Forecast, by Application 2020 & 2033
- Table 15: Italy Autonomous Ships Market Revenue (Million) Forecast, by Application 2020 & 2033
- Table 16: Russia Autonomous Ships Market Revenue (Million) Forecast, by Application 2020 & 2033
- Table 17: Rest of Europe Autonomous Ships Market Revenue (Million) Forecast, by Application 2020 & 2033
- Table 18: Global Autonomous Ships Market Revenue Million Forecast, by Type 2020 & 2033
- Table 19: Global Autonomous Ships Market Revenue Million Forecast, by Application 2020 & 2033
- Table 20: Global Autonomous Ships Market Revenue Million Forecast, by Country 2020 & 2033
- Table 21: China Autonomous Ships Market Revenue (Million) Forecast, by Application 2020 & 2033
- Table 22: India Autonomous Ships Market Revenue (Million) Forecast, by Application 2020 & 2033
- Table 23: Japan Autonomous Ships Market Revenue (Million) Forecast, by Application 2020 & 2033
- Table 24: South Korea Autonomous Ships Market Revenue (Million) Forecast, by Application 2020 & 2033
- Table 25: Australia Autonomous Ships Market Revenue (Million) Forecast, by Application 2020 & 2033
- Table 26: Rest of Asia Pacific Autonomous Ships Market Revenue (Million) Forecast, by Application 2020 & 2033
- Table 27: Global Autonomous Ships Market Revenue Million Forecast, by Type 2020 & 2033
- Table 28: Global Autonomous Ships Market Revenue Million Forecast, by Application 2020 & 2033
- Table 29: Global Autonomous Ships Market Revenue Million Forecast, by Country 2020 & 2033
- Table 30: Brazil Autonomous Ships Market Revenue (Million) Forecast, by Application 2020 & 2033
- Table 31: Rest of Latin America Autonomous Ships Market Revenue (Million) Forecast, by Application 2020 & 2033
- Table 32: Global Autonomous Ships Market Revenue Million Forecast, by Type 2020 & 2033
- Table 33: Global Autonomous Ships Market Revenue Million Forecast, by Application 2020 & 2033
- Table 34: Global Autonomous Ships Market Revenue Million Forecast, by Country 2020 & 2033
- Table 35: Saudi Arabia Autonomous Ships Market Revenue (Million) Forecast, by Application 2020 & 2033
- Table 36: United Arab Emirates Autonomous Ships Market Revenue (Million) Forecast, by Application 2020 & 2033
- Table 37: Qatar Autonomous Ships Market Revenue (Million) Forecast, by Application 2020 & 2033
- Table 38: Egypt Autonomous Ships Market Revenue (Million) Forecast, by Application 2020 & 2033
- Table 39: South Africa Autonomous Ships Market Revenue (Million) Forecast, by Application 2020 & 2033
- Table 40: Rest of Middle East and Africa Autonomous Ships Market Revenue (Million) Forecast, by Application 2020 & 2033
Frequently Asked Questions
1. What is the projected Compound Annual Growth Rate (CAGR) of the Autonomous Ships Market?
The projected CAGR is approximately 7.30%.
2. Which companies are prominent players in the Autonomous Ships Market?
Key companies in the market include ABB Ltd, DNV AS, Wärtsilä Corporation, Nippon Yusen Kabushiki Kaisha (NYK Line), Fugr, Kongsberg Gruppen ASA, MITSUI E&S Co Ltd, Vigor Industrial LLC, Rolls-Royce plc, Praxis Automation Technology B V, Hanwha Corporation, HD Hyundai Heavy Industries Co Ltd.
3. What are the main segments of the Autonomous Ships Market?
The market segments include Type, Application.
4. Can you provide details about the market size?
The market size is estimated to be USD 8.38 Million as of 2022.
5. What are some drivers contributing to market growth?
N/A
6. What are the notable trends driving market growth?
The Commercial Segment of the Market is Anticipated to Register the Highest Growth During the Forecast Period.
7. Are there any restraints impacting market growth?
N/A
8. Can you provide examples of recent developments in the market?
February 2023: Austal USA delivered the US Navy its autonomous capable EPF 13 ship. Austal integrated an automated maintenance, health monitoring, and mission readiness capability into EPF 13. It will enable the vessel to operate for up to 30 days without human intervention in combination with existing highly automated hull, mechanical & electrical systems installed on EPF class vessels.
9. What pricing options are available for accessing the report?
Pricing options include single-user, multi-user, and enterprise licenses priced at USD 4750, USD 5250, and USD 8750 respectively.
10. Is the market size provided in terms of value or volume?
The market size is provided in terms of value, measured in Million.
11. Are there any specific market keywords associated with the report?
Yes, the market keyword associated with the report is "Autonomous Ships Market," which aids in identifying and referencing the specific market segment covered.
12. How do I determine which pricing option suits my needs best?
The pricing options vary based on user requirements and access needs. Individual users may opt for single-user licenses, while businesses requiring broader access may choose multi-user or enterprise licenses for cost-effective access to the report.
13. Are there any additional resources or data provided in the Autonomous Ships Market report?
While the report offers comprehensive insights, it's advisable to review the specific contents or supplementary materials provided to ascertain if additional resources or data are available.
14. How can I stay updated on further developments or reports in the Autonomous Ships Market?
To stay informed about further developments, trends, and reports in the Autonomous Ships Market, consider subscribing to industry newsletters, following relevant companies and organizations, or regularly checking reputable industry news sources and publications.
Methodology
Step 1 - Identification of Relevant Samples Size from Population Database


Step 2 - Approaches for Defining Global Market Size (Value, Volume* & Price*)

Note*: In applicable scenarios
Step 3 - Data Sources
Primary Research
- Web Analytics
- Survey Reports
- Research Institute
- Latest Research Reports
- Opinion Leaders
Secondary Research
- Annual Reports
- White Paper
- Latest Press Release
- Industry Association
- Paid Database
- Investor Presentations

Step 4 - Data Triangulation
Involves using different sources of information in order to increase the validity of a study
These sources are likely to be stakeholders in a program - participants, other researchers, program staff, other community members, and so on.
Then we put all data in single framework & apply various statistical tools to find out the dynamic on the market.
During the analysis stage, feedback from the stakeholder groups would be compared to determine areas of agreement as well as areas of divergence