

Key Insights
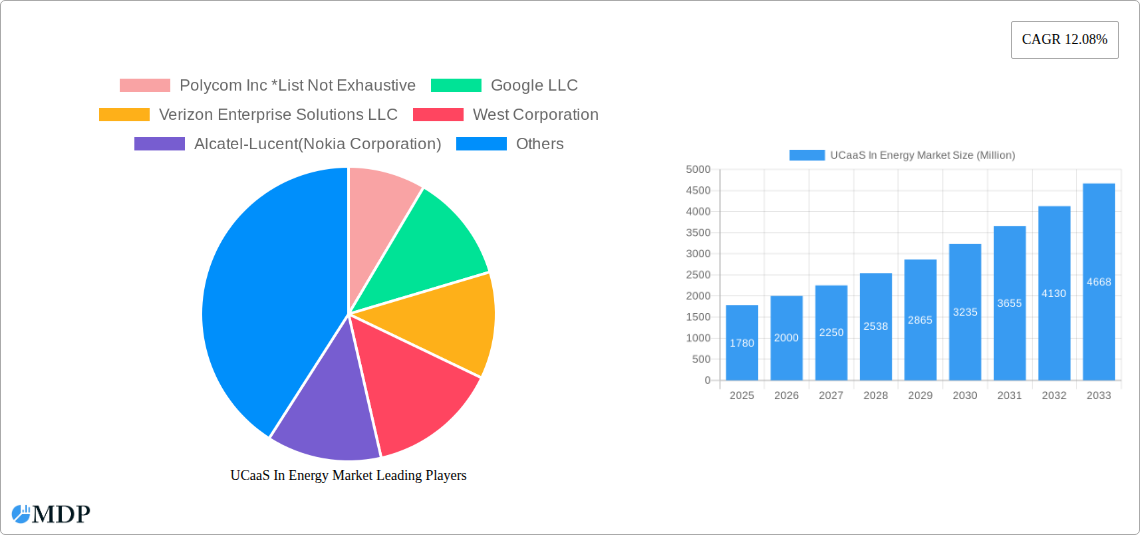
The UCaaS (Unified Communications as a Service) market within the energy sector is experiencing robust growth, projected to reach $1.78 billion in 2025 and maintain a Compound Annual Growth Rate (CAGR) of 12.08% from 2025 to 2033. This expansion is driven by several key factors. Firstly, the energy industry's increasing reliance on remote workforces and distributed operations necessitates reliable and flexible communication solutions. UCaaS offers scalability and cost-effectiveness compared to on-premise systems, enabling energy companies to connect geographically dispersed teams efficiently. Secondly, the heightened focus on operational efficiency and cost optimization within the energy sector is fueling adoption. UCaaS solutions streamline communication workflows, improve collaboration, and reduce infrastructure costs, aligning perfectly with these objectives. Finally, enhanced security features and robust integration capabilities offered by modern UCaaS platforms are addressing the critical security concerns prevalent in the energy industry.
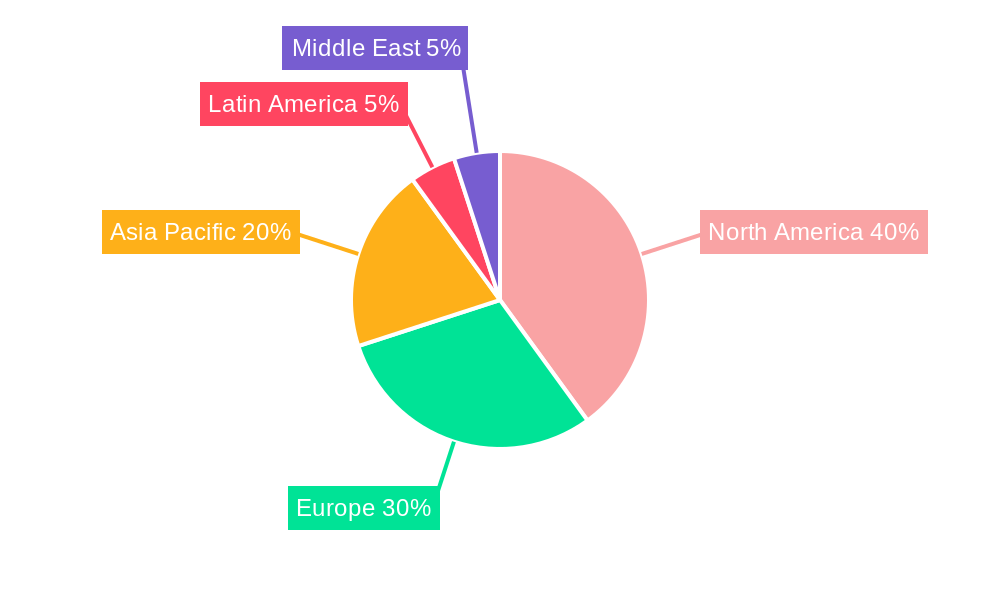
The market segmentation reveals a diverse landscape. The Telephony segment likely holds the largest market share, given its fundamental role in communication. However, substantial growth is anticipated in the Collaboration and Unified Messaging segments, driven by the increasing need for real-time teamwork and efficient information sharing across teams. Large enterprises are expected to dominate the market due to their greater investment capacity and complex communication needs, although the SME (small and medium enterprise) segment shows promising growth potential as they adopt cloud-based solutions to improve efficiency and competitiveness. Geographically, North America likely holds a significant market share due to early adoption of cloud technologies and a strong presence of major UCaaS providers. However, the Asia-Pacific region is poised for rapid growth, fueled by rising digitalization efforts and increasing infrastructure investments within the energy sector. Companies like Polycom, Google, Verizon, Cisco, Microsoft, and Avaya are key players, constantly innovating to meet evolving industry demands and maintain their market positions.
UCaaS in Energy Market: A Comprehensive Report (2019-2033)
This in-depth report provides a comprehensive analysis of the UCaaS (Unified Communications as a Service) market within the energy sector, covering the period from 2019 to 2033. With a focus on market dynamics, key players, and future trends, this report is an invaluable resource for industry stakeholders, investors, and businesses seeking to navigate this rapidly evolving landscape. The report includes detailed forecasts, valuable insights, and actionable data, projecting a market valued at xx Million by 2033.
UCaaS In Energy Market Market Dynamics & Concentration
The UCaaS market in the energy sector is characterized by a dynamic interplay of factors influencing its concentration and growth trajectory. Market concentration is currently moderate, with several key players vying for market share. However, the market exhibits significant potential for consolidation through mergers and acquisitions (M&A) activities. Between 2019 and 2024, approximately xx M&A deals were recorded, indicating a growing appetite for consolidation and expansion within this space. The average market share of the top 5 players is approximately xx%.
- Innovation Drivers: Technological advancements, such as AI-powered communication tools and enhanced security features, are driving innovation and adoption.
- Regulatory Frameworks: Government regulations regarding data security and compliance are shaping market practices and influencing vendor strategies.
- Product Substitutes: Traditional on-premise communication systems pose a competitive threat, but the advantages of cloud-based UCaaS are gradually eroding this advantage.
- End-User Trends: The increasing demand for flexible, scalable, and cost-effective communication solutions is fueling market growth. Energy companies are increasingly adopting UCaaS to improve operational efficiency and collaboration across geographically dispersed teams.
- M&A Activities: Consolidation through acquisitions is expected to continue, leading to a more concentrated market landscape in the coming years.
UCaaS In Energy Market Industry Trends & Analysis
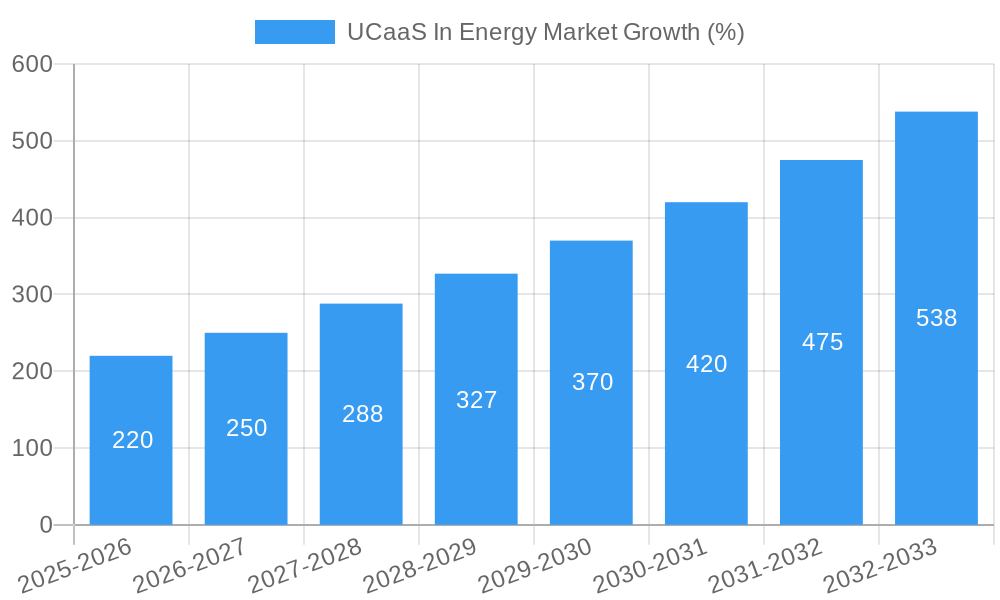
The UCaaS market in the energy industry is experiencing robust growth, driven by several key factors. The market's Compound Annual Growth Rate (CAGR) during the historical period (2019-2024) was xx%, and is projected to reach xx% during the forecast period (2025-2033). This growth is fueled by increasing digital transformation initiatives within energy companies, the need for enhanced communication and collaboration across distributed teams, and the cost-effectiveness of cloud-based solutions. Market penetration is currently at xx% and is expected to increase significantly over the forecast period. Technological disruptions, particularly in areas such as artificial intelligence (AI) and 5G connectivity, are further accelerating this growth. Consumer preference is shifting towards flexible, integrated communication platforms that seamlessly integrate with existing workflows and enterprise resource planning (ERP) systems. The competitive landscape is intensely competitive, with both established players and new entrants vying for market share through innovation and strategic partnerships.
Leading Markets & Segments in UCaaS In Energy Market
The North American region currently dominates the UCaaS market within the energy sector, driven by factors including robust technological infrastructure and high adoption rates among large enterprises. However, the Asia-Pacific region is projected to witness significant growth in the coming years due to increasing investments in digital infrastructure and expanding telecommunications networks.
By Component:
- Collaboration: This segment is currently the largest, driven by the demand for seamless communication and collaboration tools across dispersed teams.
- Telephony: This remains a significant segment, especially for established players and large enterprises.
- Unified Messaging: Strong growth in this segment is anticipated due to increased efficiency and streamlined communication management.
- Conferencing: This segment is growing rapidly due to the increased need for virtual meetings and remote collaboration.
By Deployment Model:
- Hybrid Model: The hybrid model is gaining traction, offering a balance between on-premise security and the flexibility of the cloud.
- Public Cloud: This model is becoming increasingly popular due to cost-effectiveness and scalability.
By Enterprise Size:
- Large Enterprise: This segment represents the largest share of the market due to their greater technological investments and budget capabilities.
- Small & Medium Enterprise (SME): This segment is exhibiting faster growth due to increasing affordability and easier implementation of UCaaS solutions.
UCaaS In Energy Market Product Developments
Recent product developments in the UCaaS market for the energy sector focus on enhancing user experience, improving security, and integrating with existing enterprise systems. This includes features like AI-powered virtual assistants, enhanced video conferencing capabilities, and improved data encryption and security protocols. Market fit is increasingly driven by solutions that offer seamless integration with existing workflows, data analytics capabilities, and flexible pricing models catering to diverse organizational needs. The integration of UCaaS with other enterprise applications, including ERP and CRM systems, is becoming a key differentiator.
Key Drivers of UCaaS In Energy Market Growth
Several factors contribute to the growth of the UCaaS market in the energy sector. Technological advancements, such as the development of AI-powered communication tools and enhanced security features, are driving adoption. Economic factors, including the increasing cost-effectiveness of cloud-based solutions, are making UCaaS more appealing to businesses of all sizes. Regulatory frameworks, while presenting challenges, also drive innovation and the development of solutions compliant with industry standards. The growing need for enhanced collaboration across geographically dispersed teams within the energy sector is also a major driver.
Challenges in the UCaaS In Energy Market Market
Despite the significant growth potential, several challenges hinder market expansion. Regulatory hurdles related to data security and compliance necessitate investment in robust security measures. Supply chain disruptions can impact the availability of hardware and software components. Intense competitive pressures, particularly from established players in the telecommunications market, necessitate continuous innovation and differentiation. The high initial setup costs for some UCaaS solutions can also be a barrier for smaller energy companies.
Emerging Opportunities in UCaaS In Energy Market
Significant opportunities exist for long-term growth within the UCaaS market for the energy industry. The integration of UCaaS with IoT (Internet of Things) devices allows for enhanced real-time communication and data monitoring across operations. Strategic partnerships between UCaaS providers and energy companies can foster innovation and tailor solutions to specific industry needs. Expansion into new geographical markets, particularly in developing economies, presents a substantial growth potential. The increasing adoption of 5G networks further facilitates the growth of UCaaS by allowing for faster speeds and lower latency, improving the overall user experience.
Leading Players in the UCaaS In Energy Market Sector
- Polycom Inc
- Google LLC
- Verizon Enterprise Solutions LLC
- West Corporation
- Alcatel-Lucent (Nokia Corporation)
- Cisco Systems Inc
- Microsoft Corporation
- International Business Machines Corporation
- Avaya Inc
- BT Group plc
Key Milestones in UCaaS In Energy Market Industry
- August 2022: Avaya introduced Avaya Spaces, an all-in-one video collaboration app designed for the modern digital workplace, significantly enhancing video conferencing capabilities.
- May 2023: Access4 launched a new SMS service, strengthening its partner network and improving customer retention, demonstrating the importance of supplementary communication services.
Strategic Outlook for UCaaS In Energy Market Market
The future of the UCaaS market in the energy sector is bright, with significant growth potential driven by technological advancements, increasing demand for flexible and scalable communication solutions, and ongoing digital transformation within the industry. Strategic partnerships, focusing on integration with existing enterprise systems and leveraging AI capabilities, will be crucial for success. Companies focusing on enhanced security measures and compliance with industry regulations will gain a competitive edge. The market is poised for sustained growth, driven by the increasing adoption of cloud-based solutions across the energy value chain.
UCaaS In Energy Market Segmentation
-
1. Component
- 1.1. Telephony
- 1.2. Collaboration
- 1.3. Unified Messaging
- 1.4. Conferencing
- 1.5. Other Services
-
2. Deployment Model
- 2.1. Private
- 2.2. Public
- 2.3. Hybrid Model
-
3. Enterprise Size
- 3.1. Large Enterprise
- 3.2. Small & Medium Enterprise
UCaaS In Energy Market Segmentation By Geography
- 1. North America
- 2. Europe
- 3. Asia
- 4. Latin America
- 5. Middle East and Africa
UCaaS In Energy Market REPORT HIGHLIGHTS
| Aspects | Details |
|---|---|
| Study Period | 2019-2033 |
| Base Year | 2024 |
| Estimated Year | 2025 |
| Forecast Period | 2025-2033 |
| Historical Period | 2019-2024 |
| Growth Rate | CAGR of 12.08% from 2019-2033 |
| Segmentation |
|
Table of Contents
- 1. Introduction
- 1.1. Research Scope
- 1.2. Market Segmentation
- 1.3. Research Methodology
- 1.4. Definitions and Assumptions
- 2. Executive Summary
- 2.1. Introduction
- 3. Market Dynamics
- 3.1. Introduction
- 3.2. Market Drivers
- 3.2.1. Proliferation of Cloud Based Ecosystem will Act as a Driver; Improvement of Communication Technology
- 3.3. Market Restrains
- 3.3.1. Data Security Concerns will Remain a Challenge to the Growth of the Market
- 3.4. Market Trends
- 3.4.1. Proliferation of Cloud Based Ecosystem to Drive the Market Growth
- 4. Market Factor Analysis
- 4.1. Porters Five Forces
- 4.2. Supply/Value Chain
- 4.3. PESTEL analysis
- 4.4. Market Entropy
- 4.5. Patent/Trademark Analysis
- 5. Global UCaaS In Energy Market Analysis, Insights and Forecast, 2019-2031
- 5.1. Market Analysis, Insights and Forecast - by Component
- 5.1.1. Telephony
- 5.1.2. Collaboration
- 5.1.3. Unified Messaging
- 5.1.4. Conferencing
- 5.1.5. Other Services
- 5.2. Market Analysis, Insights and Forecast - by Deployment Model
- 5.2.1. Private
- 5.2.2. Public
- 5.2.3. Hybrid Model
- 5.3. Market Analysis, Insights and Forecast - by Enterprise Size
- 5.3.1. Large Enterprise
- 5.3.2. Small & Medium Enterprise
- 5.4. Market Analysis, Insights and Forecast - by Region
- 5.4.1. North America
- 5.4.2. Europe
- 5.4.3. Asia
- 5.4.4. Latin America
- 5.4.5. Middle East and Africa
- 5.1. Market Analysis, Insights and Forecast - by Component
- 6. North America UCaaS In Energy Market Analysis, Insights and Forecast, 2019-2031
- 6.1. Market Analysis, Insights and Forecast - by Component
- 6.1.1. Telephony
- 6.1.2. Collaboration
- 6.1.3. Unified Messaging
- 6.1.4. Conferencing
- 6.1.5. Other Services
- 6.2. Market Analysis, Insights and Forecast - by Deployment Model
- 6.2.1. Private
- 6.2.2. Public
- 6.2.3. Hybrid Model
- 6.3. Market Analysis, Insights and Forecast - by Enterprise Size
- 6.3.1. Large Enterprise
- 6.3.2. Small & Medium Enterprise
- 6.1. Market Analysis, Insights and Forecast - by Component
- 7. Europe UCaaS In Energy Market Analysis, Insights and Forecast, 2019-2031
- 7.1. Market Analysis, Insights and Forecast - by Component
- 7.1.1. Telephony
- 7.1.2. Collaboration
- 7.1.3. Unified Messaging
- 7.1.4. Conferencing
- 7.1.5. Other Services
- 7.2. Market Analysis, Insights and Forecast - by Deployment Model
- 7.2.1. Private
- 7.2.2. Public
- 7.2.3. Hybrid Model
- 7.3. Market Analysis, Insights and Forecast - by Enterprise Size
- 7.3.1. Large Enterprise
- 7.3.2. Small & Medium Enterprise
- 7.1. Market Analysis, Insights and Forecast - by Component
- 8. Asia UCaaS In Energy Market Analysis, Insights and Forecast, 2019-2031
- 8.1. Market Analysis, Insights and Forecast - by Component
- 8.1.1. Telephony
- 8.1.2. Collaboration
- 8.1.3. Unified Messaging
- 8.1.4. Conferencing
- 8.1.5. Other Services
- 8.2. Market Analysis, Insights and Forecast - by Deployment Model
- 8.2.1. Private
- 8.2.2. Public
- 8.2.3. Hybrid Model
- 8.3. Market Analysis, Insights and Forecast - by Enterprise Size
- 8.3.1. Large Enterprise
- 8.3.2. Small & Medium Enterprise
- 8.1. Market Analysis, Insights and Forecast - by Component
- 9. Latin America UCaaS In Energy Market Analysis, Insights and Forecast, 2019-2031
- 9.1. Market Analysis, Insights and Forecast - by Component
- 9.1.1. Telephony
- 9.1.2. Collaboration
- 9.1.3. Unified Messaging
- 9.1.4. Conferencing
- 9.1.5. Other Services
- 9.2. Market Analysis, Insights and Forecast - by Deployment Model
- 9.2.1. Private
- 9.2.2. Public
- 9.2.3. Hybrid Model
- 9.3. Market Analysis, Insights and Forecast - by Enterprise Size
- 9.3.1. Large Enterprise
- 9.3.2. Small & Medium Enterprise
- 9.1. Market Analysis, Insights and Forecast - by Component
- 10. Middle East and Africa UCaaS In Energy Market Analysis, Insights and Forecast, 2019-2031
- 10.1. Market Analysis, Insights and Forecast - by Component
- 10.1.1. Telephony
- 10.1.2. Collaboration
- 10.1.3. Unified Messaging
- 10.1.4. Conferencing
- 10.1.5. Other Services
- 10.2. Market Analysis, Insights and Forecast - by Deployment Model
- 10.2.1. Private
- 10.2.2. Public
- 10.2.3. Hybrid Model
- 10.3. Market Analysis, Insights and Forecast - by Enterprise Size
- 10.3.1. Large Enterprise
- 10.3.2. Small & Medium Enterprise
- 10.1. Market Analysis, Insights and Forecast - by Component
- 11. North America UCaaS In Energy Market Analysis, Insights and Forecast, 2019-2031
- 11.1. Market Analysis, Insights and Forecast - By Country/Sub-region
- 11.1.1.
- 12. Europe UCaaS In Energy Market Analysis, Insights and Forecast, 2019-2031
- 12.1. Market Analysis, Insights and Forecast - By Country/Sub-region
- 12.1.1.
- 13. Asia Pacific UCaaS In Energy Market Analysis, Insights and Forecast, 2019-2031
- 13.1. Market Analysis, Insights and Forecast - By Country/Sub-region
- 13.1.1.
- 14. Latin America UCaaS In Energy Market Analysis, Insights and Forecast, 2019-2031
- 14.1. Market Analysis, Insights and Forecast - By Country/Sub-region
- 14.1.1.
- 15. Middle East UCaaS In Energy Market Analysis, Insights and Forecast, 2019-2031
- 15.1. Market Analysis, Insights and Forecast - By Country/Sub-region
- 15.1.1.
- 16. Competitive Analysis
- 16.1. Global Market Share Analysis 2024
- 16.2. Company Profiles
- 16.2.1 Polycom Inc *List Not Exhaustive
- 16.2.1.1. Overview
- 16.2.1.2. Products
- 16.2.1.3. SWOT Analysis
- 16.2.1.4. Recent Developments
- 16.2.1.5. Financials (Based on Availability)
- 16.2.2 Google LLC
- 16.2.2.1. Overview
- 16.2.2.2. Products
- 16.2.2.3. SWOT Analysis
- 16.2.2.4. Recent Developments
- 16.2.2.5. Financials (Based on Availability)
- 16.2.3 Verizon Enterprise Solutions LLC
- 16.2.3.1. Overview
- 16.2.3.2. Products
- 16.2.3.3. SWOT Analysis
- 16.2.3.4. Recent Developments
- 16.2.3.5. Financials (Based on Availability)
- 16.2.4 West Corporation
- 16.2.4.1. Overview
- 16.2.4.2. Products
- 16.2.4.3. SWOT Analysis
- 16.2.4.4. Recent Developments
- 16.2.4.5. Financials (Based on Availability)
- 16.2.5 Alcatel-Lucent(Nokia Corporation)
- 16.2.5.1. Overview
- 16.2.5.2. Products
- 16.2.5.3. SWOT Analysis
- 16.2.5.4. Recent Developments
- 16.2.5.5. Financials (Based on Availability)
- 16.2.6 Cisco Systems Inc
- 16.2.6.1. Overview
- 16.2.6.2. Products
- 16.2.6.3. SWOT Analysis
- 16.2.6.4. Recent Developments
- 16.2.6.5. Financials (Based on Availability)
- 16.2.7 Microsoft Corporation
- 16.2.7.1. Overview
- 16.2.7.2. Products
- 16.2.7.3. SWOT Analysis
- 16.2.7.4. Recent Developments
- 16.2.7.5. Financials (Based on Availability)
- 16.2.8 International Business Machines Corporation
- 16.2.8.1. Overview
- 16.2.8.2. Products
- 16.2.8.3. SWOT Analysis
- 16.2.8.4. Recent Developments
- 16.2.8.5. Financials (Based on Availability)
- 16.2.9 Avaya Inc
- 16.2.9.1. Overview
- 16.2.9.2. Products
- 16.2.9.3. SWOT Analysis
- 16.2.9.4. Recent Developments
- 16.2.9.5. Financials (Based on Availability)
- 16.2.10 BT Group plc
- 16.2.10.1. Overview
- 16.2.10.2. Products
- 16.2.10.3. SWOT Analysis
- 16.2.10.4. Recent Developments
- 16.2.10.5. Financials (Based on Availability)
- 16.2.1 Polycom Inc *List Not Exhaustive
List of Figures
- Figure 1: Global UCaaS In Energy Market Revenue Breakdown (Million, %) by Region 2024 & 2032
- Figure 2: North America UCaaS In Energy Market Revenue (Million), by Country 2024 & 2032
- Figure 3: North America UCaaS In Energy Market Revenue Share (%), by Country 2024 & 2032
- Figure 4: Europe UCaaS In Energy Market Revenue (Million), by Country 2024 & 2032
- Figure 5: Europe UCaaS In Energy Market Revenue Share (%), by Country 2024 & 2032
- Figure 6: Asia Pacific UCaaS In Energy Market Revenue (Million), by Country 2024 & 2032
- Figure 7: Asia Pacific UCaaS In Energy Market Revenue Share (%), by Country 2024 & 2032
- Figure 8: Latin America UCaaS In Energy Market Revenue (Million), by Country 2024 & 2032
- Figure 9: Latin America UCaaS In Energy Market Revenue Share (%), by Country 2024 & 2032
- Figure 10: Middle East UCaaS In Energy Market Revenue (Million), by Country 2024 & 2032
- Figure 11: Middle East UCaaS In Energy Market Revenue Share (%), by Country 2024 & 2032
- Figure 12: North America UCaaS In Energy Market Revenue (Million), by Component 2024 & 2032
- Figure 13: North America UCaaS In Energy Market Revenue Share (%), by Component 2024 & 2032
- Figure 14: North America UCaaS In Energy Market Revenue (Million), by Deployment Model 2024 & 2032
- Figure 15: North America UCaaS In Energy Market Revenue Share (%), by Deployment Model 2024 & 2032
- Figure 16: North America UCaaS In Energy Market Revenue (Million), by Enterprise Size 2024 & 2032
- Figure 17: North America UCaaS In Energy Market Revenue Share (%), by Enterprise Size 2024 & 2032
- Figure 18: North America UCaaS In Energy Market Revenue (Million), by Country 2024 & 2032
- Figure 19: North America UCaaS In Energy Market Revenue Share (%), by Country 2024 & 2032
- Figure 20: Europe UCaaS In Energy Market Revenue (Million), by Component 2024 & 2032
- Figure 21: Europe UCaaS In Energy Market Revenue Share (%), by Component 2024 & 2032
- Figure 22: Europe UCaaS In Energy Market Revenue (Million), by Deployment Model 2024 & 2032
- Figure 23: Europe UCaaS In Energy Market Revenue Share (%), by Deployment Model 2024 & 2032
- Figure 24: Europe UCaaS In Energy Market Revenue (Million), by Enterprise Size 2024 & 2032
- Figure 25: Europe UCaaS In Energy Market Revenue Share (%), by Enterprise Size 2024 & 2032
- Figure 26: Europe UCaaS In Energy Market Revenue (Million), by Country 2024 & 2032
- Figure 27: Europe UCaaS In Energy Market Revenue Share (%), by Country 2024 & 2032
- Figure 28: Asia UCaaS In Energy Market Revenue (Million), by Component 2024 & 2032
- Figure 29: Asia UCaaS In Energy Market Revenue Share (%), by Component 2024 & 2032
- Figure 30: Asia UCaaS In Energy Market Revenue (Million), by Deployment Model 2024 & 2032
- Figure 31: Asia UCaaS In Energy Market Revenue Share (%), by Deployment Model 2024 & 2032
- Figure 32: Asia UCaaS In Energy Market Revenue (Million), by Enterprise Size 2024 & 2032
- Figure 33: Asia UCaaS In Energy Market Revenue Share (%), by Enterprise Size 2024 & 2032
- Figure 34: Asia UCaaS In Energy Market Revenue (Million), by Country 2024 & 2032
- Figure 35: Asia UCaaS In Energy Market Revenue Share (%), by Country 2024 & 2032
- Figure 36: Latin America UCaaS In Energy Market Revenue (Million), by Component 2024 & 2032
- Figure 37: Latin America UCaaS In Energy Market Revenue Share (%), by Component 2024 & 2032
- Figure 38: Latin America UCaaS In Energy Market Revenue (Million), by Deployment Model 2024 & 2032
- Figure 39: Latin America UCaaS In Energy Market Revenue Share (%), by Deployment Model 2024 & 2032
- Figure 40: Latin America UCaaS In Energy Market Revenue (Million), by Enterprise Size 2024 & 2032
- Figure 41: Latin America UCaaS In Energy Market Revenue Share (%), by Enterprise Size 2024 & 2032
- Figure 42: Latin America UCaaS In Energy Market Revenue (Million), by Country 2024 & 2032
- Figure 43: Latin America UCaaS In Energy Market Revenue Share (%), by Country 2024 & 2032
- Figure 44: Middle East and Africa UCaaS In Energy Market Revenue (Million), by Component 2024 & 2032
- Figure 45: Middle East and Africa UCaaS In Energy Market Revenue Share (%), by Component 2024 & 2032
- Figure 46: Middle East and Africa UCaaS In Energy Market Revenue (Million), by Deployment Model 2024 & 2032
- Figure 47: Middle East and Africa UCaaS In Energy Market Revenue Share (%), by Deployment Model 2024 & 2032
- Figure 48: Middle East and Africa UCaaS In Energy Market Revenue (Million), by Enterprise Size 2024 & 2032
- Figure 49: Middle East and Africa UCaaS In Energy Market Revenue Share (%), by Enterprise Size 2024 & 2032
- Figure 50: Middle East and Africa UCaaS In Energy Market Revenue (Million), by Country 2024 & 2032
- Figure 51: Middle East and Africa UCaaS In Energy Market Revenue Share (%), by Country 2024 & 2032
List of Tables
- Table 1: Global UCaaS In Energy Market Revenue Million Forecast, by Region 2019 & 2032
- Table 2: Global UCaaS In Energy Market Revenue Million Forecast, by Component 2019 & 2032
- Table 3: Global UCaaS In Energy Market Revenue Million Forecast, by Deployment Model 2019 & 2032
- Table 4: Global UCaaS In Energy Market Revenue Million Forecast, by Enterprise Size 2019 & 2032
- Table 5: Global UCaaS In Energy Market Revenue Million Forecast, by Region 2019 & 2032
- Table 6: Global UCaaS In Energy Market Revenue Million Forecast, by Country 2019 & 2032
- Table 7: UCaaS In Energy Market Revenue (Million) Forecast, by Application 2019 & 2032
- Table 8: Global UCaaS In Energy Market Revenue Million Forecast, by Country 2019 & 2032
- Table 9: UCaaS In Energy Market Revenue (Million) Forecast, by Application 2019 & 2032
- Table 10: Global UCaaS In Energy Market Revenue Million Forecast, by Country 2019 & 2032
- Table 11: UCaaS In Energy Market Revenue (Million) Forecast, by Application 2019 & 2032
- Table 12: Global UCaaS In Energy Market Revenue Million Forecast, by Country 2019 & 2032
- Table 13: UCaaS In Energy Market Revenue (Million) Forecast, by Application 2019 & 2032
- Table 14: Global UCaaS In Energy Market Revenue Million Forecast, by Country 2019 & 2032
- Table 15: UCaaS In Energy Market Revenue (Million) Forecast, by Application 2019 & 2032
- Table 16: Global UCaaS In Energy Market Revenue Million Forecast, by Component 2019 & 2032
- Table 17: Global UCaaS In Energy Market Revenue Million Forecast, by Deployment Model 2019 & 2032
- Table 18: Global UCaaS In Energy Market Revenue Million Forecast, by Enterprise Size 2019 & 2032
- Table 19: Global UCaaS In Energy Market Revenue Million Forecast, by Country 2019 & 2032
- Table 20: Global UCaaS In Energy Market Revenue Million Forecast, by Component 2019 & 2032
- Table 21: Global UCaaS In Energy Market Revenue Million Forecast, by Deployment Model 2019 & 2032
- Table 22: Global UCaaS In Energy Market Revenue Million Forecast, by Enterprise Size 2019 & 2032
- Table 23: Global UCaaS In Energy Market Revenue Million Forecast, by Country 2019 & 2032
- Table 24: Global UCaaS In Energy Market Revenue Million Forecast, by Component 2019 & 2032
- Table 25: Global UCaaS In Energy Market Revenue Million Forecast, by Deployment Model 2019 & 2032
- Table 26: Global UCaaS In Energy Market Revenue Million Forecast, by Enterprise Size 2019 & 2032
- Table 27: Global UCaaS In Energy Market Revenue Million Forecast, by Country 2019 & 2032
- Table 28: Global UCaaS In Energy Market Revenue Million Forecast, by Component 2019 & 2032
- Table 29: Global UCaaS In Energy Market Revenue Million Forecast, by Deployment Model 2019 & 2032
- Table 30: Global UCaaS In Energy Market Revenue Million Forecast, by Enterprise Size 2019 & 2032
- Table 31: Global UCaaS In Energy Market Revenue Million Forecast, by Country 2019 & 2032
- Table 32: Global UCaaS In Energy Market Revenue Million Forecast, by Component 2019 & 2032
- Table 33: Global UCaaS In Energy Market Revenue Million Forecast, by Deployment Model 2019 & 2032
- Table 34: Global UCaaS In Energy Market Revenue Million Forecast, by Enterprise Size 2019 & 2032
- Table 35: Global UCaaS In Energy Market Revenue Million Forecast, by Country 2019 & 2032
Frequently Asked Questions
1. What is the projected Compound Annual Growth Rate (CAGR) of the UCaaS In Energy Market?
The projected CAGR is approximately 12.08%.
2. Which companies are prominent players in the UCaaS In Energy Market?
Key companies in the market include Polycom Inc *List Not Exhaustive, Google LLC, Verizon Enterprise Solutions LLC, West Corporation, Alcatel-Lucent(Nokia Corporation), Cisco Systems Inc, Microsoft Corporation, International Business Machines Corporation, Avaya Inc, BT Group plc.
3. What are the main segments of the UCaaS In Energy Market?
The market segments include Component, Deployment Model, Enterprise Size.
4. Can you provide details about the market size?
The market size is estimated to be USD 1.78 Million as of 2022.
5. What are some drivers contributing to market growth?
Proliferation of Cloud Based Ecosystem will Act as a Driver; Improvement of Communication Technology.
6. What are the notable trends driving market growth?
Proliferation of Cloud Based Ecosystem to Drive the Market Growth.
7. Are there any restraints impacting market growth?
Data Security Concerns will Remain a Challenge to the Growth of the Market.
8. Can you provide examples of recent developments in the market?
May 2023: Access4, a leading Unified Communication-as-a-Service (UCaaS) provider, has unveiled a new SMS service, demonstrating its commitment to enhancing partner network growth and bolstering customer retention.
9. What pricing options are available for accessing the report?
Pricing options include single-user, multi-user, and enterprise licenses priced at USD 4750, USD 5250, and USD 8750 respectively.
10. Is the market size provided in terms of value or volume?
The market size is provided in terms of value, measured in Million.
11. Are there any specific market keywords associated with the report?
Yes, the market keyword associated with the report is "UCaaS In Energy Market," which aids in identifying and referencing the specific market segment covered.
12. How do I determine which pricing option suits my needs best?
The pricing options vary based on user requirements and access needs. Individual users may opt for single-user licenses, while businesses requiring broader access may choose multi-user or enterprise licenses for cost-effective access to the report.
13. Are there any additional resources or data provided in the UCaaS In Energy Market report?
While the report offers comprehensive insights, it's advisable to review the specific contents or supplementary materials provided to ascertain if additional resources or data are available.
14. How can I stay updated on further developments or reports in the UCaaS In Energy Market?
To stay informed about further developments, trends, and reports in the UCaaS In Energy Market, consider subscribing to industry newsletters, following relevant companies and organizations, or regularly checking reputable industry news sources and publications.
Methodology
Step 1 - Identification of Relevant Samples Size from Population Database


Step 2 - Approaches for Defining Global Market Size (Value, Volume* & Price*)

Note*: In applicable scenarios
Step 3 - Data Sources
Primary Research
- Web Analytics
- Survey Reports
- Research Institute
- Latest Research Reports
- Opinion Leaders
Secondary Research
- Annual Reports
- White Paper
- Latest Press Release
- Industry Association
- Paid Database
- Investor Presentations

Step 4 - Data Triangulation
Involves using different sources of information in order to increase the validity of a study
These sources are likely to be stakeholders in a program - participants, other researchers, program staff, other community members, and so on.
Then we put all data in single framework & apply various statistical tools to find out the dynamic on the market.
During the analysis stage, feedback from the stakeholder groups would be compared to determine areas of agreement as well as areas of divergence
