

Key Insights
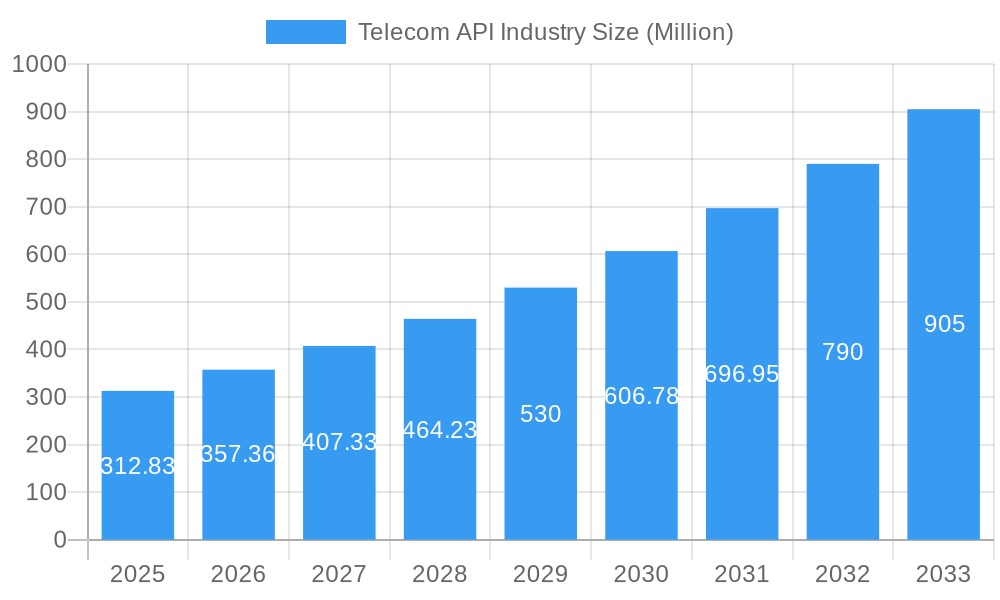
The Telecom API market, valued at $312.83 million in 2025, is experiencing robust growth, projected to expand significantly through 2033. A Compound Annual Growth Rate (CAGR) of 14.05% indicates strong market momentum driven by several key factors. The increasing adoption of cloud-based communication solutions by enterprises is a primary driver, enabling seamless integration of communication functionalities within their applications and workflows. Furthermore, the rising demand for omnichannel customer engagement strategies, facilitated by APIs, is fueling market expansion. The diverse range of API types, including messaging, voice, payment, and location APIs, caters to a broad spectrum of developer needs across various industries. The market segmentation, encompassing diverse service types, deployment models (hybrid and multi-cloud leading the way), and end-user categories (enterprise developers being a major segment), highlights the market's versatility and adaptability. Competition is fierce, with established telecom players and tech giants vying for market share. This competitive landscape fosters innovation and accelerates the development of sophisticated and feature-rich APIs.
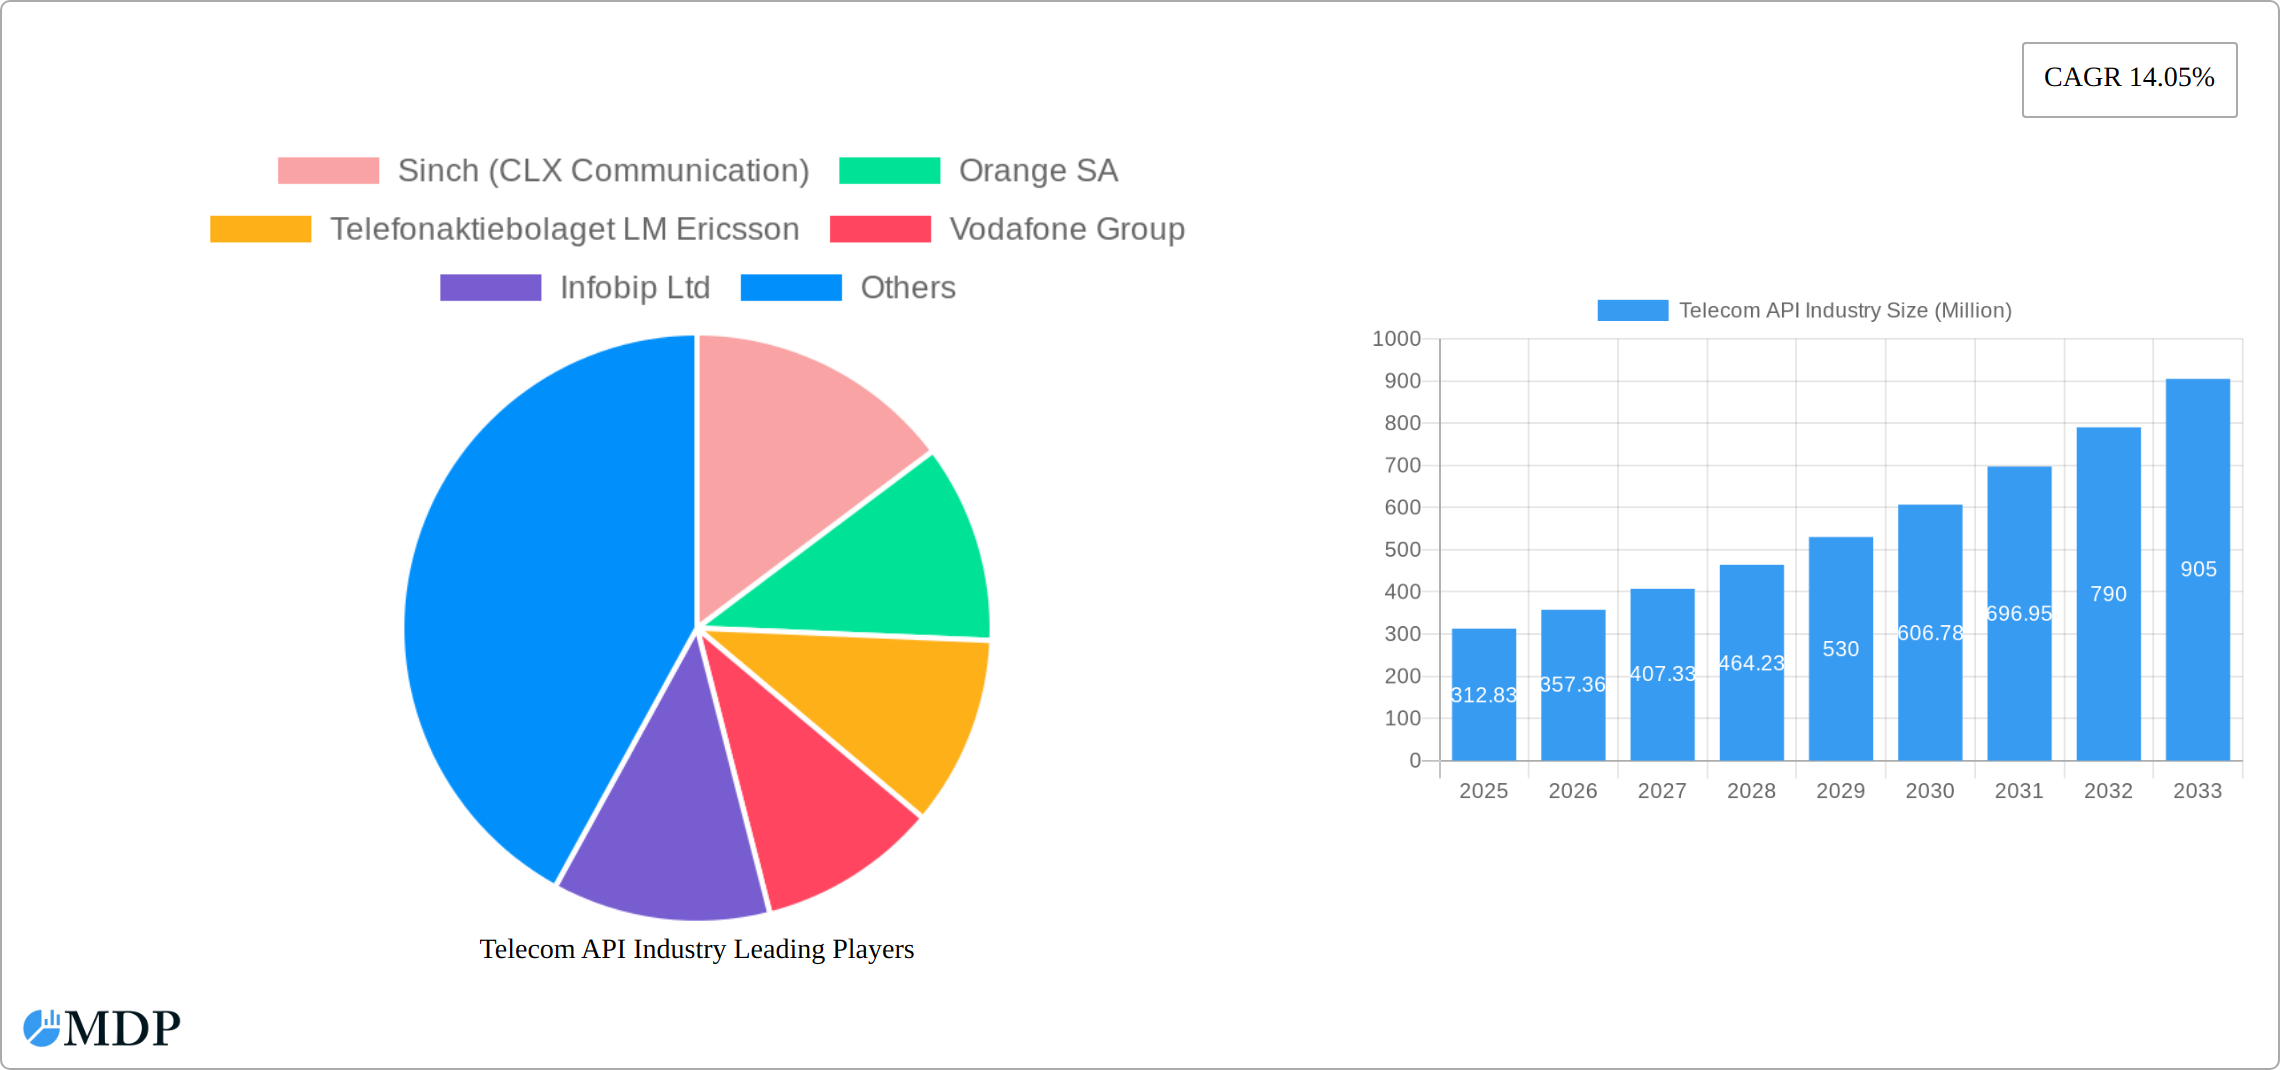
Telecom API Industry Market Size (In Million)
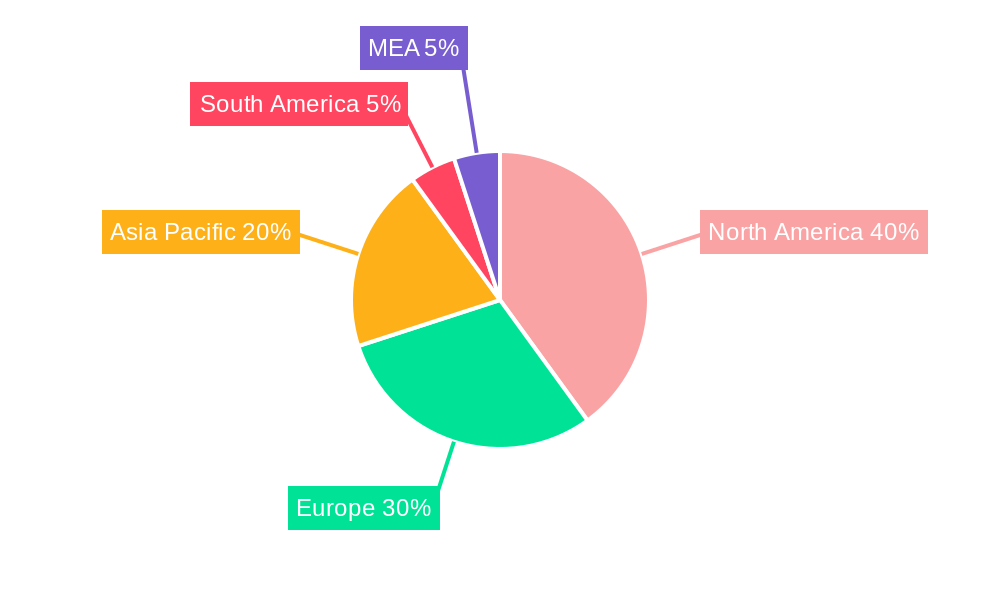
Growth is expected to be particularly strong in regions with high mobile penetration and expanding digital economies. North America and Asia Pacific are projected to remain dominant regions, driven by substantial investments in digital infrastructure and a thriving developer ecosystem. However, Europe and other regions are also expected to witness significant growth, particularly as businesses increasingly recognize the value of integrating telecom APIs into their operations for improved efficiency and customer experience. Challenges, including concerns around data security and privacy, along with the complexities of integrating diverse API technologies, are expected to be addressed through technological advancements and enhanced regulatory frameworks. The continued innovation in areas like 5G technology and the Internet of Things (IoT) is poised to further propel the market's growth trajectory, creating opportunities for new API functionalities and applications.
Telecom API Industry Company Market Share
Telecom API Industry: A Comprehensive Market Report (2019-2033)
This in-depth report provides a comprehensive analysis of the Telecom API industry, covering market dynamics, leading players, emerging trends, and future growth prospects. With a study period spanning 2019-2033, a base year of 2025, and a forecast period of 2025-2033, this report is an invaluable resource for industry stakeholders, investors, and businesses seeking to understand this rapidly evolving market. The report leverages extensive data analysis to provide actionable insights, predicting a market valued at xx Million by 2033.
Telecom API Industry Market Dynamics & Concentration
The Telecom API market exhibits a moderately concentrated landscape, with several key players holding significant market share. However, the market is also characterized by substantial innovation, driving mergers and acquisitions (M&A) activity. The estimated market share for the top 5 players in 2025 is approximately 60%, indicating a competitive yet consolidated structure. Regulatory frameworks, particularly concerning data privacy and security, play a significant role in shaping market dynamics. Product substitutes, such as proprietary communication platforms, pose a degree of competitive pressure. End-user trends, particularly the increasing adoption of cloud-based solutions and digital transformation initiatives across various industries, fuel industry growth.
- M&A Activity: An estimated xx M&A deals occurred within the Telecom API industry between 2019 and 2024. This trend is expected to continue, driven by the desire for market consolidation and expansion into new geographic regions.
- Innovation Drivers: The development and implementation of 5G technology, alongside advancements in artificial intelligence (AI) and machine learning (ML), are major innovation drivers. These innovations enhance the capabilities and applications of Telecom APIs.
- Regulatory Frameworks: Compliance with regulations such as GDPR and CCPA influences API development and deployment strategies. Increased scrutiny around data privacy is impacting how businesses approach API integration and data security.
Telecom API Industry Industry Trends & Analysis
The Telecom API market is experiencing robust growth, fueled by several converging factors. The compound annual growth rate (CAGR) from 2025 to 2033 is projected to be significantly high, resulting in a substantial market value expansion by 2033. This expansion is driven by increasing market penetration across diverse industry verticals, all seeking seamless communication and efficient data integration solutions. Furthermore, technological advancements, particularly the proliferation of 5G and the rise of edge computing, are fundamentally reshaping the competitive landscape. Consumer demand for personalized and omnichannel experiences further intensifies the need for sophisticated Telecom APIs. This dynamic environment sees both established telecom giants and agile startups competing for market share, fostering a climate of continuous innovation and improvement.
Leading Markets & Segments in Telecom API Industry
North America currently holds a leading position in the Telecom API market, propelled by significant technological advancements, robust digital infrastructure, and high enterprise adoption rates. However, the Asia-Pacific region is poised for the most rapid growth throughout the forecast period, presenting substantial opportunities for expansion.
By Type of Service:
- Messaging API: This segment retains a dominant market share, driven by the ubiquitous nature of instant messaging and SMS communication, and continues to evolve with new features and functionalities.
- IVR/Voice Store and Voice Control API: The widespread adoption of voice assistants and the growing sophistication of conversational AI are key drivers for this segment's expansion.
- Payment API: The surge in mobile payments and the expansion of digital commerce are fueling significant growth in this critical area. Secure and seamless payment processing is paramount.
- WebRTC (Real-Time Connection) API: WebRTC continues to gain traction due to the increasing demand for real-time communication applications across various platforms and devices.
- Location and Map API: The increasing reliance on location-based services, from navigation to targeted advertising, consistently boosts demand for precise and reliable location data.
- Subscriber Identity Management and SSO API: The ever-increasing emphasis on robust security and streamlined access management drives substantial growth in this crucial segment.
- Other Types of Service: This category encompasses specialized applications and emerging technologies with high potential for future market expansion.
By Deployment Type:
- Cloud-based deployments: Cloud-based solutions maintain market dominance due to their inherent scalability, cost-effectiveness, and ease of management, offering flexibility and agility.
- Hybrid deployments: Hybrid deployments offer a balanced approach, combining on-premise and cloud-based solutions to cater to the specific needs and security requirements of enterprises.
- On-Premise Deployments: While a smaller share, on-premise solutions remain relevant for organizations with stringent security or regulatory compliance needs.
By End User:
- Enterprise Developers: This segment constitutes a significant portion of the market, with large organizations leveraging APIs for business process automation and digital transformation initiatives.
- Internal Telecom Developers: Telecom providers utilize APIs to enhance internal operational efficiency, develop innovative services, and improve customer experiences.
- Partner Developers: Strategic partnerships between telecom providers and third-party developers drive innovation, expand service offerings, and accelerate market penetration.
- Independent Developers (Long Tail): The thriving community of independent developers contributes significantly to the API ecosystem's dynamism and expansion.
Key Drivers (Regional Variations):
- Government Policies and Regulations: Supportive government initiatives promoting digital infrastructure and technological innovation significantly influence market growth and adoption rates.
- Telecommunications Infrastructure: Robust and reliable telecommunications infrastructure is fundamental for successful API deployment and widespread adoption.
- Economic Factors: Overall economic growth and investment in digital technologies significantly impact market dynamics and potential.
Telecom API Industry Product Developments
Recent product developments focus on enhancing security features, integrating AI/ML capabilities, and expanding API functionality to support emerging technologies such as 5G and IoT. Many providers are focusing on developing platform-agnostic APIs to improve compatibility and ease of integration. This trend is driven by a rising need for simplified development processes and cross-platform compatibility.
Key Drivers of Telecom API Industry Growth
The industry’s expansion is fueled by the increasing demand for seamless communication and data integration across various sectors. Technological advancements like 5G, edge computing, and AI/ML capabilities are significant drivers. Government initiatives promoting digital transformation and favorable economic policies further contribute to the market’s growth. The rise of the Internet of Things (IoT) and the increasing need for real-time communication in various applications are also key factors contributing to the market’s expansion.
Challenges in the Telecom API Industry Market
Intense competition among established players and emerging startups creates a highly dynamic and challenging market. Stringent data security and privacy regulations necessitate ongoing compliance with evolving standards, demanding significant investment in security infrastructure and expertise. Maintaining consistent API performance and scalability while meeting ever-increasing demand requires continuous investment in infrastructure, maintenance, and skilled personnel.
Emerging Opportunities in Telecom API Industry
The integration of AI and ML into Telecom APIs presents immense opportunities for developing intelligent communication solutions. Strategic partnerships between telecom providers and technology companies unlock innovation and expand market reach. Expanding into untapped geographic regions and catering to niche industry verticals provide substantial potential for growth. The increasing adoption of 5G and the associated technological advancements offer avenues for innovative service creation.
Leading Players in the Telecom API Industry Sector
Key Milestones in Telecom API Industry Industry
- February 2024: The GSMA Open Gateway initiative achieved a significant milestone with 47 mobile operator groups (representing 239 mobile networks and 65% of global connections) signing up, showcasing substantial industry progress in 5G network API commercialization and paving the way for greater interoperability and innovation.
- March 2024: Comviva's contributions to 5G-driven API expansion underscore the potential for telecom operators to effectively monetize their 5G networks and create new revenue streams. This marks a crucial step towards wider API adoption and the development of innovative 5G services.
- [Add more recent milestones here with dates and brief descriptions]
Strategic Outlook for Telecom API Industry Market
The Telecom API market is poised for continued growth, driven by technological innovation and increasing demand for integrated communication solutions. Strategic partnerships and investments in research and development will be crucial for maintaining a competitive edge. Expanding into new markets and developing innovative API solutions tailored to specific industry needs will be key strategic priorities for players seeking long-term success. The focus on enhancing security features and data privacy will remain paramount in shaping future market developments.
Telecom API Industry Segmentation
-
1. Type of Service
- 1.1. Messaging API
- 1.2. IVR/Voice Store and Voice Control API
- 1.3. Payment API
- 1.4. WebRTC (Real-Time Connection) API
- 1.5. Location and Map API
- 1.6. Subscriber Identity Management and SSO API
- 1.7. Other Types of Service
-
2. Deployment Type
- 2.1. Hybrid
- 2.2. Multi-cloud
- 2.3. Other Deployment Types
-
3. End User
- 3.1. Enterprise Developer
- 3.2. Internal Telecom Developer
- 3.3. Partner Developer
- 3.4. Long Tail Developer
Telecom API Industry Segmentation By Geography
-
1. North America
- 1.1. United States
- 1.2. Canada
- 1.3. Mexico
-
2. Europe
- 2.1. Germany
- 2.2. United Kingdom
- 2.3. France
- 2.4. Italy
- 2.5. Spain
- 2.6. Rest of Europe
-
3. Asia Pacific
- 3.1. China
- 3.2. South Korea
- 3.3. Australia
- 3.4. New Zealand
- 3.5. India
- 3.6. Thailand
- 3.7. Singapore
- 3.8. Malaysia
- 3.9. Rest of Asia Pacific
-
4. Latin America
- 4.1. Brazil
- 4.2. Argentina
- 4.3. Rest of South America
-
5. Middle East and Africa
- 5.1. UAE
- 5.2. South Africa
- 5.3. Saudi Arabia
- 5.4. Rest Of MEA
Telecom API Industry Regional Market Share
Geographic Coverage of Telecom API Industry
Telecom API Industry REPORT HIGHLIGHTS
| Aspects | Details |
|---|---|
| Study Period | 2020-2034 |
| Base Year | 2025 |
| Estimated Year | 2026 |
| Forecast Period | 2026-2034 |
| Historical Period | 2020-2025 |
| Growth Rate | CAGR of 14.05% from 2020-2034 |
| Segmentation |
|
Table of Contents
- 1. Introduction
- 1.1. Research Scope
- 1.2. Market Segmentation
- 1.3. Research Methodology
- 1.4. Definitions and Assumptions
- 2. Executive Summary
- 2.1. Introduction
- 3. Market Dynamics
- 3.1. Introduction
- 3.2. Market Drivers
- 3.2.1. Increasing Demand for Mobile Data and the Rise of Digital Communication; Advent of 5G technology
- 3.3. Market Restrains
- 3.3.1. Lack of Awareness of Security Services is Discouraging the Market Expansion
- 3.4. Market Trends
- 3.4.1. Hybrid Segment to Hold Considerable Market Shares
- 4. Market Factor Analysis
- 4.1. Porters Five Forces
- 4.2. Supply/Value Chain
- 4.3. PESTEL analysis
- 4.4. Market Entropy
- 4.5. Patent/Trademark Analysis
- 5. Global Telecom API Industry Analysis, Insights and Forecast, 2020-2032
- 5.1. Market Analysis, Insights and Forecast - by Type of Service
- 5.1.1. Messaging API
- 5.1.2. IVR/Voice Store and Voice Control API
- 5.1.3. Payment API
- 5.1.4. WebRTC (Real-Time Connection) API
- 5.1.5. Location and Map API
- 5.1.6. Subscriber Identity Management and SSO API
- 5.1.7. Other Types of Service
- 5.2. Market Analysis, Insights and Forecast - by Deployment Type
- 5.2.1. Hybrid
- 5.2.2. Multi-cloud
- 5.2.3. Other Deployment Types
- 5.3. Market Analysis, Insights and Forecast - by End User
- 5.3.1. Enterprise Developer
- 5.3.2. Internal Telecom Developer
- 5.3.3. Partner Developer
- 5.3.4. Long Tail Developer
- 5.4. Market Analysis, Insights and Forecast - by Region
- 5.4.1. North America
- 5.4.2. Europe
- 5.4.3. Asia Pacific
- 5.4.4. Latin America
- 5.4.5. Middle East and Africa
- 5.1. Market Analysis, Insights and Forecast - by Type of Service
- 6. North America Telecom API Industry Analysis, Insights and Forecast, 2020-2032
- 6.1. Market Analysis, Insights and Forecast - by Type of Service
- 6.1.1. Messaging API
- 6.1.2. IVR/Voice Store and Voice Control API
- 6.1.3. Payment API
- 6.1.4. WebRTC (Real-Time Connection) API
- 6.1.5. Location and Map API
- 6.1.6. Subscriber Identity Management and SSO API
- 6.1.7. Other Types of Service
- 6.2. Market Analysis, Insights and Forecast - by Deployment Type
- 6.2.1. Hybrid
- 6.2.2. Multi-cloud
- 6.2.3. Other Deployment Types
- 6.3. Market Analysis, Insights and Forecast - by End User
- 6.3.1. Enterprise Developer
- 6.3.2. Internal Telecom Developer
- 6.3.3. Partner Developer
- 6.3.4. Long Tail Developer
- 6.1. Market Analysis, Insights and Forecast - by Type of Service
- 7. Europe Telecom API Industry Analysis, Insights and Forecast, 2020-2032
- 7.1. Market Analysis, Insights and Forecast - by Type of Service
- 7.1.1. Messaging API
- 7.1.2. IVR/Voice Store and Voice Control API
- 7.1.3. Payment API
- 7.1.4. WebRTC (Real-Time Connection) API
- 7.1.5. Location and Map API
- 7.1.6. Subscriber Identity Management and SSO API
- 7.1.7. Other Types of Service
- 7.2. Market Analysis, Insights and Forecast - by Deployment Type
- 7.2.1. Hybrid
- 7.2.2. Multi-cloud
- 7.2.3. Other Deployment Types
- 7.3. Market Analysis, Insights and Forecast - by End User
- 7.3.1. Enterprise Developer
- 7.3.2. Internal Telecom Developer
- 7.3.3. Partner Developer
- 7.3.4. Long Tail Developer
- 7.1. Market Analysis, Insights and Forecast - by Type of Service
- 8. Asia Pacific Telecom API Industry Analysis, Insights and Forecast, 2020-2032
- 8.1. Market Analysis, Insights and Forecast - by Type of Service
- 8.1.1. Messaging API
- 8.1.2. IVR/Voice Store and Voice Control API
- 8.1.3. Payment API
- 8.1.4. WebRTC (Real-Time Connection) API
- 8.1.5. Location and Map API
- 8.1.6. Subscriber Identity Management and SSO API
- 8.1.7. Other Types of Service
- 8.2. Market Analysis, Insights and Forecast - by Deployment Type
- 8.2.1. Hybrid
- 8.2.2. Multi-cloud
- 8.2.3. Other Deployment Types
- 8.3. Market Analysis, Insights and Forecast - by End User
- 8.3.1. Enterprise Developer
- 8.3.2. Internal Telecom Developer
- 8.3.3. Partner Developer
- 8.3.4. Long Tail Developer
- 8.1. Market Analysis, Insights and Forecast - by Type of Service
- 9. Latin America Telecom API Industry Analysis, Insights and Forecast, 2020-2032
- 9.1. Market Analysis, Insights and Forecast - by Type of Service
- 9.1.1. Messaging API
- 9.1.2. IVR/Voice Store and Voice Control API
- 9.1.3. Payment API
- 9.1.4. WebRTC (Real-Time Connection) API
- 9.1.5. Location and Map API
- 9.1.6. Subscriber Identity Management and SSO API
- 9.1.7. Other Types of Service
- 9.2. Market Analysis, Insights and Forecast - by Deployment Type
- 9.2.1. Hybrid
- 9.2.2. Multi-cloud
- 9.2.3. Other Deployment Types
- 9.3. Market Analysis, Insights and Forecast - by End User
- 9.3.1. Enterprise Developer
- 9.3.2. Internal Telecom Developer
- 9.3.3. Partner Developer
- 9.3.4. Long Tail Developer
- 9.1. Market Analysis, Insights and Forecast - by Type of Service
- 10. Middle East and Africa Telecom API Industry Analysis, Insights and Forecast, 2020-2032
- 10.1. Market Analysis, Insights and Forecast - by Type of Service
- 10.1.1. Messaging API
- 10.1.2. IVR/Voice Store and Voice Control API
- 10.1.3. Payment API
- 10.1.4. WebRTC (Real-Time Connection) API
- 10.1.5. Location and Map API
- 10.1.6. Subscriber Identity Management and SSO API
- 10.1.7. Other Types of Service
- 10.2. Market Analysis, Insights and Forecast - by Deployment Type
- 10.2.1. Hybrid
- 10.2.2. Multi-cloud
- 10.2.3. Other Deployment Types
- 10.3. Market Analysis, Insights and Forecast - by End User
- 10.3.1. Enterprise Developer
- 10.3.2. Internal Telecom Developer
- 10.3.3. Partner Developer
- 10.3.4. Long Tail Developer
- 10.1. Market Analysis, Insights and Forecast - by Type of Service
- 11. Competitive Analysis
- 11.1. Global Market Share Analysis 2025
- 11.2. Company Profiles
- 11.2.1 Sinch (CLX Communication)
- 11.2.1.1. Overview
- 11.2.1.2. Products
- 11.2.1.3. SWOT Analysis
- 11.2.1.4. Recent Developments
- 11.2.1.5. Financials (Based on Availability)
- 11.2.2 Orange SA
- 11.2.2.1. Overview
- 11.2.2.2. Products
- 11.2.2.3. SWOT Analysis
- 11.2.2.4. Recent Developments
- 11.2.2.5. Financials (Based on Availability)
- 11.2.3 Telefonaktiebolaget LM Ericsson
- 11.2.3.1. Overview
- 11.2.3.2. Products
- 11.2.3.3. SWOT Analysis
- 11.2.3.4. Recent Developments
- 11.2.3.5. Financials (Based on Availability)
- 11.2.4 Vodafone Group
- 11.2.4.1. Overview
- 11.2.4.2. Products
- 11.2.4.3. SWOT Analysis
- 11.2.4.4. Recent Developments
- 11.2.4.5. Financials (Based on Availability)
- 11.2.5 Infobip Ltd
- 11.2.5.1. Overview
- 11.2.5.2. Products
- 11.2.5.3. SWOT Analysis
- 11.2.5.4. Recent Developments
- 11.2.5.5. Financials (Based on Availability)
- 11.2.6 Cisco Systems Inc
- 11.2.6.1. Overview
- 11.2.6.2. Products
- 11.2.6.3. SWOT Analysis
- 11.2.6.4. Recent Developments
- 11.2.6.5. Financials (Based on Availability)
- 11.2.7 Verizon Communications Inc
- 11.2.7.1. Overview
- 11.2.7.2. Products
- 11.2.7.3. SWOT Analysis
- 11.2.7.4. Recent Developments
- 11.2.7.5. Financials (Based on Availability)
- 11.2.8 Twilio Inc
- 11.2.8.1. Overview
- 11.2.8.2. Products
- 11.2.8.3. SWOT Analysis
- 11.2.8.4. Recent Developments
- 11.2.8.5. Financials (Based on Availability)
- 11.2.9 Ribbon Communications
- 11.2.9.1. Overview
- 11.2.9.2. Products
- 11.2.9.3. SWOT Analysis
- 11.2.9.4. Recent Developments
- 11.2.9.5. Financials (Based on Availability)
- 11.2.10 Noki
- 11.2.10.1. Overview
- 11.2.10.2. Products
- 11.2.10.3. SWOT Analysis
- 11.2.10.4. Recent Developments
- 11.2.10.5. Financials (Based on Availability)
- 11.2.11 Deutsche Telekom AG
- 11.2.11.1. Overview
- 11.2.11.2. Products
- 11.2.11.3. SWOT Analysis
- 11.2.11.4. Recent Developments
- 11.2.11.5. Financials (Based on Availability)
- 11.2.12 Google LLC (Apigee Corporation)
- 11.2.12.1. Overview
- 11.2.12.2. Products
- 11.2.12.3. SWOT Analysis
- 11.2.12.4. Recent Developments
- 11.2.12.5. Financials (Based on Availability)
- 11.2.13 Huawei Technologies Co Ltd
- 11.2.13.1. Overview
- 11.2.13.2. Products
- 11.2.13.3. SWOT Analysis
- 11.2.13.4. Recent Developments
- 11.2.13.5. Financials (Based on Availability)
- 11.2.14 AT&T Inc
- 11.2.14.1. Overview
- 11.2.14.2. Products
- 11.2.14.3. SWOT Analysis
- 11.2.14.4. Recent Developments
- 11.2.14.5. Financials (Based on Availability)
- 11.2.15 Telefonica SA
- 11.2.15.1. Overview
- 11.2.15.2. Products
- 11.2.15.3. SWOT Analysis
- 11.2.15.4. Recent Developments
- 11.2.15.5. Financials (Based on Availability)
- 11.2.1 Sinch (CLX Communication)
List of Figures
- Figure 1: Global Telecom API Industry Revenue Breakdown (Million, %) by Region 2025 & 2033
- Figure 2: Global Telecom API Industry Volume Breakdown (K Unit, %) by Region 2025 & 2033
- Figure 3: North America Telecom API Industry Revenue (Million), by Type of Service 2025 & 2033
- Figure 4: North America Telecom API Industry Volume (K Unit), by Type of Service 2025 & 2033
- Figure 5: North America Telecom API Industry Revenue Share (%), by Type of Service 2025 & 2033
- Figure 6: North America Telecom API Industry Volume Share (%), by Type of Service 2025 & 2033
- Figure 7: North America Telecom API Industry Revenue (Million), by Deployment Type 2025 & 2033
- Figure 8: North America Telecom API Industry Volume (K Unit), by Deployment Type 2025 & 2033
- Figure 9: North America Telecom API Industry Revenue Share (%), by Deployment Type 2025 & 2033
- Figure 10: North America Telecom API Industry Volume Share (%), by Deployment Type 2025 & 2033
- Figure 11: North America Telecom API Industry Revenue (Million), by End User 2025 & 2033
- Figure 12: North America Telecom API Industry Volume (K Unit), by End User 2025 & 2033
- Figure 13: North America Telecom API Industry Revenue Share (%), by End User 2025 & 2033
- Figure 14: North America Telecom API Industry Volume Share (%), by End User 2025 & 2033
- Figure 15: North America Telecom API Industry Revenue (Million), by Country 2025 & 2033
- Figure 16: North America Telecom API Industry Volume (K Unit), by Country 2025 & 2033
- Figure 17: North America Telecom API Industry Revenue Share (%), by Country 2025 & 2033
- Figure 18: North America Telecom API Industry Volume Share (%), by Country 2025 & 2033
- Figure 19: Europe Telecom API Industry Revenue (Million), by Type of Service 2025 & 2033
- Figure 20: Europe Telecom API Industry Volume (K Unit), by Type of Service 2025 & 2033
- Figure 21: Europe Telecom API Industry Revenue Share (%), by Type of Service 2025 & 2033
- Figure 22: Europe Telecom API Industry Volume Share (%), by Type of Service 2025 & 2033
- Figure 23: Europe Telecom API Industry Revenue (Million), by Deployment Type 2025 & 2033
- Figure 24: Europe Telecom API Industry Volume (K Unit), by Deployment Type 2025 & 2033
- Figure 25: Europe Telecom API Industry Revenue Share (%), by Deployment Type 2025 & 2033
- Figure 26: Europe Telecom API Industry Volume Share (%), by Deployment Type 2025 & 2033
- Figure 27: Europe Telecom API Industry Revenue (Million), by End User 2025 & 2033
- Figure 28: Europe Telecom API Industry Volume (K Unit), by End User 2025 & 2033
- Figure 29: Europe Telecom API Industry Revenue Share (%), by End User 2025 & 2033
- Figure 30: Europe Telecom API Industry Volume Share (%), by End User 2025 & 2033
- Figure 31: Europe Telecom API Industry Revenue (Million), by Country 2025 & 2033
- Figure 32: Europe Telecom API Industry Volume (K Unit), by Country 2025 & 2033
- Figure 33: Europe Telecom API Industry Revenue Share (%), by Country 2025 & 2033
- Figure 34: Europe Telecom API Industry Volume Share (%), by Country 2025 & 2033
- Figure 35: Asia Pacific Telecom API Industry Revenue (Million), by Type of Service 2025 & 2033
- Figure 36: Asia Pacific Telecom API Industry Volume (K Unit), by Type of Service 2025 & 2033
- Figure 37: Asia Pacific Telecom API Industry Revenue Share (%), by Type of Service 2025 & 2033
- Figure 38: Asia Pacific Telecom API Industry Volume Share (%), by Type of Service 2025 & 2033
- Figure 39: Asia Pacific Telecom API Industry Revenue (Million), by Deployment Type 2025 & 2033
- Figure 40: Asia Pacific Telecom API Industry Volume (K Unit), by Deployment Type 2025 & 2033
- Figure 41: Asia Pacific Telecom API Industry Revenue Share (%), by Deployment Type 2025 & 2033
- Figure 42: Asia Pacific Telecom API Industry Volume Share (%), by Deployment Type 2025 & 2033
- Figure 43: Asia Pacific Telecom API Industry Revenue (Million), by End User 2025 & 2033
- Figure 44: Asia Pacific Telecom API Industry Volume (K Unit), by End User 2025 & 2033
- Figure 45: Asia Pacific Telecom API Industry Revenue Share (%), by End User 2025 & 2033
- Figure 46: Asia Pacific Telecom API Industry Volume Share (%), by End User 2025 & 2033
- Figure 47: Asia Pacific Telecom API Industry Revenue (Million), by Country 2025 & 2033
- Figure 48: Asia Pacific Telecom API Industry Volume (K Unit), by Country 2025 & 2033
- Figure 49: Asia Pacific Telecom API Industry Revenue Share (%), by Country 2025 & 2033
- Figure 50: Asia Pacific Telecom API Industry Volume Share (%), by Country 2025 & 2033
- Figure 51: Latin America Telecom API Industry Revenue (Million), by Type of Service 2025 & 2033
- Figure 52: Latin America Telecom API Industry Volume (K Unit), by Type of Service 2025 & 2033
- Figure 53: Latin America Telecom API Industry Revenue Share (%), by Type of Service 2025 & 2033
- Figure 54: Latin America Telecom API Industry Volume Share (%), by Type of Service 2025 & 2033
- Figure 55: Latin America Telecom API Industry Revenue (Million), by Deployment Type 2025 & 2033
- Figure 56: Latin America Telecom API Industry Volume (K Unit), by Deployment Type 2025 & 2033
- Figure 57: Latin America Telecom API Industry Revenue Share (%), by Deployment Type 2025 & 2033
- Figure 58: Latin America Telecom API Industry Volume Share (%), by Deployment Type 2025 & 2033
- Figure 59: Latin America Telecom API Industry Revenue (Million), by End User 2025 & 2033
- Figure 60: Latin America Telecom API Industry Volume (K Unit), by End User 2025 & 2033
- Figure 61: Latin America Telecom API Industry Revenue Share (%), by End User 2025 & 2033
- Figure 62: Latin America Telecom API Industry Volume Share (%), by End User 2025 & 2033
- Figure 63: Latin America Telecom API Industry Revenue (Million), by Country 2025 & 2033
- Figure 64: Latin America Telecom API Industry Volume (K Unit), by Country 2025 & 2033
- Figure 65: Latin America Telecom API Industry Revenue Share (%), by Country 2025 & 2033
- Figure 66: Latin America Telecom API Industry Volume Share (%), by Country 2025 & 2033
- Figure 67: Middle East and Africa Telecom API Industry Revenue (Million), by Type of Service 2025 & 2033
- Figure 68: Middle East and Africa Telecom API Industry Volume (K Unit), by Type of Service 2025 & 2033
- Figure 69: Middle East and Africa Telecom API Industry Revenue Share (%), by Type of Service 2025 & 2033
- Figure 70: Middle East and Africa Telecom API Industry Volume Share (%), by Type of Service 2025 & 2033
- Figure 71: Middle East and Africa Telecom API Industry Revenue (Million), by Deployment Type 2025 & 2033
- Figure 72: Middle East and Africa Telecom API Industry Volume (K Unit), by Deployment Type 2025 & 2033
- Figure 73: Middle East and Africa Telecom API Industry Revenue Share (%), by Deployment Type 2025 & 2033
- Figure 74: Middle East and Africa Telecom API Industry Volume Share (%), by Deployment Type 2025 & 2033
- Figure 75: Middle East and Africa Telecom API Industry Revenue (Million), by End User 2025 & 2033
- Figure 76: Middle East and Africa Telecom API Industry Volume (K Unit), by End User 2025 & 2033
- Figure 77: Middle East and Africa Telecom API Industry Revenue Share (%), by End User 2025 & 2033
- Figure 78: Middle East and Africa Telecom API Industry Volume Share (%), by End User 2025 & 2033
- Figure 79: Middle East and Africa Telecom API Industry Revenue (Million), by Country 2025 & 2033
- Figure 80: Middle East and Africa Telecom API Industry Volume (K Unit), by Country 2025 & 2033
- Figure 81: Middle East and Africa Telecom API Industry Revenue Share (%), by Country 2025 & 2033
- Figure 82: Middle East and Africa Telecom API Industry Volume Share (%), by Country 2025 & 2033
List of Tables
- Table 1: Global Telecom API Industry Revenue Million Forecast, by Type of Service 2020 & 2033
- Table 2: Global Telecom API Industry Volume K Unit Forecast, by Type of Service 2020 & 2033
- Table 3: Global Telecom API Industry Revenue Million Forecast, by Deployment Type 2020 & 2033
- Table 4: Global Telecom API Industry Volume K Unit Forecast, by Deployment Type 2020 & 2033
- Table 5: Global Telecom API Industry Revenue Million Forecast, by End User 2020 & 2033
- Table 6: Global Telecom API Industry Volume K Unit Forecast, by End User 2020 & 2033
- Table 7: Global Telecom API Industry Revenue Million Forecast, by Region 2020 & 2033
- Table 8: Global Telecom API Industry Volume K Unit Forecast, by Region 2020 & 2033
- Table 9: Global Telecom API Industry Revenue Million Forecast, by Type of Service 2020 & 2033
- Table 10: Global Telecom API Industry Volume K Unit Forecast, by Type of Service 2020 & 2033
- Table 11: Global Telecom API Industry Revenue Million Forecast, by Deployment Type 2020 & 2033
- Table 12: Global Telecom API Industry Volume K Unit Forecast, by Deployment Type 2020 & 2033
- Table 13: Global Telecom API Industry Revenue Million Forecast, by End User 2020 & 2033
- Table 14: Global Telecom API Industry Volume K Unit Forecast, by End User 2020 & 2033
- Table 15: Global Telecom API Industry Revenue Million Forecast, by Country 2020 & 2033
- Table 16: Global Telecom API Industry Volume K Unit Forecast, by Country 2020 & 2033
- Table 17: United States Telecom API Industry Revenue (Million) Forecast, by Application 2020 & 2033
- Table 18: United States Telecom API Industry Volume (K Unit) Forecast, by Application 2020 & 2033
- Table 19: Canada Telecom API Industry Revenue (Million) Forecast, by Application 2020 & 2033
- Table 20: Canada Telecom API Industry Volume (K Unit) Forecast, by Application 2020 & 2033
- Table 21: Mexico Telecom API Industry Revenue (Million) Forecast, by Application 2020 & 2033
- Table 22: Mexico Telecom API Industry Volume (K Unit) Forecast, by Application 2020 & 2033
- Table 23: Global Telecom API Industry Revenue Million Forecast, by Type of Service 2020 & 2033
- Table 24: Global Telecom API Industry Volume K Unit Forecast, by Type of Service 2020 & 2033
- Table 25: Global Telecom API Industry Revenue Million Forecast, by Deployment Type 2020 & 2033
- Table 26: Global Telecom API Industry Volume K Unit Forecast, by Deployment Type 2020 & 2033
- Table 27: Global Telecom API Industry Revenue Million Forecast, by End User 2020 & 2033
- Table 28: Global Telecom API Industry Volume K Unit Forecast, by End User 2020 & 2033
- Table 29: Global Telecom API Industry Revenue Million Forecast, by Country 2020 & 2033
- Table 30: Global Telecom API Industry Volume K Unit Forecast, by Country 2020 & 2033
- Table 31: Germany Telecom API Industry Revenue (Million) Forecast, by Application 2020 & 2033
- Table 32: Germany Telecom API Industry Volume (K Unit) Forecast, by Application 2020 & 2033
- Table 33: United Kingdom Telecom API Industry Revenue (Million) Forecast, by Application 2020 & 2033
- Table 34: United Kingdom Telecom API Industry Volume (K Unit) Forecast, by Application 2020 & 2033
- Table 35: France Telecom API Industry Revenue (Million) Forecast, by Application 2020 & 2033
- Table 36: France Telecom API Industry Volume (K Unit) Forecast, by Application 2020 & 2033
- Table 37: Italy Telecom API Industry Revenue (Million) Forecast, by Application 2020 & 2033
- Table 38: Italy Telecom API Industry Volume (K Unit) Forecast, by Application 2020 & 2033
- Table 39: Spain Telecom API Industry Revenue (Million) Forecast, by Application 2020 & 2033
- Table 40: Spain Telecom API Industry Volume (K Unit) Forecast, by Application 2020 & 2033
- Table 41: Rest of Europe Telecom API Industry Revenue (Million) Forecast, by Application 2020 & 2033
- Table 42: Rest of Europe Telecom API Industry Volume (K Unit) Forecast, by Application 2020 & 2033
- Table 43: Global Telecom API Industry Revenue Million Forecast, by Type of Service 2020 & 2033
- Table 44: Global Telecom API Industry Volume K Unit Forecast, by Type of Service 2020 & 2033
- Table 45: Global Telecom API Industry Revenue Million Forecast, by Deployment Type 2020 & 2033
- Table 46: Global Telecom API Industry Volume K Unit Forecast, by Deployment Type 2020 & 2033
- Table 47: Global Telecom API Industry Revenue Million Forecast, by End User 2020 & 2033
- Table 48: Global Telecom API Industry Volume K Unit Forecast, by End User 2020 & 2033
- Table 49: Global Telecom API Industry Revenue Million Forecast, by Country 2020 & 2033
- Table 50: Global Telecom API Industry Volume K Unit Forecast, by Country 2020 & 2033
- Table 51: China Telecom API Industry Revenue (Million) Forecast, by Application 2020 & 2033
- Table 52: China Telecom API Industry Volume (K Unit) Forecast, by Application 2020 & 2033
- Table 53: South Korea Telecom API Industry Revenue (Million) Forecast, by Application 2020 & 2033
- Table 54: South Korea Telecom API Industry Volume (K Unit) Forecast, by Application 2020 & 2033
- Table 55: Australia Telecom API Industry Revenue (Million) Forecast, by Application 2020 & 2033
- Table 56: Australia Telecom API Industry Volume (K Unit) Forecast, by Application 2020 & 2033
- Table 57: New Zealand Telecom API Industry Revenue (Million) Forecast, by Application 2020 & 2033
- Table 58: New Zealand Telecom API Industry Volume (K Unit) Forecast, by Application 2020 & 2033
- Table 59: India Telecom API Industry Revenue (Million) Forecast, by Application 2020 & 2033
- Table 60: India Telecom API Industry Volume (K Unit) Forecast, by Application 2020 & 2033
- Table 61: Thailand Telecom API Industry Revenue (Million) Forecast, by Application 2020 & 2033
- Table 62: Thailand Telecom API Industry Volume (K Unit) Forecast, by Application 2020 & 2033
- Table 63: Singapore Telecom API Industry Revenue (Million) Forecast, by Application 2020 & 2033
- Table 64: Singapore Telecom API Industry Volume (K Unit) Forecast, by Application 2020 & 2033
- Table 65: Malaysia Telecom API Industry Revenue (Million) Forecast, by Application 2020 & 2033
- Table 66: Malaysia Telecom API Industry Volume (K Unit) Forecast, by Application 2020 & 2033
- Table 67: Rest of Asia Pacific Telecom API Industry Revenue (Million) Forecast, by Application 2020 & 2033
- Table 68: Rest of Asia Pacific Telecom API Industry Volume (K Unit) Forecast, by Application 2020 & 2033
- Table 69: Global Telecom API Industry Revenue Million Forecast, by Type of Service 2020 & 2033
- Table 70: Global Telecom API Industry Volume K Unit Forecast, by Type of Service 2020 & 2033
- Table 71: Global Telecom API Industry Revenue Million Forecast, by Deployment Type 2020 & 2033
- Table 72: Global Telecom API Industry Volume K Unit Forecast, by Deployment Type 2020 & 2033
- Table 73: Global Telecom API Industry Revenue Million Forecast, by End User 2020 & 2033
- Table 74: Global Telecom API Industry Volume K Unit Forecast, by End User 2020 & 2033
- Table 75: Global Telecom API Industry Revenue Million Forecast, by Country 2020 & 2033
- Table 76: Global Telecom API Industry Volume K Unit Forecast, by Country 2020 & 2033
- Table 77: Brazil Telecom API Industry Revenue (Million) Forecast, by Application 2020 & 2033
- Table 78: Brazil Telecom API Industry Volume (K Unit) Forecast, by Application 2020 & 2033
- Table 79: Argentina Telecom API Industry Revenue (Million) Forecast, by Application 2020 & 2033
- Table 80: Argentina Telecom API Industry Volume (K Unit) Forecast, by Application 2020 & 2033
- Table 81: Rest of South America Telecom API Industry Revenue (Million) Forecast, by Application 2020 & 2033
- Table 82: Rest of South America Telecom API Industry Volume (K Unit) Forecast, by Application 2020 & 2033
- Table 83: Global Telecom API Industry Revenue Million Forecast, by Type of Service 2020 & 2033
- Table 84: Global Telecom API Industry Volume K Unit Forecast, by Type of Service 2020 & 2033
- Table 85: Global Telecom API Industry Revenue Million Forecast, by Deployment Type 2020 & 2033
- Table 86: Global Telecom API Industry Volume K Unit Forecast, by Deployment Type 2020 & 2033
- Table 87: Global Telecom API Industry Revenue Million Forecast, by End User 2020 & 2033
- Table 88: Global Telecom API Industry Volume K Unit Forecast, by End User 2020 & 2033
- Table 89: Global Telecom API Industry Revenue Million Forecast, by Country 2020 & 2033
- Table 90: Global Telecom API Industry Volume K Unit Forecast, by Country 2020 & 2033
- Table 91: UAE Telecom API Industry Revenue (Million) Forecast, by Application 2020 & 2033
- Table 92: UAE Telecom API Industry Volume (K Unit) Forecast, by Application 2020 & 2033
- Table 93: South Africa Telecom API Industry Revenue (Million) Forecast, by Application 2020 & 2033
- Table 94: South Africa Telecom API Industry Volume (K Unit) Forecast, by Application 2020 & 2033
- Table 95: Saudi Arabia Telecom API Industry Revenue (Million) Forecast, by Application 2020 & 2033
- Table 96: Saudi Arabia Telecom API Industry Volume (K Unit) Forecast, by Application 2020 & 2033
- Table 97: Rest Of MEA Telecom API Industry Revenue (Million) Forecast, by Application 2020 & 2033
- Table 98: Rest Of MEA Telecom API Industry Volume (K Unit) Forecast, by Application 2020 & 2033
Frequently Asked Questions
1. What is the projected Compound Annual Growth Rate (CAGR) of the Telecom API Industry?
The projected CAGR is approximately 14.05%.
2. Which companies are prominent players in the Telecom API Industry?
Key companies in the market include Sinch (CLX Communication), Orange SA, Telefonaktiebolaget LM Ericsson, Vodafone Group, Infobip Ltd, Cisco Systems Inc, Verizon Communications Inc, Twilio Inc, Ribbon Communications, Noki, Deutsche Telekom AG, Google LLC (Apigee Corporation), Huawei Technologies Co Ltd, AT&T Inc, Telefonica SA.
3. What are the main segments of the Telecom API Industry?
The market segments include Type of Service, Deployment Type, End User.
4. Can you provide details about the market size?
The market size is estimated to be USD 312.83 Million as of 2022.
5. What are some drivers contributing to market growth?
Increasing Demand for Mobile Data and the Rise of Digital Communication; Advent of 5G technology.
6. What are the notable trends driving market growth?
Hybrid Segment to Hold Considerable Market Shares.
7. Are there any restraints impacting market growth?
Lack of Awareness of Security Services is Discouraging the Market Expansion.
8. Can you provide examples of recent developments in the market?
March 2024: Comviva, a provider of operations support systems (OSS) and business support systems (BSS), contributed to the expansion of application programming interfaces (APIs) driven by 5G, which is likely to help telecom operators monetize their fifth-generation networks.
9. What pricing options are available for accessing the report?
Pricing options include single-user, multi-user, and enterprise licenses priced at USD 4750, USD 5250, and USD 8750 respectively.
10. Is the market size provided in terms of value or volume?
The market size is provided in terms of value, measured in Million and volume, measured in K Unit.
11. Are there any specific market keywords associated with the report?
Yes, the market keyword associated with the report is "Telecom API Industry," which aids in identifying and referencing the specific market segment covered.
12. How do I determine which pricing option suits my needs best?
The pricing options vary based on user requirements and access needs. Individual users may opt for single-user licenses, while businesses requiring broader access may choose multi-user or enterprise licenses for cost-effective access to the report.
13. Are there any additional resources or data provided in the Telecom API Industry report?
While the report offers comprehensive insights, it's advisable to review the specific contents or supplementary materials provided to ascertain if additional resources or data are available.
14. How can I stay updated on further developments or reports in the Telecom API Industry?
To stay informed about further developments, trends, and reports in the Telecom API Industry, consider subscribing to industry newsletters, following relevant companies and organizations, or regularly checking reputable industry news sources and publications.
Methodology
Step 1 - Identification of Relevant Samples Size from Population Database


Step 2 - Approaches for Defining Global Market Size (Value, Volume* & Price*)

Note*: In applicable scenarios
Step 3 - Data Sources
Primary Research
- Web Analytics
- Survey Reports
- Research Institute
- Latest Research Reports
- Opinion Leaders
Secondary Research
- Annual Reports
- White Paper
- Latest Press Release
- Industry Association
- Paid Database
- Investor Presentations

Step 4 - Data Triangulation
Involves using different sources of information in order to increase the validity of a study
These sources are likely to be stakeholders in a program - participants, other researchers, program staff, other community members, and so on.
Then we put all data in single framework & apply various statistical tools to find out the dynamic on the market.
During the analysis stage, feedback from the stakeholder groups would be compared to determine areas of agreement as well as areas of divergence