

Key Insights
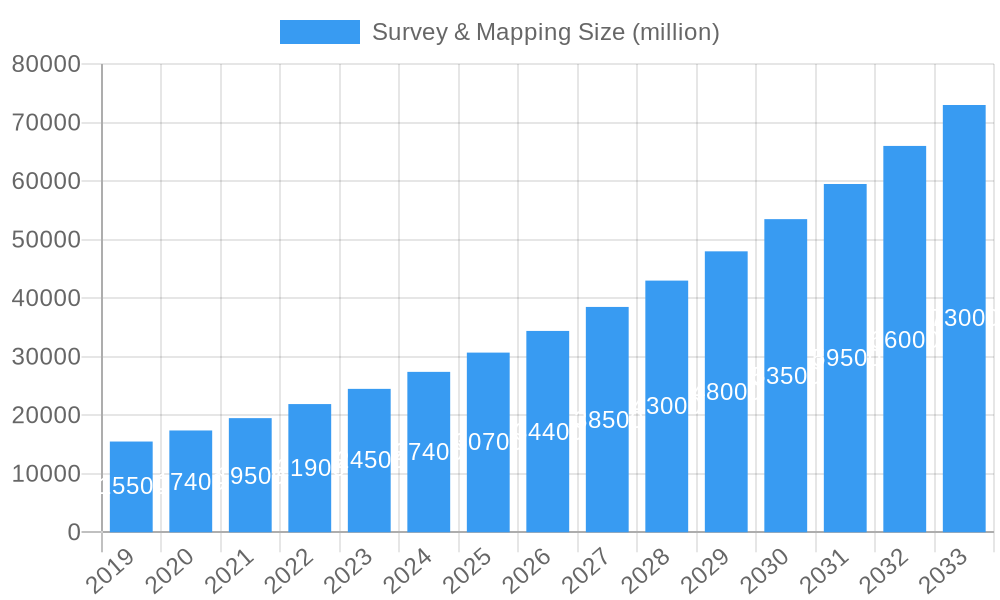
The global Survey & Mapping market is projected for substantial growth, fueled by escalating demand for precise geospatial data across diverse industries. With an estimated market size of $35.59 billion and a Compound Annual Growth Rate (CAGR) of 7.33%, the market is set for significant expansion. Key growth drivers include the construction industry's reliance on accurate surveying for infrastructure and building projects, and the transportation sector's need for detailed mapping. The mining industry's demand for resource exploration and site management, alongside scientific research requiring high-resolution spatial data, further contribute to this upward trend. Innovations in drone-based surveying, satellite imagery analysis, and advanced GIS platforms are enhancing market penetration and operational efficiency.
Survey & Mapping Market Size (In Billion)
Challenges include high initial investment for sophisticated equipment and a shortage of skilled professionals. However, market innovations, such as the adoption of cloud-based platforms and SaaS models, are improving accessibility and reducing costs. Growing awareness of geospatial data's importance in urban planning, environmental monitoring, and disaster management presents new opportunities. The market is segmented by application into Land Surveying, Building Construction, Transportation, Mining, Scientific Research, and Others, with Land Surveying and Building Construction anticipated to lead. By type, Surveying from Space, Aerial Surveying, Terrestrial Surveying, and Underwater Surveying cater to specific needs, with Aerial and Terrestrial Surveying currently holding significant shares. The Asia Pacific region, driven by rapid urbanization and infrastructure development in countries like China and India, is expected to be a high-growth market.
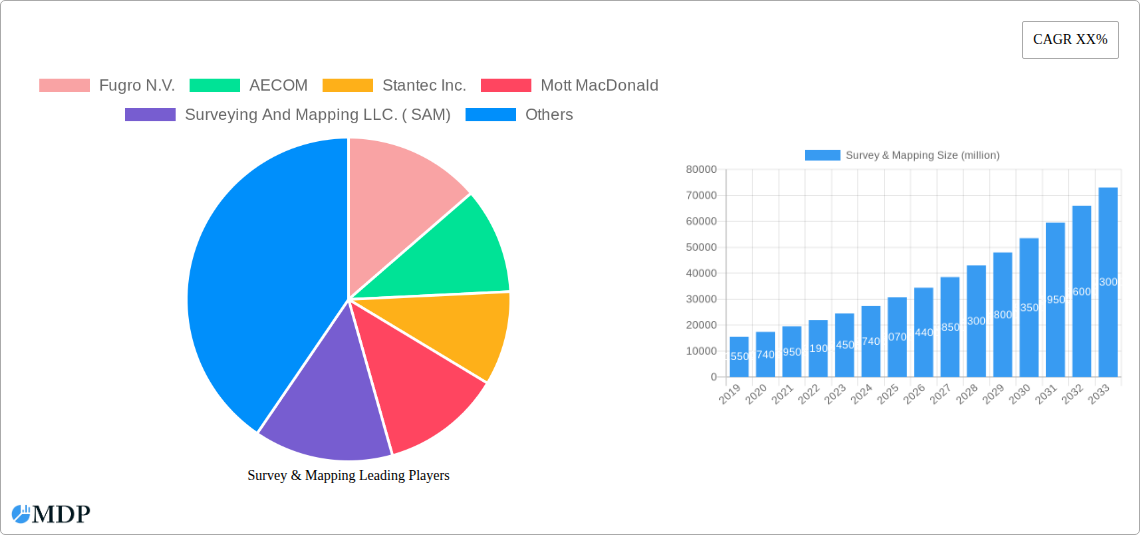
Survey & Mapping Company Market Share
This comprehensive industry report offers an in-depth analysis of the global Surveying and Mapping market, covering trends, technological advancements, and strategic opportunities in geospatial services and land surveying. With a base year of 2025 and a forecast period extending to 2033, this report provides actionable insights for professionals in construction, transportation, mining, scientific research, and other relevant applications, offering a clear roadmap for navigating the evolving surveying and mapping landscape.
Survey & Mapping Market Dynamics & Concentration
The global surveying and mapping market exhibits a moderate concentration, with key players like Fugro N.V., AECOM, and Stantec Inc. holding significant market shares, estimated to be in the range of 15-20% collectively in the base year 2025. Innovation drivers are primarily fueled by advancements in aerial surveying and terrestrial surveying technologies, including the integration of drones and LiDAR. Regulatory frameworks, while varied across regions, are increasingly emphasizing data accuracy and privacy. Product substitutes, such as readily available GIS software and open-source mapping data, pose a competitive threat, though specialized professional services retain a strong foothold. End-user trends indicate a growing demand for real-time data and integrated geospatial solutions across all applications, from land surveying to complex infrastructure projects. Mergers and acquisitions (M&A) activities remain a significant strategy for market consolidation and expansion, with an estimated 10-15 M&A deals annually anticipated throughout the forecast period.
- Market Share of Leading Players (2025): Estimated XX% collectively for top 3 players.
- Annual M&A Deal Count (2025-2033): Projected 10-15 deals per year.
- Key Innovation Drivers: LiDAR, UAVs, AI integration, cloud-based platforms.
- Emerging End-User Trends: Demand for real-time data, digital twins, predictive analytics.
Survey & Mapping Industry Trends & Analysis
The surveying and mapping industry is poised for robust growth, driven by an increasing need for accurate spatial data across a multitude of sectors. The compound annual growth rate (CAGR) is projected to be approximately 8-10% from 2025 to 2033. Technological disruptions are at the forefront of this expansion, with the widespread adoption of drone surveying, advanced LiDAR scanning, and satellite imagery analysis revolutionizing data acquisition speed and precision. AI and machine learning are being integrated to automate data processing and interpretation, leading to more efficient and insightful geospatial analytics. Consumer preferences are shifting towards more accessible, user-friendly, and integrated geospatial solutions, demanding faster turnaround times and higher data resolutions. The competitive dynamics are intensifying, with traditional surveying firms facing competition from technology-driven startups offering specialized services. Market penetration of advanced surveying technologies is expected to reach 60-70% by 2033, particularly in developed economies.
- Projected CAGR (2025-2033): 8-10%.
- Key Technological Disruptions: Drone photogrammetry, mobile mapping systems, cloud computing for data management.
- Shifting Consumer Preferences: Demand for real-time data, predictive insights, and integrated platforms.
- Market Penetration of Advanced Technologies (2033): 60-70%.
Leading Markets & Segments in Survey & Mapping
The Surveying and Mapping market is dominated by the Asia-Pacific region, driven by substantial investments in infrastructure development and rapid urbanization. Within this region, China and India are leading markets, fueled by government initiatives and a growing demand for precise land surveying for urban planning and construction projects. In terms of applications, Land Surveying and Building Construction represent the largest segments, collectively accounting for an estimated 45-50% of the market share in 2025. The transportation industry is another significant driver, with major projects in road, rail, and airport construction demanding extensive aerial surveying and terrestrial surveying for route planning and progress monitoring.
In terms of types, Terrestrial Surveying continues to hold a dominant position due to its widespread application in detailed site surveys and construction. However, Aerial Surveying, particularly using drones, is experiencing rapid growth, offering cost-effectiveness and efficiency for large-scale projects. Surveying from Space plays a crucial role in large-scale mapping, environmental monitoring, and resource management, with applications projected to grow due to advancements in satellite technology and data analytics. Underwater Surveying remains a niche but vital segment, crucial for offshore infrastructure, marine research, and coastal management.
- Dominant Region: Asia-Pacific.
- Leading Countries: China, India.
- Dominant Applications: Land Surveying, Building Construction (estimated 45-50% market share in 2025).
- Fastest Growing Type: Aerial Surveying (driven by drone technology).
- Key Drivers for Dominance:
- Economic Policies: Government investments in infrastructure and urban development.
- Infrastructure Projects: Large-scale construction of roads, bridges, and buildings.
- Technological Adoption: Increasing integration of advanced surveying equipment and software.
- Environmental Regulations: Growing need for accurate environmental mapping and monitoring.
Survey & Mapping Product Developments
The surveying and mapping industry is witnessing a surge in innovative product developments focused on enhancing efficiency, accuracy, and data accessibility. Key advancements include the miniaturization and improved performance of LiDAR sensors, enabling seamless integration with drones for high-density point cloud generation. Furthermore, the development of AI-powered software solutions is automating data processing, feature extraction, and quality control, significantly reducing manual effort and time. Cloud-based platforms are gaining traction, facilitating collaborative workflows and real-time data sharing among project stakeholders. These innovations offer competitive advantages by providing clients with richer datasets, faster project completion, and more informed decision-making capabilities.
Key Drivers of Survey & Mapping Growth
The surveying and mapping market is propelled by several interconnected growth drivers. Technological advancements, particularly in drone technology, LiDAR, GPS, and photogrammetry, are continuously enhancing data acquisition capabilities and accuracy. Economic factors, such as substantial government investments in infrastructure projects worldwide, including transportation networks, smart cities, and renewable energy facilities, are creating sustained demand. Regulatory frameworks that mandate precise land registration, property boundaries, and environmental impact assessments also contribute to market expansion. The increasing adoption of geospatial technologies for scientific research, urban planning, and disaster management further fuels growth, creating a robust ecosystem for the geospatial industry.
- Technological Advancements: Enhanced accuracy and efficiency of drone, LiDAR, and GPS systems.
- Economic Investments: Global infrastructure development, smart city initiatives, and renewable energy projects.
- Regulatory Mandates: Land registration, environmental compliance, and construction safety standards.
- Industry Adoption: Growing use in scientific research, urban planning, and disaster management.
Challenges in the Survey & Mapping Market
Despite its robust growth, the surveying and mapping market faces several challenges. Regulatory hurdles, including varying licensing requirements and data privacy laws across different jurisdictions, can impede market entry and operational efficiency. Supply chain issues, particularly concerning the availability and cost of advanced hardware components for surveying equipment, can impact project timelines and profitability. Intense competitive pressures, driven by an increasing number of players and the commoditization of basic surveying services, can lead to price wars and reduced profit margins. Furthermore, the need for continuous investment in training and upskilling the workforce to keep pace with rapidly evolving technologies presents a significant operational challenge for many firms.
- Regulatory Hurdles: Complex and diverse licensing and data privacy laws.
- Supply Chain Disruptions: Availability and cost of high-tech surveying equipment components.
- Competitive Pressures: Market saturation and price competition for basic services.
- Talent Acquisition and Retention: Need for skilled professionals in a rapidly evolving technological landscape.
Emerging Opportunities in Survey & Mapping
The surveying and mapping market is brimming with emerging opportunities driven by technological breakthroughs and evolving industry needs. The increasing demand for digital twins of infrastructure and cities presents a significant avenue for growth, requiring highly detailed and accurate 3D geospatial data. Strategic partnerships between surveying firms and AI/ML technology providers can unlock new capabilities in automated data analysis and predictive modeling. Market expansion into developing economies, where infrastructure development is rapidly accelerating, offers substantial untapped potential. Furthermore, the growing emphasis on sustainable development and climate change monitoring necessitates advanced geospatial solutions for environmental impact assessment, resource management, and disaster resilience planning.
Leading Players in the Survey & Mapping Sector
- Fugro N.V.
- AECOM
- Stantec Inc.
- Mott MacDonald
- Surveying And Mapping LLC. ( SAM)
- Quantum Spatial, Inc.
- Timmons Group
- Landpoint, LLC
- PASCO (SECOM)
- Kokusai Kogyo
- Terra Drone
- Cardno Limited
- 40SEVEN
- Aerodata International Surveys
- African Consulting Surveyors
- Alwarqa Survey Engineering
- American Surveying INC
- Apex Surveys
- Asia-Pacific Surveys
- Bayanat for Mapping and Surveying Services
- Blanchard Land Surveying
- Blom Romania
- China Siwei Surveying & Mapping Technology Co Ltd
- China Trans Geomatics Co Ltd
- Compass Surveying and Mapping LLC
- Digmap Geosystems Limited
- Dynamic Map Platform Co Ltd
- Enaar Surveyors Pvt Ltd
- Engemap
- Multivista Systems LLC
Key Milestones in Survey & Mapping Industry
- 2019: Increased adoption of AI in photogrammetry for automated feature extraction.
- 2020: Significant growth in drone-based surveying for infrastructure inspection amidst pandemic.
- 2021: Advancements in LiDAR sensor technology leading to higher point densities and accuracy.
- 2022: Expansion of cloud-based geospatial platforms for collaborative data management.
- 2023: Growing demand for 3D mapping and digital twin creation for urban planning.
- 2024: Integration of machine learning algorithms for predictive maintenance based on survey data.
- 2025: Anticipated surge in demand for real-time geospatial data integration with IoT devices.
- 2026: Expected advancements in sensor fusion for combined aerial and terrestrial data acquisition.
- 2027: Rise of augmented reality (AR) applications in on-site surveying and visualization.
- 2028: Increased focus on geospatial data security and privacy solutions.
- 2029: Development of more sophisticated underwater surveying technologies for deep-sea exploration.
- 2030: Greater integration of satellite imagery with drone data for comprehensive mapping.
- 2031: Emergence of new standards for geospatial data interoperability.
- 2032: Increased use of AI for anomaly detection in large-scale geospatial datasets.
- 2033: Anticipated widespread adoption of autonomous surveying systems.
Strategic Outlook for Survey & Mapping Market
The strategic outlook for the survey & mapping market is exceptionally positive, fueled by ongoing technological innovation and an ever-increasing demand for precise spatial intelligence. Growth accelerators will include the continued integration of AI and machine learning for advanced data analytics, the expansion of drone and IoT technologies for real-time data collection, and the burgeoning development of digital twin applications across various industries. Emerging markets represent a significant opportunity for expansion, particularly in regions undergoing rapid infrastructure development. Strategic investments in research and development, coupled with a focus on talent acquisition and skill development, will be crucial for companies aiming to capitalize on the immense future potential of this dynamic sector.
Survey & Mapping Segmentation
-
1. Application
- 1.1. Land Surveying
- 1.2. Building Construction
- 1.3. Transportation industry
- 1.4. Mining
- 1.5. Scientific Research
- 1.6. Others
-
2. Types
- 2.1. Surveying from Space
- 2.2. Aerial Surveying
- 2.3. Terrestrial Surveying
- 2.4. Underwater Surveying
Survey & Mapping Segmentation By Geography
-
1. North America
- 1.1. United States
- 1.2. Canada
- 1.3. Mexico
-
2. South America
- 2.1. Brazil
- 2.2. Argentina
- 2.3. Rest of South America
-
3. Europe
- 3.1. United Kingdom
- 3.2. Germany
- 3.3. France
- 3.4. Italy
- 3.5. Spain
- 3.6. Russia
- 3.7. Benelux
- 3.8. Nordics
- 3.9. Rest of Europe
-
4. Middle East & Africa
- 4.1. Turkey
- 4.2. Israel
- 4.3. GCC
- 4.4. North Africa
- 4.5. South Africa
- 4.6. Rest of Middle East & Africa
-
5. Asia Pacific
- 5.1. China
- 5.2. India
- 5.3. Japan
- 5.4. South Korea
- 5.5. ASEAN
- 5.6. Oceania
- 5.7. Rest of Asia Pacific
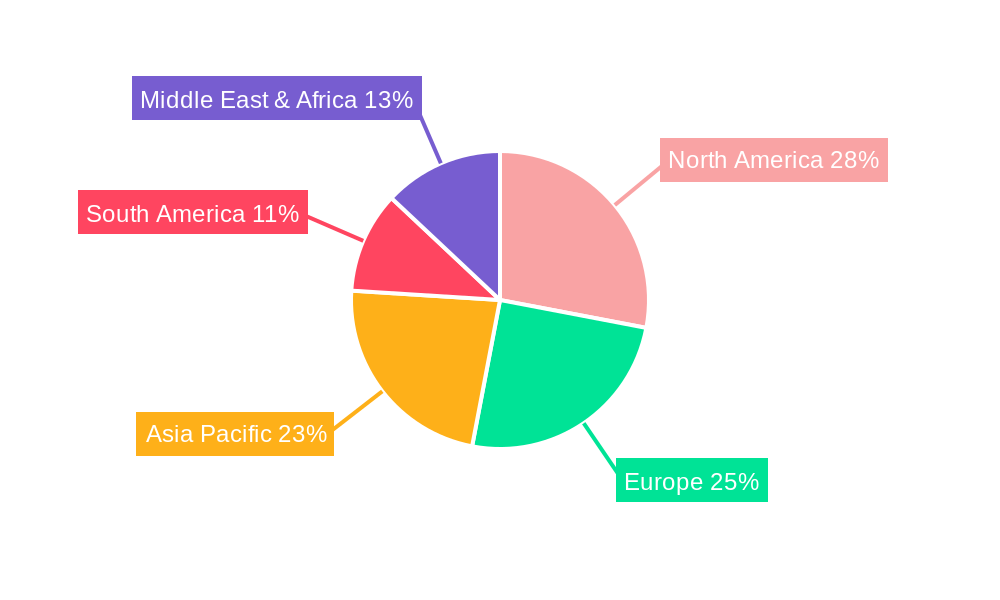
Survey & Mapping Regional Market Share
Geographic Coverage of Survey & Mapping
Survey & Mapping REPORT HIGHLIGHTS
| Aspects | Details |
|---|---|
| Study Period | 2020-2034 |
| Base Year | 2025 |
| Estimated Year | 2026 |
| Forecast Period | 2026-2034 |
| Historical Period | 2020-2025 |
| Growth Rate | CAGR of 7.33% from 2020-2034 |
| Segmentation |
|
Table of Contents
- 1. Introduction
- 1.1. Research Scope
- 1.2. Market Segmentation
- 1.3. Research Objective
- 1.4. Definitions and Assumptions
- 2. Executive Summary
- 2.1. Market Snapshot
- 3. Market Dynamics
- 3.1. Market Drivers
- 3.2. Market Restrains
- 3.3. Market Trends
- 3.4. Market Opportunities
- 4. Market Factor Analysis
- 4.1. Porters Five Forces
- 4.1.1. Bargaining Power of Suppliers
- 4.1.2. Bargaining Power of Buyers
- 4.1.3. Threat of New Entrants
- 4.1.4. Threat of Substitutes
- 4.1.5. Competitive Rivalry
- 4.2. PESTEL analysis
- 4.3. BCG Analysis
- 4.3.1. Stars (High Growth, High Market Share)
- 4.3.2. Cash Cows (Low Growth, High Market Share)
- 4.3.3. Question Mark (High Growth, Low Market Share)
- 4.3.4. Dogs (Low Growth, Low Market Share)
- 4.4. Ansoff Matrix Analysis
- 4.5. Supply Chain Analysis
- 4.6. Regulatory Landscape
- 4.7. Current Market Potential and Opportunity Assessment (TAM–SAM–SOM Framework)
- 4.8. MDP Analyst Note
- 4.1. Porters Five Forces
- 5. Market Analysis, Insights and Forecast 2021-2033
- 5.1. Market Analysis, Insights and Forecast - by Application
- 5.1.1. Land Surveying
- 5.1.2. Building Construction
- 5.1.3. Transportation industry
- 5.1.4. Mining
- 5.1.5. Scientific Research
- 5.1.6. Others
- 5.2. Market Analysis, Insights and Forecast - by Types
- 5.2.1. Surveying from Space
- 5.2.2. Aerial Surveying
- 5.2.3. Terrestrial Surveying
- 5.2.4. Underwater Surveying
- 5.3. Market Analysis, Insights and Forecast - by Region
- 5.3.1. North America
- 5.3.2. South America
- 5.3.3. Europe
- 5.3.4. Middle East & Africa
- 5.3.5. Asia Pacific
- 5.1. Market Analysis, Insights and Forecast - by Application
- 6. Global Survey & Mapping Analysis, Insights and Forecast, 2021-2033
- 6.1. Market Analysis, Insights and Forecast - by Application
- 6.1.1. Land Surveying
- 6.1.2. Building Construction
- 6.1.3. Transportation industry
- 6.1.4. Mining
- 6.1.5. Scientific Research
- 6.1.6. Others
- 6.2. Market Analysis, Insights and Forecast - by Types
- 6.2.1. Surveying from Space
- 6.2.2. Aerial Surveying
- 6.2.3. Terrestrial Surveying
- 6.2.4. Underwater Surveying
- 6.1. Market Analysis, Insights and Forecast - by Application
- 7. North America Survey & Mapping Analysis, Insights and Forecast, 2020-2032
- 7.1. Market Analysis, Insights and Forecast - by Application
- 7.1.1. Land Surveying
- 7.1.2. Building Construction
- 7.1.3. Transportation industry
- 7.1.4. Mining
- 7.1.5. Scientific Research
- 7.1.6. Others
- 7.2. Market Analysis, Insights and Forecast - by Types
- 7.2.1. Surveying from Space
- 7.2.2. Aerial Surveying
- 7.2.3. Terrestrial Surveying
- 7.2.4. Underwater Surveying
- 7.1. Market Analysis, Insights and Forecast - by Application
- 8. South America Survey & Mapping Analysis, Insights and Forecast, 2020-2032
- 8.1. Market Analysis, Insights and Forecast - by Application
- 8.1.1. Land Surveying
- 8.1.2. Building Construction
- 8.1.3. Transportation industry
- 8.1.4. Mining
- 8.1.5. Scientific Research
- 8.1.6. Others
- 8.2. Market Analysis, Insights and Forecast - by Types
- 8.2.1. Surveying from Space
- 8.2.2. Aerial Surveying
- 8.2.3. Terrestrial Surveying
- 8.2.4. Underwater Surveying
- 8.1. Market Analysis, Insights and Forecast - by Application
- 9. Europe Survey & Mapping Analysis, Insights and Forecast, 2020-2032
- 9.1. Market Analysis, Insights and Forecast - by Application
- 9.1.1. Land Surveying
- 9.1.2. Building Construction
- 9.1.3. Transportation industry
- 9.1.4. Mining
- 9.1.5. Scientific Research
- 9.1.6. Others
- 9.2. Market Analysis, Insights and Forecast - by Types
- 9.2.1. Surveying from Space
- 9.2.2. Aerial Surveying
- 9.2.3. Terrestrial Surveying
- 9.2.4. Underwater Surveying
- 9.1. Market Analysis, Insights and Forecast - by Application
- 10. Middle East & Africa Survey & Mapping Analysis, Insights and Forecast, 2020-2032
- 10.1. Market Analysis, Insights and Forecast - by Application
- 10.1.1. Land Surveying
- 10.1.2. Building Construction
- 10.1.3. Transportation industry
- 10.1.4. Mining
- 10.1.5. Scientific Research
- 10.1.6. Others
- 10.2. Market Analysis, Insights and Forecast - by Types
- 10.2.1. Surveying from Space
- 10.2.2. Aerial Surveying
- 10.2.3. Terrestrial Surveying
- 10.2.4. Underwater Surveying
- 10.1. Market Analysis, Insights and Forecast - by Application
- 11. Asia Pacific Survey & Mapping Analysis, Insights and Forecast, 2020-2032
- 11.1. Market Analysis, Insights and Forecast - by Application
- 11.1.1. Land Surveying
- 11.1.2. Building Construction
- 11.1.3. Transportation industry
- 11.1.4. Mining
- 11.1.5. Scientific Research
- 11.1.6. Others
- 11.2. Market Analysis, Insights and Forecast - by Types
- 11.2.1. Surveying from Space
- 11.2.2. Aerial Surveying
- 11.2.3. Terrestrial Surveying
- 11.2.4. Underwater Surveying
- 11.1. Market Analysis, Insights and Forecast - by Application
- 12. Competitive Analysis
- 12.1. Company Profiles
- 12.1.1 Fugro N.V.
- 12.1.1.1. Company Overview
- 12.1.1.2. Products
- 12.1.1.3. Company Financials
- 12.1.1.4. SWOT Analysis
- 12.1.2 AECOM
- 12.1.2.1. Company Overview
- 12.1.2.2. Products
- 12.1.2.3. Company Financials
- 12.1.2.4. SWOT Analysis
- 12.1.3 Stantec Inc.
- 12.1.3.1. Company Overview
- 12.1.3.2. Products
- 12.1.3.3. Company Financials
- 12.1.3.4. SWOT Analysis
- 12.1.4 Mott MacDonald
- 12.1.4.1. Company Overview
- 12.1.4.2. Products
- 12.1.4.3. Company Financials
- 12.1.4.4. SWOT Analysis
- 12.1.5 Surveying And Mapping LLC. ( SAM)
- 12.1.5.1. Company Overview
- 12.1.5.2. Products
- 12.1.5.3. Company Financials
- 12.1.5.4. SWOT Analysis
- 12.1.6 Quantum Spatial
- 12.1.6.1. Company Overview
- 12.1.6.2. Products
- 12.1.6.3. Company Financials
- 12.1.6.4. SWOT Analysis
- 12.1.7 Inc.
- 12.1.7.1. Company Overview
- 12.1.7.2. Products
- 12.1.7.3. Company Financials
- 12.1.7.4. SWOT Analysis
- 12.1.8 Timmons Group
- 12.1.8.1. Company Overview
- 12.1.8.2. Products
- 12.1.8.3. Company Financials
- 12.1.8.4. SWOT Analysis
- 12.1.9 Landpoint
- 12.1.9.1. Company Overview
- 12.1.9.2. Products
- 12.1.9.3. Company Financials
- 12.1.9.4. SWOT Analysis
- 12.1.10 LLC
- 12.1.10.1. Company Overview
- 12.1.10.2. Products
- 12.1.10.3. Company Financials
- 12.1.10.4. SWOT Analysis
- 12.1.11 PASCO (SECOM)
- 12.1.11.1. Company Overview
- 12.1.11.2. Products
- 12.1.11.3. Company Financials
- 12.1.11.4. SWOT Analysis
- 12.1.12 Kokusai Kogyo
- 12.1.12.1. Company Overview
- 12.1.12.2. Products
- 12.1.12.3. Company Financials
- 12.1.12.4. SWOT Analysis
- 12.1.13 Terra Drone
- 12.1.13.1. Company Overview
- 12.1.13.2. Products
- 12.1.13.3. Company Financials
- 12.1.13.4. SWOT Analysis
- 12.1.14 Cardno Limited
- 12.1.14.1. Company Overview
- 12.1.14.2. Products
- 12.1.14.3. Company Financials
- 12.1.14.4. SWOT Analysis
- 12.1.15 40SEVEN
- 12.1.15.1. Company Overview
- 12.1.15.2. Products
- 12.1.15.3. Company Financials
- 12.1.15.4. SWOT Analysis
- 12.1.16 Aerodata International Surveys
- 12.1.16.1. Company Overview
- 12.1.16.2. Products
- 12.1.16.3. Company Financials
- 12.1.16.4. SWOT Analysis
- 12.1.17 African Consulting Surveyors
- 12.1.17.1. Company Overview
- 12.1.17.2. Products
- 12.1.17.3. Company Financials
- 12.1.17.4. SWOT Analysis
- 12.1.18 Alwarqa Survey Engineering
- 12.1.18.1. Company Overview
- 12.1.18.2. Products
- 12.1.18.3. Company Financials
- 12.1.18.4. SWOT Analysis
- 12.1.19 American Surveying INC
- 12.1.19.1. Company Overview
- 12.1.19.2. Products
- 12.1.19.3. Company Financials
- 12.1.19.4. SWOT Analysis
- 12.1.20 Apex Surveys
- 12.1.20.1. Company Overview
- 12.1.20.2. Products
- 12.1.20.3. Company Financials
- 12.1.20.4. SWOT Analysis
- 12.1.21 Asia-Pacific Surveys
- 12.1.21.1. Company Overview
- 12.1.21.2. Products
- 12.1.21.3. Company Financials
- 12.1.21.4. SWOT Analysis
- 12.1.22 Bayanat for Mapping and Surveying Services
- 12.1.22.1. Company Overview
- 12.1.22.2. Products
- 12.1.22.3. Company Financials
- 12.1.22.4. SWOT Analysis
- 12.1.23 Blanchard Land Surveying
- 12.1.23.1. Company Overview
- 12.1.23.2. Products
- 12.1.23.3. Company Financials
- 12.1.23.4. SWOT Analysis
- 12.1.24 Blom Romania
- 12.1.24.1. Company Overview
- 12.1.24.2. Products
- 12.1.24.3. Company Financials
- 12.1.24.4. SWOT Analysis
- 12.1.25 China Siwei Surveying & Mapping Technology Co Ltd
- 12.1.25.1. Company Overview
- 12.1.25.2. Products
- 12.1.25.3. Company Financials
- 12.1.25.4. SWOT Analysis
- 12.1.26 China Trans Geomatics Co Ltd
- 12.1.26.1. Company Overview
- 12.1.26.2. Products
- 12.1.26.3. Company Financials
- 12.1.26.4. SWOT Analysis
- 12.1.27 Compass Surveying and Mapping LLC
- 12.1.27.1. Company Overview
- 12.1.27.2. Products
- 12.1.27.3. Company Financials
- 12.1.27.4. SWOT Analysis
- 12.1.28 Digmap Geosystems Limited
- 12.1.28.1. Company Overview
- 12.1.28.2. Products
- 12.1.28.3. Company Financials
- 12.1.28.4. SWOT Analysis
- 12.1.29 Dynamic Map Platform Co Ltd
- 12.1.29.1. Company Overview
- 12.1.29.2. Products
- 12.1.29.3. Company Financials
- 12.1.29.4. SWOT Analysis
- 12.1.30 Enaar Surveyors Pvt Ltd
- 12.1.30.1. Company Overview
- 12.1.30.2. Products
- 12.1.30.3. Company Financials
- 12.1.30.4. SWOT Analysis
- 12.1.31 Engemap
- 12.1.31.1. Company Overview
- 12.1.31.2. Products
- 12.1.31.3. Company Financials
- 12.1.31.4. SWOT Analysis
- 12.1.32 Multivista Systems LLC
- 12.1.32.1. Company Overview
- 12.1.32.2. Products
- 12.1.32.3. Company Financials
- 12.1.32.4. SWOT Analysis
- 12.1.1 Fugro N.V.
- 12.2. Market Entropy
- 12.2.1 Company's Key Areas Served
- 12.2.2 Recent Developments
- 12.3. Company Market Share Analysis 2025
- 12.3.1 Top 5 Companies Market Share Analysis
- 12.3.2 Top 3 Companies Market Share Analysis
- 12.4. List of Potential Customers
- 13. Research Methodology
List of Figures
- Figure 1: Global Survey & Mapping Revenue Breakdown (billion, %) by Region 2025 & 2033
- Figure 2: North America Survey & Mapping Revenue (billion), by Application 2025 & 2033
- Figure 3: North America Survey & Mapping Revenue Share (%), by Application 2025 & 2033
- Figure 4: North America Survey & Mapping Revenue (billion), by Types 2025 & 2033
- Figure 5: North America Survey & Mapping Revenue Share (%), by Types 2025 & 2033
- Figure 6: North America Survey & Mapping Revenue (billion), by Country 2025 & 2033
- Figure 7: North America Survey & Mapping Revenue Share (%), by Country 2025 & 2033
- Figure 8: South America Survey & Mapping Revenue (billion), by Application 2025 & 2033
- Figure 9: South America Survey & Mapping Revenue Share (%), by Application 2025 & 2033
- Figure 10: South America Survey & Mapping Revenue (billion), by Types 2025 & 2033
- Figure 11: South America Survey & Mapping Revenue Share (%), by Types 2025 & 2033
- Figure 12: South America Survey & Mapping Revenue (billion), by Country 2025 & 2033
- Figure 13: South America Survey & Mapping Revenue Share (%), by Country 2025 & 2033
- Figure 14: Europe Survey & Mapping Revenue (billion), by Application 2025 & 2033
- Figure 15: Europe Survey & Mapping Revenue Share (%), by Application 2025 & 2033
- Figure 16: Europe Survey & Mapping Revenue (billion), by Types 2025 & 2033
- Figure 17: Europe Survey & Mapping Revenue Share (%), by Types 2025 & 2033
- Figure 18: Europe Survey & Mapping Revenue (billion), by Country 2025 & 2033
- Figure 19: Europe Survey & Mapping Revenue Share (%), by Country 2025 & 2033
- Figure 20: Middle East & Africa Survey & Mapping Revenue (billion), by Application 2025 & 2033
- Figure 21: Middle East & Africa Survey & Mapping Revenue Share (%), by Application 2025 & 2033
- Figure 22: Middle East & Africa Survey & Mapping Revenue (billion), by Types 2025 & 2033
- Figure 23: Middle East & Africa Survey & Mapping Revenue Share (%), by Types 2025 & 2033
- Figure 24: Middle East & Africa Survey & Mapping Revenue (billion), by Country 2025 & 2033
- Figure 25: Middle East & Africa Survey & Mapping Revenue Share (%), by Country 2025 & 2033
- Figure 26: Asia Pacific Survey & Mapping Revenue (billion), by Application 2025 & 2033
- Figure 27: Asia Pacific Survey & Mapping Revenue Share (%), by Application 2025 & 2033
- Figure 28: Asia Pacific Survey & Mapping Revenue (billion), by Types 2025 & 2033
- Figure 29: Asia Pacific Survey & Mapping Revenue Share (%), by Types 2025 & 2033
- Figure 30: Asia Pacific Survey & Mapping Revenue (billion), by Country 2025 & 2033
- Figure 31: Asia Pacific Survey & Mapping Revenue Share (%), by Country 2025 & 2033
List of Tables
- Table 1: Global Survey & Mapping Revenue billion Forecast, by Application 2020 & 2033
- Table 2: Global Survey & Mapping Revenue billion Forecast, by Types 2020 & 2033
- Table 3: Global Survey & Mapping Revenue billion Forecast, by Region 2020 & 2033
- Table 4: Global Survey & Mapping Revenue billion Forecast, by Application 2020 & 2033
- Table 5: Global Survey & Mapping Revenue billion Forecast, by Types 2020 & 2033
- Table 6: Global Survey & Mapping Revenue billion Forecast, by Country 2020 & 2033
- Table 7: United States Survey & Mapping Revenue (billion) Forecast, by Application 2020 & 2033
- Table 8: Canada Survey & Mapping Revenue (billion) Forecast, by Application 2020 & 2033
- Table 9: Mexico Survey & Mapping Revenue (billion) Forecast, by Application 2020 & 2033
- Table 10: Global Survey & Mapping Revenue billion Forecast, by Application 2020 & 2033
- Table 11: Global Survey & Mapping Revenue billion Forecast, by Types 2020 & 2033
- Table 12: Global Survey & Mapping Revenue billion Forecast, by Country 2020 & 2033
- Table 13: Brazil Survey & Mapping Revenue (billion) Forecast, by Application 2020 & 2033
- Table 14: Argentina Survey & Mapping Revenue (billion) Forecast, by Application 2020 & 2033
- Table 15: Rest of South America Survey & Mapping Revenue (billion) Forecast, by Application 2020 & 2033
- Table 16: Global Survey & Mapping Revenue billion Forecast, by Application 2020 & 2033
- Table 17: Global Survey & Mapping Revenue billion Forecast, by Types 2020 & 2033
- Table 18: Global Survey & Mapping Revenue billion Forecast, by Country 2020 & 2033
- Table 19: United Kingdom Survey & Mapping Revenue (billion) Forecast, by Application 2020 & 2033
- Table 20: Germany Survey & Mapping Revenue (billion) Forecast, by Application 2020 & 2033
- Table 21: France Survey & Mapping Revenue (billion) Forecast, by Application 2020 & 2033
- Table 22: Italy Survey & Mapping Revenue (billion) Forecast, by Application 2020 & 2033
- Table 23: Spain Survey & Mapping Revenue (billion) Forecast, by Application 2020 & 2033
- Table 24: Russia Survey & Mapping Revenue (billion) Forecast, by Application 2020 & 2033
- Table 25: Benelux Survey & Mapping Revenue (billion) Forecast, by Application 2020 & 2033
- Table 26: Nordics Survey & Mapping Revenue (billion) Forecast, by Application 2020 & 2033
- Table 27: Rest of Europe Survey & Mapping Revenue (billion) Forecast, by Application 2020 & 2033
- Table 28: Global Survey & Mapping Revenue billion Forecast, by Application 2020 & 2033
- Table 29: Global Survey & Mapping Revenue billion Forecast, by Types 2020 & 2033
- Table 30: Global Survey & Mapping Revenue billion Forecast, by Country 2020 & 2033
- Table 31: Turkey Survey & Mapping Revenue (billion) Forecast, by Application 2020 & 2033
- Table 32: Israel Survey & Mapping Revenue (billion) Forecast, by Application 2020 & 2033
- Table 33: GCC Survey & Mapping Revenue (billion) Forecast, by Application 2020 & 2033
- Table 34: North Africa Survey & Mapping Revenue (billion) Forecast, by Application 2020 & 2033
- Table 35: South Africa Survey & Mapping Revenue (billion) Forecast, by Application 2020 & 2033
- Table 36: Rest of Middle East & Africa Survey & Mapping Revenue (billion) Forecast, by Application 2020 & 2033
- Table 37: Global Survey & Mapping Revenue billion Forecast, by Application 2020 & 2033
- Table 38: Global Survey & Mapping Revenue billion Forecast, by Types 2020 & 2033
- Table 39: Global Survey & Mapping Revenue billion Forecast, by Country 2020 & 2033
- Table 40: China Survey & Mapping Revenue (billion) Forecast, by Application 2020 & 2033
- Table 41: India Survey & Mapping Revenue (billion) Forecast, by Application 2020 & 2033
- Table 42: Japan Survey & Mapping Revenue (billion) Forecast, by Application 2020 & 2033
- Table 43: South Korea Survey & Mapping Revenue (billion) Forecast, by Application 2020 & 2033
- Table 44: ASEAN Survey & Mapping Revenue (billion) Forecast, by Application 2020 & 2033
- Table 45: Oceania Survey & Mapping Revenue (billion) Forecast, by Application 2020 & 2033
- Table 46: Rest of Asia Pacific Survey & Mapping Revenue (billion) Forecast, by Application 2020 & 2033
Frequently Asked Questions
1. What is the projected Compound Annual Growth Rate (CAGR) of the Survey & Mapping?
The projected CAGR is approximately 7.33%.
2. Which companies are prominent players in the Survey & Mapping?
Key companies in the market include Fugro N.V., AECOM, Stantec Inc., Mott MacDonald, Surveying And Mapping LLC. ( SAM), Quantum Spatial, Inc., Timmons Group, Landpoint, LLC, PASCO (SECOM), Kokusai Kogyo, Terra Drone, Cardno Limited, 40SEVEN, Aerodata International Surveys, African Consulting Surveyors, Alwarqa Survey Engineering, American Surveying INC, Apex Surveys, Asia-Pacific Surveys, Bayanat for Mapping and Surveying Services, Blanchard Land Surveying, Blom Romania, China Siwei Surveying & Mapping Technology Co Ltd, China Trans Geomatics Co Ltd, Compass Surveying and Mapping LLC, Digmap Geosystems Limited, Dynamic Map Platform Co Ltd, Enaar Surveyors Pvt Ltd, Engemap, Multivista Systems LLC.
3. What are the main segments of the Survey & Mapping?
The market segments include Application, Types.
4. Can you provide details about the market size?
The market size is estimated to be USD 35.59 billion as of 2022.
5. What are some drivers contributing to market growth?
N/A
6. What are the notable trends driving market growth?
N/A
7. Are there any restraints impacting market growth?
N/A
8. Can you provide examples of recent developments in the market?
N/A
9. What pricing options are available for accessing the report?
Pricing options include single-user, multi-user, and enterprise licenses priced at USD 2900.00, USD 4350.00, and USD 5800.00 respectively.
10. Is the market size provided in terms of value or volume?
The market size is provided in terms of value, measured in billion.
11. Are there any specific market keywords associated with the report?
Yes, the market keyword associated with the report is "Survey & Mapping," which aids in identifying and referencing the specific market segment covered.
12. How do I determine which pricing option suits my needs best?
The pricing options vary based on user requirements and access needs. Individual users may opt for single-user licenses, while businesses requiring broader access may choose multi-user or enterprise licenses for cost-effective access to the report.
13. Are there any additional resources or data provided in the Survey & Mapping report?
While the report offers comprehensive insights, it's advisable to review the specific contents or supplementary materials provided to ascertain if additional resources or data are available.
14. How can I stay updated on further developments or reports in the Survey & Mapping?
To stay informed about further developments, trends, and reports in the Survey & Mapping, consider subscribing to industry newsletters, following relevant companies and organizations, or regularly checking reputable industry news sources and publications.
Methodology
Step 1 - Identification of Relevant Samples Size from Population Database


Step 2 - Approaches for Defining Global Market Size (Value, Volume* & Price*)

Note*: In applicable scenarios
Step 3 - Data Sources
Primary Research
- Web Analytics
- Survey Reports
- Research Institute
- Latest Research Reports
- Opinion Leaders
Secondary Research
- Annual Reports
- White Paper
- Latest Press Release
- Industry Association
- Paid Database
- Investor Presentations

Step 4 - Data Triangulation
Involves using different sources of information in order to increase the validity of a study
These sources are likely to be stakeholders in a program - participants, other researchers, program staff, other community members, and so on.
Then we put all data in single framework & apply various statistical tools to find out the dynamic on the market.
During the analysis stage, feedback from the stakeholder groups would be compared to determine areas of agreement as well as areas of divergence