

Key Insights
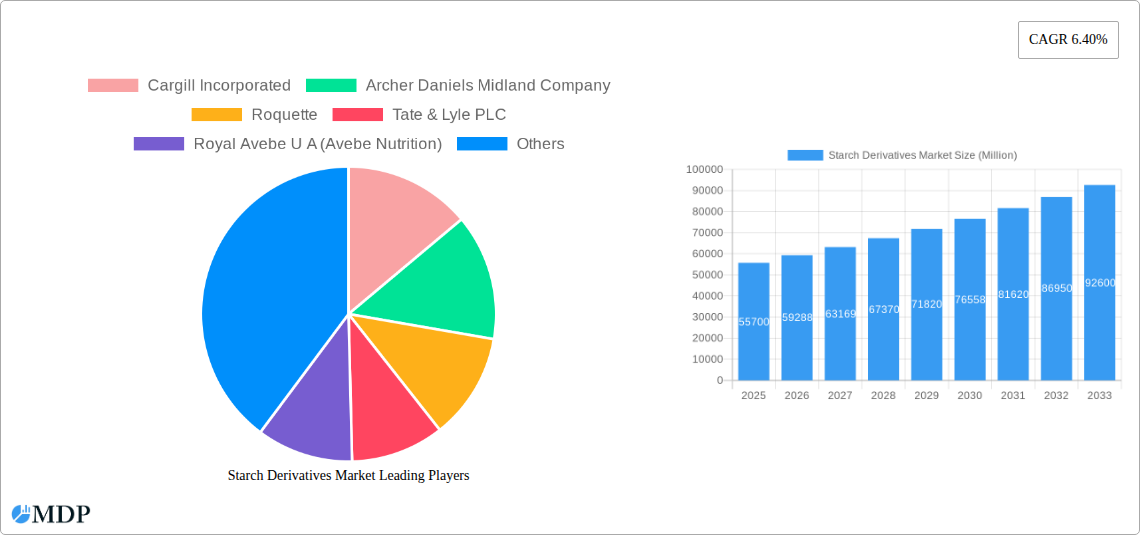
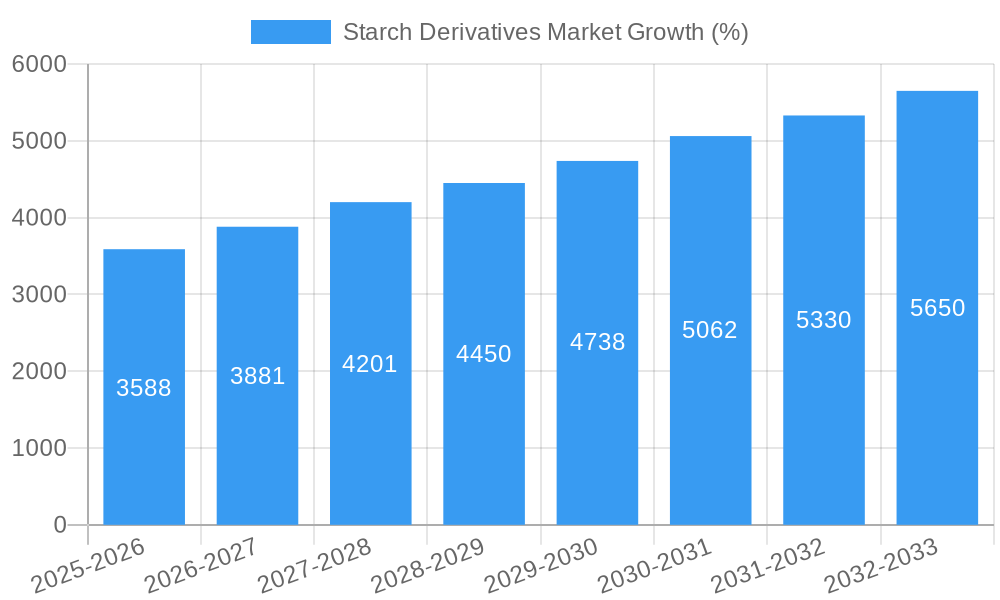
The global starch derivatives market, valued at $55.7 billion in 2025, is projected to experience robust growth, driven by increasing demand across diverse sectors. A compound annual growth rate (CAGR) of 6.40% from 2025 to 2033 indicates significant expansion opportunities. Key drivers include the rising consumption of processed foods and beverages, the growing pharmaceutical industry requiring specialized starches for drug delivery systems, and the expanding bioethanol production relying on starch as a feedstock. Furthermore, advancements in starch modification technologies are leading to the development of novel derivatives with enhanced functionalities, catering to specific industry needs and driving market expansion. The food and beverage segment currently dominates market share, fueled by the use of starch derivatives as thickeners, stabilizers, and sweeteners. However, increasing applications in the pharmaceutical and bioethanol sectors are expected to witness significant growth in the coming years. The corn-based starch derivatives segment holds a considerable market share due to corn's widespread cultivation and cost-effectiveness. However, other sources like cassava and potato are gaining traction, driven by their sustainability and regional availability. Major players like Cargill, ADM, and Roquette are investing in research and development to enhance product offerings and expand their market presence.
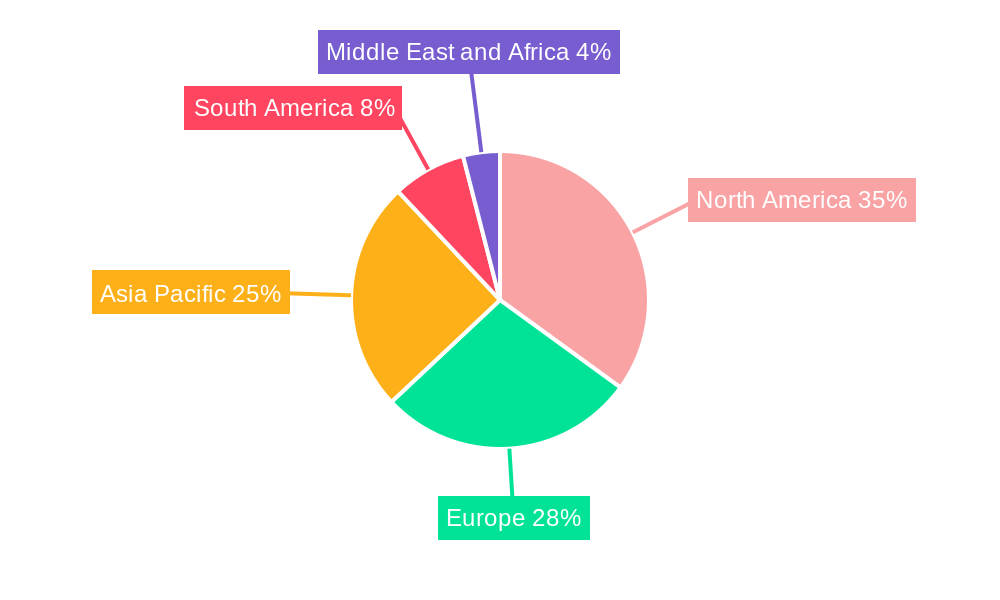
Geographic expansion is another crucial aspect of the market's growth trajectory. North America and Europe currently hold significant market shares, primarily due to established food processing and pharmaceutical industries. However, the Asia-Pacific region is anticipated to witness rapid growth, driven by rising disposable incomes, changing dietary habits, and expanding industrial sectors. This growth will be particularly prominent in countries like China and India, which represent large and rapidly developing markets for processed food and beverage products. The competitive landscape is characterized by the presence of both established multinational corporations and regional players. This competition is fostering innovation and driving down prices, making starch derivatives more accessible to a wider range of industries and consumers. The overall outlook for the starch derivatives market remains positive, with sustained growth expected throughout the forecast period.
This comprehensive report provides an in-depth analysis of the global Starch Derivatives Market, offering invaluable insights for stakeholders across the industry value chain. With a study period spanning 2019-2033, a base year of 2025, and a forecast period of 2025-2033, this report meticulously examines market dynamics, leading players, and emerging trends to provide a robust forecast and strategic recommendations. The market size is projected to reach xx Million by 2033.
Starch Derivatives Market Market Dynamics & Concentration
The global starch derivatives market exhibits a moderately concentrated landscape, with key players like Cargill Incorporated, Archer Daniels Midland Company, and Roquette holding significant market share. The market's dynamism is driven by several factors:
- Innovation: Continuous innovation in starch modification technologies, leading to the development of novel products with enhanced functionalities, is a key driver. This includes the development of bio-based polymers and specialized starch derivatives for niche applications.
- Regulatory Landscape: Stringent regulations regarding food safety and the growing demand for sustainable and ethically sourced ingredients influence market dynamics. Compliance costs and evolving regulations represent ongoing challenges for market participants.
- Product Substitutes: Competition from alternative materials like synthetic polymers and other natural-based ingredients exerts pressure on market growth. The degree of substitutability varies significantly depending on the specific application.
- End-User Trends: Shifting consumer preferences toward healthier and more sustainable food and beverage products are driving demand for specific starch derivatives like maltodextrin and modified starches.
- Mergers & Acquisitions (M&A): The starch derivatives industry has witnessed a moderate level of M&A activity in recent years. These activities primarily aim at expanding product portfolios, enhancing technological capabilities, and securing access to new markets. For example, the number of M&A deals recorded between 2020 and 2024 averaged approximately xx deals annually, suggesting a moderate level of consolidation. The average deal size was approximately xx Million. Market share analysis reveals that the top three players hold a combined share of approximately xx%, indicating a moderately consolidated market.
Starch Derivatives Market Industry Trends & Analysis
The global starch derivatives market is experiencing robust growth, driven by several key factors. The Compound Annual Growth Rate (CAGR) during the forecast period (2025-2033) is estimated at xx%. This growth is fueled by several trends:
- Technological Disruptions: Advancements in starch modification techniques are creating new applications and opportunities, particularly in the bio-based materials sector. Precision fermentation techniques and enzyme engineering are playing crucial roles in enhancing starch derivative properties and expanding their usage.
- Consumer Preferences: The increasing consumer demand for clean-label products, functional foods, and sustainable ingredients is driving the demand for specific types of starch derivatives, like those sourced from sustainable agriculture practices.
- Competitive Dynamics: The market is characterized by both intense competition among established players and the emergence of new entrants with innovative offerings. Competitive strategies encompass product differentiation, cost optimization, and strategic partnerships.
- Market Penetration: The market penetration of starch derivatives in various industries, such as food and beverage, pharmaceuticals, and cosmetics, is constantly increasing. This expansion is driven by the versatility and functionality of these materials.
- Market Growth Drivers: The key factors that are driving the market include increasing demand for food and beverages, rising demand for bio-based products, increasing investments in research and development, and technological advancements.
Leading Markets & Segments in Starch Derivatives Market
The food and beverage industry is the dominant application segment for starch derivatives, commanding the largest market share. Geographically, Asia-Pacific is projected to be the fastest-growing region, driven by rising disposable incomes and increasing demand for processed foods.
By Type:
- Maltodextrin: High demand driven by its use as a food additive and in pharmaceutical formulations.
- Modified Starch: Growing applications in food processing and industrial applications.
- Glucose Syrups: Significant use in the food and beverage industry and other applications.
By Source:
- Corn: Remains the primary source due to high yields and relatively low cost.
- Potato: Growing in popularity due to its functional properties and applications in specific food products.
By Application:
- Food and Beverage: Largest segment due to widespread use as thickeners, stabilizers, and sweeteners.
- Pharmaceutical Industry: Use in drug formulation and delivery systems.
- Feed Industry: Application as binders and nutritional supplements.
Key Drivers:
- Asia-Pacific: Rapid economic growth, increasing population, and rising demand for processed foods.
- North America: Strong presence of major industry players and significant technological advancements.
- Europe: Stricter regulations driving innovation in sustainable starch production.
Starch Derivatives Market Product Developments
Recent product innovations focus on developing starch derivatives with improved functionalities, such as enhanced viscosity, solubility, and stability. This includes the development of novel biopolymers from starch, catering to the growing demand for sustainable and biodegradable materials. Many companies are investing in technologies like enzymatic modification to improve the properties of starch derivatives and expand their application range. This focus on sustainable and functional properties provides key competitive advantages.
Key Drivers of Starch Derivatives Market Growth
The market’s growth is propelled by several key factors: rising demand for processed foods and beverages, increasing use in pharmaceutical and industrial applications, advancements in starch modification technologies leading to new functionalities, and the growing focus on sustainable and bio-based materials in various industries. Government initiatives promoting bio-based economies and investments in research and development are also significant drivers.
Challenges in the Starch Derivatives Market Market
The starch derivatives market faces several challenges, including fluctuations in raw material prices, increasing competition from synthetic substitutes, and stringent regulatory requirements regarding food safety and labeling. Supply chain disruptions and the impact of climate change on crop yields also pose significant risks. These challenges have resulted in an estimated xx% reduction in production efficiency over the past five years.
Emerging Opportunities in Starch Derivatives Market
The future holds promising opportunities for the starch derivatives market. The increasing demand for sustainable and bio-based materials offers significant growth potential. Strategic partnerships with other industries like packaging and bioplastics could also open new avenues. Further advancements in starch modification technologies, leading to new applications in areas such as drug delivery and advanced materials, will continue to drive market expansion.
Leading Players in the Starch Derivatives Market Sector
- Cargill Incorporated
- Archer Daniels Midland Company
- Roquette
- Tate & Lyle PLC
- Royal Avebe U A (Avebe Nutrition)
- Tereos S A
- Ingredion Incorporated
- Beneo
- Cumberland Packing Corp
- Glycom
Key Milestones in Starch Derivatives Market Industry
- 2022 Q3: Cargill Incorporated announced a significant investment in a new starch processing facility in [Location], expanding its production capacity.
- 2021 Q4: Archer Daniels Midland Company acquired [Biotech Company Name], enhancing its starch modification capabilities.
- 2020 Q2: Roquette launched a new line of sustainable starch derivatives, focusing on biopolymer applications.
Strategic Outlook for Starch Derivatives Market Market
The starch derivatives market is poised for substantial growth, driven by technological advancements, shifting consumer preferences, and the increasing demand for sustainable materials. Companies focusing on innovation, strategic partnerships, and sustainable production practices will be well-positioned to capitalize on future market opportunities. Expansion into new applications and geographical markets will be crucial for sustained success.
Starch Derivatives Market Segmentation
-
1. Type
- 1.1. Maltodextrin
- 1.2. Cyclodextrin
- 1.3. Glucose Syrups
- 1.4. Hydrolysates
- 1.5. Modified Starch
- 1.6. Others
-
2. Source
- 2.1. Corn
- 2.2. Wheat
- 2.3. Cassava
- 2.4. Potato
- 2.5. Other Sources
-
3. Application
- 3.1. Food and Beverage
- 3.2. Feed
- 3.3. Paper Industry
- 3.4. Pharmaceutical Industry
- 3.5. Bioethanol
- 3.6. Cosmetics
- 3.7. Other Industrial Applications
Starch Derivatives Market Segmentation By Geography
-
1. North America
- 1.1. United States
- 1.2. Canada
- 1.3. Mexico
- 1.4. Rest of North America
-
2. Europe
- 2.1. Spain
- 2.2. United Kingdom
- 2.3. France
- 2.4. Germany
- 2.5. Russia
- 2.6. Italy
- 2.7. Rest of Europe
-
3. Asia Pacific
- 3.1. China
- 3.2. Japan
- 3.3. India
- 3.4. Singapore
- 3.5. Australia
- 3.6. Rest of Asia Pacific
-
4. South America
- 4.1. Brazil
- 4.2. Argentina
- 4.3. Rest of South America
-
5. Middle East and Africa
- 5.1. South Africa
- 5.2. United Arab Emirates
- 5.3. Saudi Arabia
- 5.4. Rest of Middle East
Starch Derivatives Market REPORT HIGHLIGHTS
| Aspects | Details |
|---|---|
| Study Period | 2019-2033 |
| Base Year | 2024 |
| Estimated Year | 2025 |
| Forecast Period | 2025-2033 |
| Historical Period | 2019-2024 |
| Growth Rate | CAGR of 6.40% from 2019-2033 |
| Segmentation |
|
Table of Contents
- 1. Introduction
- 1.1. Research Scope
- 1.2. Market Segmentation
- 1.3. Research Methodology
- 1.4. Definitions and Assumptions
- 2. Executive Summary
- 2.1. Introduction
- 3. Market Dynamics
- 3.1. Introduction
- 3.2. Market Drivers
- 3.2.1. Inclination Towards Fitness and Increasing Intake of Plant-based Protein; Increase in Consumer Inclination Towards Meat Substitutes
- 3.3. Market Restrains
- 3.3.1. Gluten-Intolerance Among the Population Hindering the Market
- 3.4. Market Trends
- 3.4.1. Modified Starch is Strongly Accelerating the Overall Market For Starch Derivatives
- 4. Market Factor Analysis
- 4.1. Porters Five Forces
- 4.2. Supply/Value Chain
- 4.3. PESTEL analysis
- 4.4. Market Entropy
- 4.5. Patent/Trademark Analysis
- 5. Global Starch Derivatives Market Analysis, Insights and Forecast, 2019-2031
- 5.1. Market Analysis, Insights and Forecast - by Type
- 5.1.1. Maltodextrin
- 5.1.2. Cyclodextrin
- 5.1.3. Glucose Syrups
- 5.1.4. Hydrolysates
- 5.1.5. Modified Starch
- 5.1.6. Others
- 5.2. Market Analysis, Insights and Forecast - by Source
- 5.2.1. Corn
- 5.2.2. Wheat
- 5.2.3. Cassava
- 5.2.4. Potato
- 5.2.5. Other Sources
- 5.3. Market Analysis, Insights and Forecast - by Application
- 5.3.1. Food and Beverage
- 5.3.2. Feed
- 5.3.3. Paper Industry
- 5.3.4. Pharmaceutical Industry
- 5.3.5. Bioethanol
- 5.3.6. Cosmetics
- 5.3.7. Other Industrial Applications
- 5.4. Market Analysis, Insights and Forecast - by Region
- 5.4.1. North America
- 5.4.2. Europe
- 5.4.3. Asia Pacific
- 5.4.4. South America
- 5.4.5. Middle East and Africa
- 5.1. Market Analysis, Insights and Forecast - by Type
- 6. North America Starch Derivatives Market Analysis, Insights and Forecast, 2019-2031
- 6.1. Market Analysis, Insights and Forecast - by Type
- 6.1.1. Maltodextrin
- 6.1.2. Cyclodextrin
- 6.1.3. Glucose Syrups
- 6.1.4. Hydrolysates
- 6.1.5. Modified Starch
- 6.1.6. Others
- 6.2. Market Analysis, Insights and Forecast - by Source
- 6.2.1. Corn
- 6.2.2. Wheat
- 6.2.3. Cassava
- 6.2.4. Potato
- 6.2.5. Other Sources
- 6.3. Market Analysis, Insights and Forecast - by Application
- 6.3.1. Food and Beverage
- 6.3.2. Feed
- 6.3.3. Paper Industry
- 6.3.4. Pharmaceutical Industry
- 6.3.5. Bioethanol
- 6.3.6. Cosmetics
- 6.3.7. Other Industrial Applications
- 6.1. Market Analysis, Insights and Forecast - by Type
- 7. Europe Starch Derivatives Market Analysis, Insights and Forecast, 2019-2031
- 7.1. Market Analysis, Insights and Forecast - by Type
- 7.1.1. Maltodextrin
- 7.1.2. Cyclodextrin
- 7.1.3. Glucose Syrups
- 7.1.4. Hydrolysates
- 7.1.5. Modified Starch
- 7.1.6. Others
- 7.2. Market Analysis, Insights and Forecast - by Source
- 7.2.1. Corn
- 7.2.2. Wheat
- 7.2.3. Cassava
- 7.2.4. Potato
- 7.2.5. Other Sources
- 7.3. Market Analysis, Insights and Forecast - by Application
- 7.3.1. Food and Beverage
- 7.3.2. Feed
- 7.3.3. Paper Industry
- 7.3.4. Pharmaceutical Industry
- 7.3.5. Bioethanol
- 7.3.6. Cosmetics
- 7.3.7. Other Industrial Applications
- 7.1. Market Analysis, Insights and Forecast - by Type
- 8. Asia Pacific Starch Derivatives Market Analysis, Insights and Forecast, 2019-2031
- 8.1. Market Analysis, Insights and Forecast - by Type
- 8.1.1. Maltodextrin
- 8.1.2. Cyclodextrin
- 8.1.3. Glucose Syrups
- 8.1.4. Hydrolysates
- 8.1.5. Modified Starch
- 8.1.6. Others
- 8.2. Market Analysis, Insights and Forecast - by Source
- 8.2.1. Corn
- 8.2.2. Wheat
- 8.2.3. Cassava
- 8.2.4. Potato
- 8.2.5. Other Sources
- 8.3. Market Analysis, Insights and Forecast - by Application
- 8.3.1. Food and Beverage
- 8.3.2. Feed
- 8.3.3. Paper Industry
- 8.3.4. Pharmaceutical Industry
- 8.3.5. Bioethanol
- 8.3.6. Cosmetics
- 8.3.7. Other Industrial Applications
- 8.1. Market Analysis, Insights and Forecast - by Type
- 9. South America Starch Derivatives Market Analysis, Insights and Forecast, 2019-2031
- 9.1. Market Analysis, Insights and Forecast - by Type
- 9.1.1. Maltodextrin
- 9.1.2. Cyclodextrin
- 9.1.3. Glucose Syrups
- 9.1.4. Hydrolysates
- 9.1.5. Modified Starch
- 9.1.6. Others
- 9.2. Market Analysis, Insights and Forecast - by Source
- 9.2.1. Corn
- 9.2.2. Wheat
- 9.2.3. Cassava
- 9.2.4. Potato
- 9.2.5. Other Sources
- 9.3. Market Analysis, Insights and Forecast - by Application
- 9.3.1. Food and Beverage
- 9.3.2. Feed
- 9.3.3. Paper Industry
- 9.3.4. Pharmaceutical Industry
- 9.3.5. Bioethanol
- 9.3.6. Cosmetics
- 9.3.7. Other Industrial Applications
- 9.1. Market Analysis, Insights and Forecast - by Type
- 10. Middle East and Africa Starch Derivatives Market Analysis, Insights and Forecast, 2019-2031
- 10.1. Market Analysis, Insights and Forecast - by Type
- 10.1.1. Maltodextrin
- 10.1.2. Cyclodextrin
- 10.1.3. Glucose Syrups
- 10.1.4. Hydrolysates
- 10.1.5. Modified Starch
- 10.1.6. Others
- 10.2. Market Analysis, Insights and Forecast - by Source
- 10.2.1. Corn
- 10.2.2. Wheat
- 10.2.3. Cassava
- 10.2.4. Potato
- 10.2.5. Other Sources
- 10.3. Market Analysis, Insights and Forecast - by Application
- 10.3.1. Food and Beverage
- 10.3.2. Feed
- 10.3.3. Paper Industry
- 10.3.4. Pharmaceutical Industry
- 10.3.5. Bioethanol
- 10.3.6. Cosmetics
- 10.3.7. Other Industrial Applications
- 10.1. Market Analysis, Insights and Forecast - by Type
- 11. North America Starch Derivatives Market Analysis, Insights and Forecast, 2019-2031
- 11.1. Market Analysis, Insights and Forecast - By Country/Sub-region
- 11.1.1 United States
- 11.1.2 Canada
- 11.1.3 Mexico
- 11.1.4 Rest of North America
- 12. Europe Starch Derivatives Market Analysis, Insights and Forecast, 2019-2031
- 12.1. Market Analysis, Insights and Forecast - By Country/Sub-region
- 12.1.1 Spain
- 12.1.2 United Kingdom
- 12.1.3 France
- 12.1.4 Germany
- 12.1.5 Russia
- 12.1.6 Italy
- 12.1.7 Rest of Europe
- 13. Asia Pacific Starch Derivatives Market Analysis, Insights and Forecast, 2019-2031
- 13.1. Market Analysis, Insights and Forecast - By Country/Sub-region
- 13.1.1 China
- 13.1.2 Japan
- 13.1.3 India
- 13.1.4 Singapore
- 13.1.5 Australia
- 13.1.6 Rest of Asia Pacific
- 14. South America Starch Derivatives Market Analysis, Insights and Forecast, 2019-2031
- 14.1. Market Analysis, Insights and Forecast - By Country/Sub-region
- 14.1.1 Brazil
- 14.1.2 Argentina
- 14.1.3 Rest of South America
- 15. Middle East and Africa Starch Derivatives Market Analysis, Insights and Forecast, 2019-2031
- 15.1. Market Analysis, Insights and Forecast - By Country/Sub-region
- 15.1.1 South Africa
- 15.1.2 United Arab Emirates
- 15.1.3 Saudi Arabia
- 15.1.4 Rest of Middle East
- 16. Competitive Analysis
- 16.1. Global Market Share Analysis 2024
- 16.2. Company Profiles
- 16.2.1 Cargill Incorporated
- 16.2.1.1. Overview
- 16.2.1.2. Products
- 16.2.1.3. SWOT Analysis
- 16.2.1.4. Recent Developments
- 16.2.1.5. Financials (Based on Availability)
- 16.2.2 Archer Daniels Midland Company
- 16.2.2.1. Overview
- 16.2.2.2. Products
- 16.2.2.3. SWOT Analysis
- 16.2.2.4. Recent Developments
- 16.2.2.5. Financials (Based on Availability)
- 16.2.3 Roquette
- 16.2.3.1. Overview
- 16.2.3.2. Products
- 16.2.3.3. SWOT Analysis
- 16.2.3.4. Recent Developments
- 16.2.3.5. Financials (Based on Availability)
- 16.2.4 Tate & Lyle PLC
- 16.2.4.1. Overview
- 16.2.4.2. Products
- 16.2.4.3. SWOT Analysis
- 16.2.4.4. Recent Developments
- 16.2.4.5. Financials (Based on Availability)
- 16.2.5 Royal Avebe U A (Avebe Nutrition)
- 16.2.5.1. Overview
- 16.2.5.2. Products
- 16.2.5.3. SWOT Analysis
- 16.2.5.4. Recent Developments
- 16.2.5.5. Financials (Based on Availability)
- 16.2.6 Tereos S A*List Not Exhaustive
- 16.2.6.1. Overview
- 16.2.6.2. Products
- 16.2.6.3. SWOT Analysis
- 16.2.6.4. Recent Developments
- 16.2.6.5. Financials (Based on Availability)
- 16.2.7 Ingredion Incorporated
- 16.2.7.1. Overview
- 16.2.7.2. Products
- 16.2.7.3. SWOT Analysis
- 16.2.7.4. Recent Developments
- 16.2.7.5. Financials (Based on Availability)
- 16.2.8 Beneo
- 16.2.8.1. Overview
- 16.2.8.2. Products
- 16.2.8.3. SWOT Analysis
- 16.2.8.4. Recent Developments
- 16.2.8.5. Financials (Based on Availability)
- 16.2.9 Cumberland Packing Corp
- 16.2.9.1. Overview
- 16.2.9.2. Products
- 16.2.9.3. SWOT Analysis
- 16.2.9.4. Recent Developments
- 16.2.9.5. Financials (Based on Availability)
- 16.2.10 Glycom
- 16.2.10.1. Overview
- 16.2.10.2. Products
- 16.2.10.3. SWOT Analysis
- 16.2.10.4. Recent Developments
- 16.2.10.5. Financials (Based on Availability)
- 16.2.1 Cargill Incorporated
List of Figures
- Figure 1: Global Starch Derivatives Market Revenue Breakdown (Million, %) by Region 2024 & 2032
- Figure 2: Global Starch Derivatives Market Volume Breakdown (K Tons, %) by Region 2024 & 2032
- Figure 3: North America Starch Derivatives Market Revenue (Million), by Country 2024 & 2032
- Figure 4: North America Starch Derivatives Market Volume (K Tons), by Country 2024 & 2032
- Figure 5: North America Starch Derivatives Market Revenue Share (%), by Country 2024 & 2032
- Figure 6: North America Starch Derivatives Market Volume Share (%), by Country 2024 & 2032
- Figure 7: Europe Starch Derivatives Market Revenue (Million), by Country 2024 & 2032
- Figure 8: Europe Starch Derivatives Market Volume (K Tons), by Country 2024 & 2032
- Figure 9: Europe Starch Derivatives Market Revenue Share (%), by Country 2024 & 2032
- Figure 10: Europe Starch Derivatives Market Volume Share (%), by Country 2024 & 2032
- Figure 11: Asia Pacific Starch Derivatives Market Revenue (Million), by Country 2024 & 2032
- Figure 12: Asia Pacific Starch Derivatives Market Volume (K Tons), by Country 2024 & 2032
- Figure 13: Asia Pacific Starch Derivatives Market Revenue Share (%), by Country 2024 & 2032
- Figure 14: Asia Pacific Starch Derivatives Market Volume Share (%), by Country 2024 & 2032
- Figure 15: South America Starch Derivatives Market Revenue (Million), by Country 2024 & 2032
- Figure 16: South America Starch Derivatives Market Volume (K Tons), by Country 2024 & 2032
- Figure 17: South America Starch Derivatives Market Revenue Share (%), by Country 2024 & 2032
- Figure 18: South America Starch Derivatives Market Volume Share (%), by Country 2024 & 2032
- Figure 19: Middle East and Africa Starch Derivatives Market Revenue (Million), by Country 2024 & 2032
- Figure 20: Middle East and Africa Starch Derivatives Market Volume (K Tons), by Country 2024 & 2032
- Figure 21: Middle East and Africa Starch Derivatives Market Revenue Share (%), by Country 2024 & 2032
- Figure 22: Middle East and Africa Starch Derivatives Market Volume Share (%), by Country 2024 & 2032
- Figure 23: North America Starch Derivatives Market Revenue (Million), by Type 2024 & 2032
- Figure 24: North America Starch Derivatives Market Volume (K Tons), by Type 2024 & 2032
- Figure 25: North America Starch Derivatives Market Revenue Share (%), by Type 2024 & 2032
- Figure 26: North America Starch Derivatives Market Volume Share (%), by Type 2024 & 2032
- Figure 27: North America Starch Derivatives Market Revenue (Million), by Source 2024 & 2032
- Figure 28: North America Starch Derivatives Market Volume (K Tons), by Source 2024 & 2032
- Figure 29: North America Starch Derivatives Market Revenue Share (%), by Source 2024 & 2032
- Figure 30: North America Starch Derivatives Market Volume Share (%), by Source 2024 & 2032
- Figure 31: North America Starch Derivatives Market Revenue (Million), by Application 2024 & 2032
- Figure 32: North America Starch Derivatives Market Volume (K Tons), by Application 2024 & 2032
- Figure 33: North America Starch Derivatives Market Revenue Share (%), by Application 2024 & 2032
- Figure 34: North America Starch Derivatives Market Volume Share (%), by Application 2024 & 2032
- Figure 35: North America Starch Derivatives Market Revenue (Million), by Country 2024 & 2032
- Figure 36: North America Starch Derivatives Market Volume (K Tons), by Country 2024 & 2032
- Figure 37: North America Starch Derivatives Market Revenue Share (%), by Country 2024 & 2032
- Figure 38: North America Starch Derivatives Market Volume Share (%), by Country 2024 & 2032
- Figure 39: Europe Starch Derivatives Market Revenue (Million), by Type 2024 & 2032
- Figure 40: Europe Starch Derivatives Market Volume (K Tons), by Type 2024 & 2032
- Figure 41: Europe Starch Derivatives Market Revenue Share (%), by Type 2024 & 2032
- Figure 42: Europe Starch Derivatives Market Volume Share (%), by Type 2024 & 2032
- Figure 43: Europe Starch Derivatives Market Revenue (Million), by Source 2024 & 2032
- Figure 44: Europe Starch Derivatives Market Volume (K Tons), by Source 2024 & 2032
- Figure 45: Europe Starch Derivatives Market Revenue Share (%), by Source 2024 & 2032
- Figure 46: Europe Starch Derivatives Market Volume Share (%), by Source 2024 & 2032
- Figure 47: Europe Starch Derivatives Market Revenue (Million), by Application 2024 & 2032
- Figure 48: Europe Starch Derivatives Market Volume (K Tons), by Application 2024 & 2032
- Figure 49: Europe Starch Derivatives Market Revenue Share (%), by Application 2024 & 2032
- Figure 50: Europe Starch Derivatives Market Volume Share (%), by Application 2024 & 2032
- Figure 51: Europe Starch Derivatives Market Revenue (Million), by Country 2024 & 2032
- Figure 52: Europe Starch Derivatives Market Volume (K Tons), by Country 2024 & 2032
- Figure 53: Europe Starch Derivatives Market Revenue Share (%), by Country 2024 & 2032
- Figure 54: Europe Starch Derivatives Market Volume Share (%), by Country 2024 & 2032
- Figure 55: Asia Pacific Starch Derivatives Market Revenue (Million), by Type 2024 & 2032
- Figure 56: Asia Pacific Starch Derivatives Market Volume (K Tons), by Type 2024 & 2032
- Figure 57: Asia Pacific Starch Derivatives Market Revenue Share (%), by Type 2024 & 2032
- Figure 58: Asia Pacific Starch Derivatives Market Volume Share (%), by Type 2024 & 2032
- Figure 59: Asia Pacific Starch Derivatives Market Revenue (Million), by Source 2024 & 2032
- Figure 60: Asia Pacific Starch Derivatives Market Volume (K Tons), by Source 2024 & 2032
- Figure 61: Asia Pacific Starch Derivatives Market Revenue Share (%), by Source 2024 & 2032
- Figure 62: Asia Pacific Starch Derivatives Market Volume Share (%), by Source 2024 & 2032
- Figure 63: Asia Pacific Starch Derivatives Market Revenue (Million), by Application 2024 & 2032
- Figure 64: Asia Pacific Starch Derivatives Market Volume (K Tons), by Application 2024 & 2032
- Figure 65: Asia Pacific Starch Derivatives Market Revenue Share (%), by Application 2024 & 2032
- Figure 66: Asia Pacific Starch Derivatives Market Volume Share (%), by Application 2024 & 2032
- Figure 67: Asia Pacific Starch Derivatives Market Revenue (Million), by Country 2024 & 2032
- Figure 68: Asia Pacific Starch Derivatives Market Volume (K Tons), by Country 2024 & 2032
- Figure 69: Asia Pacific Starch Derivatives Market Revenue Share (%), by Country 2024 & 2032
- Figure 70: Asia Pacific Starch Derivatives Market Volume Share (%), by Country 2024 & 2032
- Figure 71: South America Starch Derivatives Market Revenue (Million), by Type 2024 & 2032
- Figure 72: South America Starch Derivatives Market Volume (K Tons), by Type 2024 & 2032
- Figure 73: South America Starch Derivatives Market Revenue Share (%), by Type 2024 & 2032
- Figure 74: South America Starch Derivatives Market Volume Share (%), by Type 2024 & 2032
- Figure 75: South America Starch Derivatives Market Revenue (Million), by Source 2024 & 2032
- Figure 76: South America Starch Derivatives Market Volume (K Tons), by Source 2024 & 2032
- Figure 77: South America Starch Derivatives Market Revenue Share (%), by Source 2024 & 2032
- Figure 78: South America Starch Derivatives Market Volume Share (%), by Source 2024 & 2032
- Figure 79: South America Starch Derivatives Market Revenue (Million), by Application 2024 & 2032
- Figure 80: South America Starch Derivatives Market Volume (K Tons), by Application 2024 & 2032
- Figure 81: South America Starch Derivatives Market Revenue Share (%), by Application 2024 & 2032
- Figure 82: South America Starch Derivatives Market Volume Share (%), by Application 2024 & 2032
- Figure 83: South America Starch Derivatives Market Revenue (Million), by Country 2024 & 2032
- Figure 84: South America Starch Derivatives Market Volume (K Tons), by Country 2024 & 2032
- Figure 85: South America Starch Derivatives Market Revenue Share (%), by Country 2024 & 2032
- Figure 86: South America Starch Derivatives Market Volume Share (%), by Country 2024 & 2032
- Figure 87: Middle East and Africa Starch Derivatives Market Revenue (Million), by Type 2024 & 2032
- Figure 88: Middle East and Africa Starch Derivatives Market Volume (K Tons), by Type 2024 & 2032
- Figure 89: Middle East and Africa Starch Derivatives Market Revenue Share (%), by Type 2024 & 2032
- Figure 90: Middle East and Africa Starch Derivatives Market Volume Share (%), by Type 2024 & 2032
- Figure 91: Middle East and Africa Starch Derivatives Market Revenue (Million), by Source 2024 & 2032
- Figure 92: Middle East and Africa Starch Derivatives Market Volume (K Tons), by Source 2024 & 2032
- Figure 93: Middle East and Africa Starch Derivatives Market Revenue Share (%), by Source 2024 & 2032
- Figure 94: Middle East and Africa Starch Derivatives Market Volume Share (%), by Source 2024 & 2032
- Figure 95: Middle East and Africa Starch Derivatives Market Revenue (Million), by Application 2024 & 2032
- Figure 96: Middle East and Africa Starch Derivatives Market Volume (K Tons), by Application 2024 & 2032
- Figure 97: Middle East and Africa Starch Derivatives Market Revenue Share (%), by Application 2024 & 2032
- Figure 98: Middle East and Africa Starch Derivatives Market Volume Share (%), by Application 2024 & 2032
- Figure 99: Middle East and Africa Starch Derivatives Market Revenue (Million), by Country 2024 & 2032
- Figure 100: Middle East and Africa Starch Derivatives Market Volume (K Tons), by Country 2024 & 2032
- Figure 101: Middle East and Africa Starch Derivatives Market Revenue Share (%), by Country 2024 & 2032
- Figure 102: Middle East and Africa Starch Derivatives Market Volume Share (%), by Country 2024 & 2032
List of Tables
- Table 1: Global Starch Derivatives Market Revenue Million Forecast, by Region 2019 & 2032
- Table 2: Global Starch Derivatives Market Volume K Tons Forecast, by Region 2019 & 2032
- Table 3: Global Starch Derivatives Market Revenue Million Forecast, by Type 2019 & 2032
- Table 4: Global Starch Derivatives Market Volume K Tons Forecast, by Type 2019 & 2032
- Table 5: Global Starch Derivatives Market Revenue Million Forecast, by Source 2019 & 2032
- Table 6: Global Starch Derivatives Market Volume K Tons Forecast, by Source 2019 & 2032
- Table 7: Global Starch Derivatives Market Revenue Million Forecast, by Application 2019 & 2032
- Table 8: Global Starch Derivatives Market Volume K Tons Forecast, by Application 2019 & 2032
- Table 9: Global Starch Derivatives Market Revenue Million Forecast, by Region 2019 & 2032
- Table 10: Global Starch Derivatives Market Volume K Tons Forecast, by Region 2019 & 2032
- Table 11: Global Starch Derivatives Market Revenue Million Forecast, by Country 2019 & 2032
- Table 12: Global Starch Derivatives Market Volume K Tons Forecast, by Country 2019 & 2032
- Table 13: United States Starch Derivatives Market Revenue (Million) Forecast, by Application 2019 & 2032
- Table 14: United States Starch Derivatives Market Volume (K Tons) Forecast, by Application 2019 & 2032
- Table 15: Canada Starch Derivatives Market Revenue (Million) Forecast, by Application 2019 & 2032
- Table 16: Canada Starch Derivatives Market Volume (K Tons) Forecast, by Application 2019 & 2032
- Table 17: Mexico Starch Derivatives Market Revenue (Million) Forecast, by Application 2019 & 2032
- Table 18: Mexico Starch Derivatives Market Volume (K Tons) Forecast, by Application 2019 & 2032
- Table 19: Rest of North America Starch Derivatives Market Revenue (Million) Forecast, by Application 2019 & 2032
- Table 20: Rest of North America Starch Derivatives Market Volume (K Tons) Forecast, by Application 2019 & 2032
- Table 21: Global Starch Derivatives Market Revenue Million Forecast, by Country 2019 & 2032
- Table 22: Global Starch Derivatives Market Volume K Tons Forecast, by Country 2019 & 2032
- Table 23: Spain Starch Derivatives Market Revenue (Million) Forecast, by Application 2019 & 2032
- Table 24: Spain Starch Derivatives Market Volume (K Tons) Forecast, by Application 2019 & 2032
- Table 25: United Kingdom Starch Derivatives Market Revenue (Million) Forecast, by Application 2019 & 2032
- Table 26: United Kingdom Starch Derivatives Market Volume (K Tons) Forecast, by Application 2019 & 2032
- Table 27: France Starch Derivatives Market Revenue (Million) Forecast, by Application 2019 & 2032
- Table 28: France Starch Derivatives Market Volume (K Tons) Forecast, by Application 2019 & 2032
- Table 29: Germany Starch Derivatives Market Revenue (Million) Forecast, by Application 2019 & 2032
- Table 30: Germany Starch Derivatives Market Volume (K Tons) Forecast, by Application 2019 & 2032
- Table 31: Russia Starch Derivatives Market Revenue (Million) Forecast, by Application 2019 & 2032
- Table 32: Russia Starch Derivatives Market Volume (K Tons) Forecast, by Application 2019 & 2032
- Table 33: Italy Starch Derivatives Market Revenue (Million) Forecast, by Application 2019 & 2032
- Table 34: Italy Starch Derivatives Market Volume (K Tons) Forecast, by Application 2019 & 2032
- Table 35: Rest of Europe Starch Derivatives Market Revenue (Million) Forecast, by Application 2019 & 2032
- Table 36: Rest of Europe Starch Derivatives Market Volume (K Tons) Forecast, by Application 2019 & 2032
- Table 37: Global Starch Derivatives Market Revenue Million Forecast, by Country 2019 & 2032
- Table 38: Global Starch Derivatives Market Volume K Tons Forecast, by Country 2019 & 2032
- Table 39: China Starch Derivatives Market Revenue (Million) Forecast, by Application 2019 & 2032
- Table 40: China Starch Derivatives Market Volume (K Tons) Forecast, by Application 2019 & 2032
- Table 41: Japan Starch Derivatives Market Revenue (Million) Forecast, by Application 2019 & 2032
- Table 42: Japan Starch Derivatives Market Volume (K Tons) Forecast, by Application 2019 & 2032
- Table 43: India Starch Derivatives Market Revenue (Million) Forecast, by Application 2019 & 2032
- Table 44: India Starch Derivatives Market Volume (K Tons) Forecast, by Application 2019 & 2032
- Table 45: Singapore Starch Derivatives Market Revenue (Million) Forecast, by Application 2019 & 2032
- Table 46: Singapore Starch Derivatives Market Volume (K Tons) Forecast, by Application 2019 & 2032
- Table 47: Australia Starch Derivatives Market Revenue (Million) Forecast, by Application 2019 & 2032
- Table 48: Australia Starch Derivatives Market Volume (K Tons) Forecast, by Application 2019 & 2032
- Table 49: Rest of Asia Pacific Starch Derivatives Market Revenue (Million) Forecast, by Application 2019 & 2032
- Table 50: Rest of Asia Pacific Starch Derivatives Market Volume (K Tons) Forecast, by Application 2019 & 2032
- Table 51: Global Starch Derivatives Market Revenue Million Forecast, by Country 2019 & 2032
- Table 52: Global Starch Derivatives Market Volume K Tons Forecast, by Country 2019 & 2032
- Table 53: Brazil Starch Derivatives Market Revenue (Million) Forecast, by Application 2019 & 2032
- Table 54: Brazil Starch Derivatives Market Volume (K Tons) Forecast, by Application 2019 & 2032
- Table 55: Argentina Starch Derivatives Market Revenue (Million) Forecast, by Application 2019 & 2032
- Table 56: Argentina Starch Derivatives Market Volume (K Tons) Forecast, by Application 2019 & 2032
- Table 57: Rest of South America Starch Derivatives Market Revenue (Million) Forecast, by Application 2019 & 2032
- Table 58: Rest of South America Starch Derivatives Market Volume (K Tons) Forecast, by Application 2019 & 2032
- Table 59: Global Starch Derivatives Market Revenue Million Forecast, by Country 2019 & 2032
- Table 60: Global Starch Derivatives Market Volume K Tons Forecast, by Country 2019 & 2032
- Table 61: South Africa Starch Derivatives Market Revenue (Million) Forecast, by Application 2019 & 2032
- Table 62: South Africa Starch Derivatives Market Volume (K Tons) Forecast, by Application 2019 & 2032
- Table 63: United Arab Emirates Starch Derivatives Market Revenue (Million) Forecast, by Application 2019 & 2032
- Table 64: United Arab Emirates Starch Derivatives Market Volume (K Tons) Forecast, by Application 2019 & 2032
- Table 65: Saudi Arabia Starch Derivatives Market Revenue (Million) Forecast, by Application 2019 & 2032
- Table 66: Saudi Arabia Starch Derivatives Market Volume (K Tons) Forecast, by Application 2019 & 2032
- Table 67: Rest of Middle East Starch Derivatives Market Revenue (Million) Forecast, by Application 2019 & 2032
- Table 68: Rest of Middle East Starch Derivatives Market Volume (K Tons) Forecast, by Application 2019 & 2032
- Table 69: Global Starch Derivatives Market Revenue Million Forecast, by Type 2019 & 2032
- Table 70: Global Starch Derivatives Market Volume K Tons Forecast, by Type 2019 & 2032
- Table 71: Global Starch Derivatives Market Revenue Million Forecast, by Source 2019 & 2032
- Table 72: Global Starch Derivatives Market Volume K Tons Forecast, by Source 2019 & 2032
- Table 73: Global Starch Derivatives Market Revenue Million Forecast, by Application 2019 & 2032
- Table 74: Global Starch Derivatives Market Volume K Tons Forecast, by Application 2019 & 2032
- Table 75: Global Starch Derivatives Market Revenue Million Forecast, by Country 2019 & 2032
- Table 76: Global Starch Derivatives Market Volume K Tons Forecast, by Country 2019 & 2032
- Table 77: United States Starch Derivatives Market Revenue (Million) Forecast, by Application 2019 & 2032
- Table 78: United States Starch Derivatives Market Volume (K Tons) Forecast, by Application 2019 & 2032
- Table 79: Canada Starch Derivatives Market Revenue (Million) Forecast, by Application 2019 & 2032
- Table 80: Canada Starch Derivatives Market Volume (K Tons) Forecast, by Application 2019 & 2032
- Table 81: Mexico Starch Derivatives Market Revenue (Million) Forecast, by Application 2019 & 2032
- Table 82: Mexico Starch Derivatives Market Volume (K Tons) Forecast, by Application 2019 & 2032
- Table 83: Rest of North America Starch Derivatives Market Revenue (Million) Forecast, by Application 2019 & 2032
- Table 84: Rest of North America Starch Derivatives Market Volume (K Tons) Forecast, by Application 2019 & 2032
- Table 85: Global Starch Derivatives Market Revenue Million Forecast, by Type 2019 & 2032
- Table 86: Global Starch Derivatives Market Volume K Tons Forecast, by Type 2019 & 2032
- Table 87: Global Starch Derivatives Market Revenue Million Forecast, by Source 2019 & 2032
- Table 88: Global Starch Derivatives Market Volume K Tons Forecast, by Source 2019 & 2032
- Table 89: Global Starch Derivatives Market Revenue Million Forecast, by Application 2019 & 2032
- Table 90: Global Starch Derivatives Market Volume K Tons Forecast, by Application 2019 & 2032
- Table 91: Global Starch Derivatives Market Revenue Million Forecast, by Country 2019 & 2032
- Table 92: Global Starch Derivatives Market Volume K Tons Forecast, by Country 2019 & 2032
- Table 93: Spain Starch Derivatives Market Revenue (Million) Forecast, by Application 2019 & 2032
- Table 94: Spain Starch Derivatives Market Volume (K Tons) Forecast, by Application 2019 & 2032
- Table 95: United Kingdom Starch Derivatives Market Revenue (Million) Forecast, by Application 2019 & 2032
- Table 96: United Kingdom Starch Derivatives Market Volume (K Tons) Forecast, by Application 2019 & 2032
- Table 97: France Starch Derivatives Market Revenue (Million) Forecast, by Application 2019 & 2032
- Table 98: France Starch Derivatives Market Volume (K Tons) Forecast, by Application 2019 & 2032
- Table 99: Germany Starch Derivatives Market Revenue (Million) Forecast, by Application 2019 & 2032
- Table 100: Germany Starch Derivatives Market Volume (K Tons) Forecast, by Application 2019 & 2032
- Table 101: Russia Starch Derivatives Market Revenue (Million) Forecast, by Application 2019 & 2032
- Table 102: Russia Starch Derivatives Market Volume (K Tons) Forecast, by Application 2019 & 2032
- Table 103: Italy Starch Derivatives Market Revenue (Million) Forecast, by Application 2019 & 2032
- Table 104: Italy Starch Derivatives Market Volume (K Tons) Forecast, by Application 2019 & 2032
- Table 105: Rest of Europe Starch Derivatives Market Revenue (Million) Forecast, by Application 2019 & 2032
- Table 106: Rest of Europe Starch Derivatives Market Volume (K Tons) Forecast, by Application 2019 & 2032
- Table 107: Global Starch Derivatives Market Revenue Million Forecast, by Type 2019 & 2032
- Table 108: Global Starch Derivatives Market Volume K Tons Forecast, by Type 2019 & 2032
- Table 109: Global Starch Derivatives Market Revenue Million Forecast, by Source 2019 & 2032
- Table 110: Global Starch Derivatives Market Volume K Tons Forecast, by Source 2019 & 2032
- Table 111: Global Starch Derivatives Market Revenue Million Forecast, by Application 2019 & 2032
- Table 112: Global Starch Derivatives Market Volume K Tons Forecast, by Application 2019 & 2032
- Table 113: Global Starch Derivatives Market Revenue Million Forecast, by Country 2019 & 2032
- Table 114: Global Starch Derivatives Market Volume K Tons Forecast, by Country 2019 & 2032
- Table 115: China Starch Derivatives Market Revenue (Million) Forecast, by Application 2019 & 2032
- Table 116: China Starch Derivatives Market Volume (K Tons) Forecast, by Application 2019 & 2032
- Table 117: Japan Starch Derivatives Market Revenue (Million) Forecast, by Application 2019 & 2032
- Table 118: Japan Starch Derivatives Market Volume (K Tons) Forecast, by Application 2019 & 2032
- Table 119: India Starch Derivatives Market Revenue (Million) Forecast, by Application 2019 & 2032
- Table 120: India Starch Derivatives Market Volume (K Tons) Forecast, by Application 2019 & 2032
- Table 121: Singapore Starch Derivatives Market Revenue (Million) Forecast, by Application 2019 & 2032
- Table 122: Singapore Starch Derivatives Market Volume (K Tons) Forecast, by Application 2019 & 2032
- Table 123: Australia Starch Derivatives Market Revenue (Million) Forecast, by Application 2019 & 2032
- Table 124: Australia Starch Derivatives Market Volume (K Tons) Forecast, by Application 2019 & 2032
- Table 125: Rest of Asia Pacific Starch Derivatives Market Revenue (Million) Forecast, by Application 2019 & 2032
- Table 126: Rest of Asia Pacific Starch Derivatives Market Volume (K Tons) Forecast, by Application 2019 & 2032
- Table 127: Global Starch Derivatives Market Revenue Million Forecast, by Type 2019 & 2032
- Table 128: Global Starch Derivatives Market Volume K Tons Forecast, by Type 2019 & 2032
- Table 129: Global Starch Derivatives Market Revenue Million Forecast, by Source 2019 & 2032
- Table 130: Global Starch Derivatives Market Volume K Tons Forecast, by Source 2019 & 2032
- Table 131: Global Starch Derivatives Market Revenue Million Forecast, by Application 2019 & 2032
- Table 132: Global Starch Derivatives Market Volume K Tons Forecast, by Application 2019 & 2032
- Table 133: Global Starch Derivatives Market Revenue Million Forecast, by Country 2019 & 2032
- Table 134: Global Starch Derivatives Market Volume K Tons Forecast, by Country 2019 & 2032
- Table 135: Brazil Starch Derivatives Market Revenue (Million) Forecast, by Application 2019 & 2032
- Table 136: Brazil Starch Derivatives Market Volume (K Tons) Forecast, by Application 2019 & 2032
- Table 137: Argentina Starch Derivatives Market Revenue (Million) Forecast, by Application 2019 & 2032
- Table 138: Argentina Starch Derivatives Market Volume (K Tons) Forecast, by Application 2019 & 2032
- Table 139: Rest of South America Starch Derivatives Market Revenue (Million) Forecast, by Application 2019 & 2032
- Table 140: Rest of South America Starch Derivatives Market Volume (K Tons) Forecast, by Application 2019 & 2032
- Table 141: Global Starch Derivatives Market Revenue Million Forecast, by Type 2019 & 2032
- Table 142: Global Starch Derivatives Market Volume K Tons Forecast, by Type 2019 & 2032
- Table 143: Global Starch Derivatives Market Revenue Million Forecast, by Source 2019 & 2032
- Table 144: Global Starch Derivatives Market Volume K Tons Forecast, by Source 2019 & 2032
- Table 145: Global Starch Derivatives Market Revenue Million Forecast, by Application 2019 & 2032
- Table 146: Global Starch Derivatives Market Volume K Tons Forecast, by Application 2019 & 2032
- Table 147: Global Starch Derivatives Market Revenue Million Forecast, by Country 2019 & 2032
- Table 148: Global Starch Derivatives Market Volume K Tons Forecast, by Country 2019 & 2032
- Table 149: South Africa Starch Derivatives Market Revenue (Million) Forecast, by Application 2019 & 2032
- Table 150: South Africa Starch Derivatives Market Volume (K Tons) Forecast, by Application 2019 & 2032
- Table 151: United Arab Emirates Starch Derivatives Market Revenue (Million) Forecast, by Application 2019 & 2032
- Table 152: United Arab Emirates Starch Derivatives Market Volume (K Tons) Forecast, by Application 2019 & 2032
- Table 153: Saudi Arabia Starch Derivatives Market Revenue (Million) Forecast, by Application 2019 & 2032
- Table 154: Saudi Arabia Starch Derivatives Market Volume (K Tons) Forecast, by Application 2019 & 2032
- Table 155: Rest of Middle East Starch Derivatives Market Revenue (Million) Forecast, by Application 2019 & 2032
- Table 156: Rest of Middle East Starch Derivatives Market Volume (K Tons) Forecast, by Application 2019 & 2032
Frequently Asked Questions
1. What is the projected Compound Annual Growth Rate (CAGR) of the Starch Derivatives Market?
The projected CAGR is approximately 6.40%.
2. Which companies are prominent players in the Starch Derivatives Market?
Key companies in the market include Cargill Incorporated, Archer Daniels Midland Company, Roquette, Tate & Lyle PLC, Royal Avebe U A (Avebe Nutrition), Tereos S A*List Not Exhaustive, Ingredion Incorporated, Beneo, Cumberland Packing Corp, Glycom.
3. What are the main segments of the Starch Derivatives Market?
The market segments include Type, Source, Application.
4. Can you provide details about the market size?
The market size is estimated to be USD 55700 Million as of 2022.
5. What are some drivers contributing to market growth?
Inclination Towards Fitness and Increasing Intake of Plant-based Protein; Increase in Consumer Inclination Towards Meat Substitutes.
6. What are the notable trends driving market growth?
Modified Starch is Strongly Accelerating the Overall Market For Starch Derivatives.
7. Are there any restraints impacting market growth?
Gluten-Intolerance Among the Population Hindering the Market.
8. Can you provide examples of recent developments in the market?
Cargill's investment in new starch processing facilities to meet growing demand
9. What pricing options are available for accessing the report?
Pricing options include single-user, multi-user, and enterprise licenses priced at USD 4750, USD 5250, and USD 8750 respectively.
10. Is the market size provided in terms of value or volume?
The market size is provided in terms of value, measured in Million and volume, measured in K Tons.
11. Are there any specific market keywords associated with the report?
Yes, the market keyword associated with the report is "Starch Derivatives Market," which aids in identifying and referencing the specific market segment covered.
12. How do I determine which pricing option suits my needs best?
The pricing options vary based on user requirements and access needs. Individual users may opt for single-user licenses, while businesses requiring broader access may choose multi-user or enterprise licenses for cost-effective access to the report.
13. Are there any additional resources or data provided in the Starch Derivatives Market report?
While the report offers comprehensive insights, it's advisable to review the specific contents or supplementary materials provided to ascertain if additional resources or data are available.
14. How can I stay updated on further developments or reports in the Starch Derivatives Market?
To stay informed about further developments, trends, and reports in the Starch Derivatives Market, consider subscribing to industry newsletters, following relevant companies and organizations, or regularly checking reputable industry news sources and publications.
Methodology
Step 1 - Identification of Relevant Samples Size from Population Database


Step 2 - Approaches for Defining Global Market Size (Value, Volume* & Price*)

Note*: In applicable scenarios
Step 3 - Data Sources
Primary Research
- Web Analytics
- Survey Reports
- Research Institute
- Latest Research Reports
- Opinion Leaders
Secondary Research
- Annual Reports
- White Paper
- Latest Press Release
- Industry Association
- Paid Database
- Investor Presentations

Step 4 - Data Triangulation
Involves using different sources of information in order to increase the validity of a study
These sources are likely to be stakeholders in a program - participants, other researchers, program staff, other community members, and so on.
Then we put all data in single framework & apply various statistical tools to find out the dynamic on the market.
During the analysis stage, feedback from the stakeholder groups would be compared to determine areas of agreement as well as areas of divergence
