

Key Insights
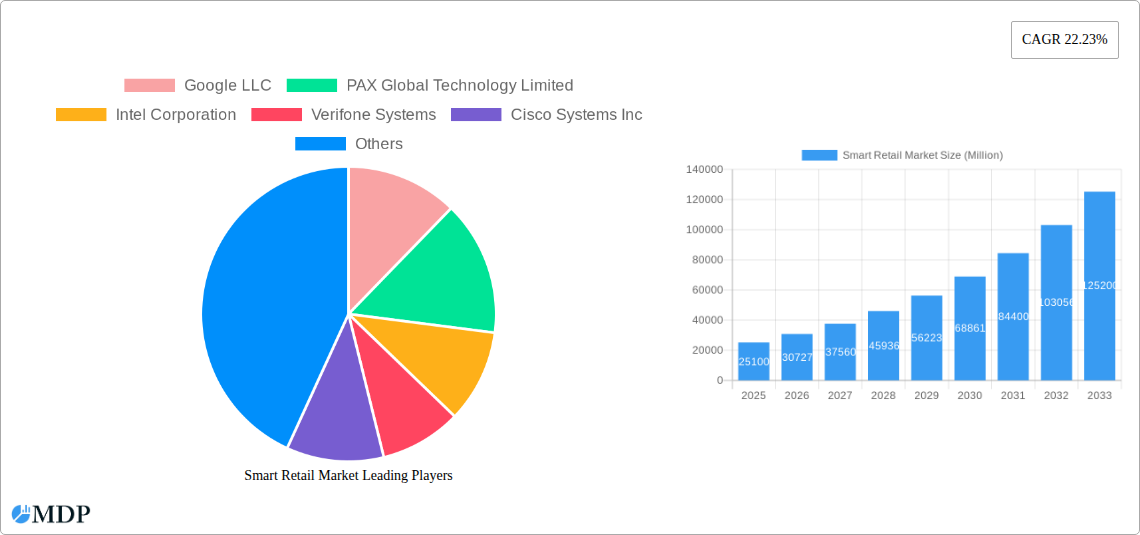
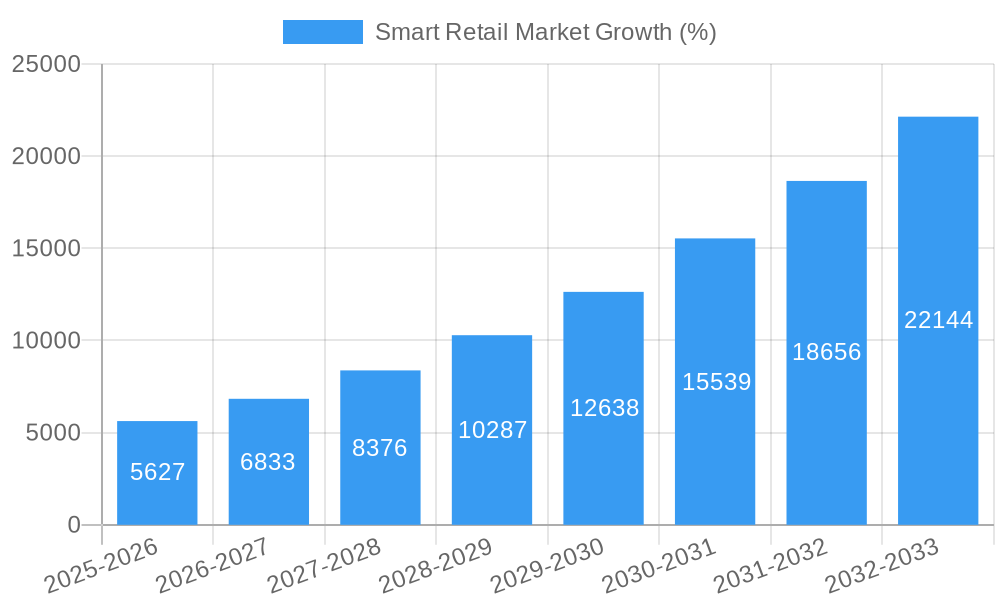
The smart retail market, valued at $25.10 billion in 2025, is experiencing robust growth, projected to expand at a Compound Annual Growth Rate (CAGR) of 22.23% from 2025 to 2033. This surge is driven by the increasing adoption of advanced technologies like AI-powered inventory management, personalized customer experiences through data analytics, and automated checkout systems. Retailers are leveraging these innovations to enhance operational efficiency, optimize supply chains, and create more engaging shopping environments. The integration of IoT devices, such as smart shelves and RFID tags, enables real-time tracking of inventory, improves stock management, and reduces losses due to shrinkage. Furthermore, the growing preference for contactless payments and the rise of omnichannel strategies are accelerating the market's expansion. Key players like Google, Amazon, and Microsoft are heavily investing in developing and deploying smart retail solutions, further fueling this growth. Competition is fierce, with established players and innovative startups vying for market share.
However, the market also faces challenges. High initial investment costs for implementing smart retail technologies can be a barrier for smaller businesses. Concerns surrounding data security and privacy are also significant, necessitating robust cybersecurity measures. The need for skilled personnel to manage and maintain these complex systems presents another hurdle. Despite these restraints, the long-term potential of smart retail is undeniable, promising enhanced customer experiences, improved profitability, and a more efficient and sustainable retail landscape. The market segmentation likely includes categories like hardware (POS systems, sensors, etc.), software (analytics platforms, CRM systems), and services (integration, maintenance). Regional variations will likely reflect existing technological infrastructure and consumer behavior differences across the globe.
Smart Retail Market: A Comprehensive Report (2019-2033)
This comprehensive report provides an in-depth analysis of the Smart Retail Market, offering invaluable insights for stakeholders across the industry. The study period covers 2019-2033, with a focus on the estimated year 2025 and a forecast period of 2025-2033. We delve into market dynamics, industry trends, leading players, and future opportunities, presenting actionable intelligence to guide strategic decision-making. The market is projected to reach xx Million by 2033, exhibiting a CAGR of xx% during the forecast period.
Smart Retail Market Market Dynamics & Concentration
The Smart Retail market is experiencing robust growth, driven by technological advancements, evolving consumer preferences, and increasing investments in digital infrastructure. Market concentration is currently moderate, with several key players holding significant market share. However, the landscape is dynamic, with continuous mergers and acquisitions (M&A) reshaping the competitive structure. During the historical period (2019-2024), approximately xx M&A deals were recorded, consolidating market power and accelerating innovation.
Market Share: Google LLC, Amazon com Inc, and Microsoft currently hold a combined market share of approximately xx%, while other key players like Huawei Technologies Co Ltd, Intel Corporation, and IBM Corporation collectively account for another xx%. The remaining share is distributed across numerous smaller players.
Innovation Drivers: Artificial intelligence (AI), Internet of Things (IoT), big data analytics, and cloud computing are key innovation drivers, enabling personalized shopping experiences, optimized inventory management, and enhanced customer engagement.
Regulatory Frameworks: Government regulations concerning data privacy and cybersecurity are shaping the market landscape, influencing technology adoption and vendor strategies.
Product Substitutes: Traditional retail models pose a significant competitive challenge. However, the convenience and efficiency offered by smart retail solutions are attracting a growing segment of consumers.
End-User Trends: Consumers increasingly expect personalized shopping experiences, seamless omnichannel integration, and efficient checkout processes. This demand fuels the adoption of smart retail technologies.
Smart Retail Market Industry Trends & Analysis
The Smart Retail market is witnessing exponential growth, fueled by several key factors. The increasing adoption of mobile technologies and the rise of e-commerce are driving the demand for seamless online-offline shopping experiences. The integration of AI and IoT technologies is enabling personalized recommendations, smart inventory management, and automated checkout systems, significantly enhancing operational efficiency and customer satisfaction. Market penetration of smart retail solutions in developed economies is currently at xx%, while developing economies show a significantly lower penetration rate of approximately xx%. This disparity presents significant growth opportunities. The market is expected to witness a CAGR of xx% during the forecast period (2025-2033), driven by continuous technological advancements and expanding consumer adoption. The competitive landscape is characterized by intense rivalry among established technology vendors, retail giants, and emerging startups.
Leading Markets & Segments in Smart Retail Market
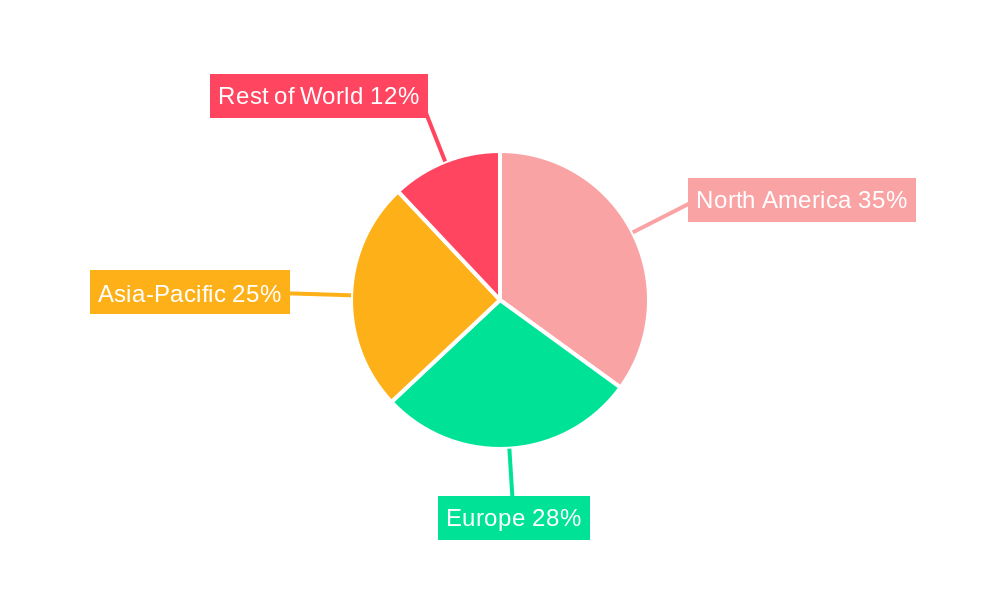
North America currently dominates the Smart Retail market, owing to early adoption of advanced technologies, strong digital infrastructure, and high consumer spending on technology. The region holds approximately xx% of the global market share.
Key Drivers in North America:
- Advanced digital infrastructure and high internet penetration.
- Strong consumer preference for technology-driven shopping experiences.
- Supportive government policies and investments in digital innovation.
Dominance Analysis: The dominance of North America is attributed to its robust technological ecosystem, high consumer spending power, and early adoption of smart retail solutions. While Asia-Pacific and Europe are exhibiting rapid growth, they currently lag behind North America in terms of market penetration.
Smart Retail Market Product Developments
Recent product innovations focus on AI-powered solutions like smart carts (e.g., Caper Carts), automated checkout systems, and enhanced in-store analytics. These technologies offer significant competitive advantages by improving operational efficiency, personalizing customer experiences, and optimizing inventory management. The integration of these technologies with existing retail systems is a key focus area, ensuring seamless integration and enhancing user experience.
Key Drivers of Smart Retail Market Growth
The Smart Retail market's growth is fueled by several converging factors: Technological advancements such as AI, IoT, and cloud computing are enabling personalized shopping experiences and efficient operations. Rising consumer demand for convenient and personalized shopping experiences is driving adoption. Favorable government policies and investments in digital infrastructure are fostering market expansion, particularly in developing economies.
Challenges in the Smart Retail Market Market
The Smart Retail market faces several challenges, including high initial investment costs for implementing smart technologies, concerns over data privacy and security, and the need for robust cybersecurity measures. Integration complexities with existing legacy systems and the lack of skilled workforce in some regions pose additional hurdles. These challenges can limit market adoption and necessitate strategic partnerships to mitigate risks.
Emerging Opportunities in Smart Retail Market
The Smart Retail market presents significant opportunities in emerging economies. The expanding middle class and rising internet penetration are driving demand for technology-driven retail solutions. Strategic partnerships between technology providers and retailers are accelerating innovation and market penetration. The development of new, cost-effective smart retail solutions tailored to the specific needs of developing economies will unlock significant growth potential.
Leading Players in the Smart Retail Market Sector
- Google LLC
- PAX Global Technology Limited
- Intel Corporation
- Verifone Systems
- Cisco Systems Inc
- Huawei Technologies Co Ltd
- IBM Corporation
- Fiserv Inc
- Microsoft
- Honeywell International Inc
- NVIDIA Corporation
- Samsung Electronics
- Amazon com Inc
- NXP Semiconductors
- Caper Inc
- Ingenico Group
- Focal Systems Inc
- LG Display Co Ltd
- NCR Corporation
- *List Not Exhaustive
Key Milestones in Smart Retail Market Industry
June 2024: Instacart launches AI-powered Caper Carts in collaboration with Price Chopper and McKeever's Market & Eatery in Missouri, enhancing the customer shopping experience and streamlining checkout.
February 2024: Huawei introduces its Smart Retail Solution, a comprehensive suite of technologies designed to optimize retail operations, enhance efficiency, and improve the customer experience across various retail formats.
Strategic Outlook for Smart Retail Market Market
The Smart Retail market is poised for sustained growth, driven by continuous technological innovation, evolving consumer expectations, and increasing investments in digital infrastructure. Strategic partnerships between technology vendors and retailers are crucial for accelerating market adoption and realizing the full potential of smart retail solutions. The focus on developing cost-effective, scalable, and secure solutions will be key to unlocking growth opportunities in emerging markets.
Smart Retail Market Segmentation
-
1. Component
- 1.1. Hardware
- 1.2. Software
- 1.3. Services
-
2. Application
- 2.1. Inventory Management
- 2.2. Brand Protection
- 2.3. Foot-Traffic Monitoring
- 2.4. Loyalty Management and Payment
- 2.5. Predictive Equipment Maintenance
- 2.6. Others
Smart Retail Market Segmentation By Geography
- 1. North America
- 2. Europe
- 3. Asia
- 4. Australia and New Zealand
- 5. Latin America
- 6. Middle East and Africa
Smart Retail Market REPORT HIGHLIGHTS
| Aspects | Details |
|---|---|
| Study Period | 2019-2033 |
| Base Year | 2024 |
| Estimated Year | 2025 |
| Forecast Period | 2025-2033 |
| Historical Period | 2019-2024 |
| Growth Rate | CAGR of 22.23% from 2019-2033 |
| Segmentation |
|
Table of Contents
- 1. Introduction
- 1.1. Research Scope
- 1.2. Market Segmentation
- 1.3. Research Methodology
- 1.4. Definitions and Assumptions
- 2. Executive Summary
- 2.1. Introduction
- 3. Market Dynamics
- 3.1. Introduction
- 3.2. Market Drivers
- 3.2.1. Growing Investments in Retail Chains and Retail Supermarkets; Rising Adoption of Advances in Technology Across Retail Chain
- 3.3. Market Restrains
- 3.3.1. Growing Investments in Retail Chains and Retail Supermarkets; Rising Adoption of Advances in Technology Across Retail Chain
- 3.4. Market Trends
- 3.4.1. Inventory Managment Segment is Expected to Hold Significant Market Share
- 4. Market Factor Analysis
- 4.1. Porters Five Forces
- 4.2. Supply/Value Chain
- 4.3. PESTEL analysis
- 4.4. Market Entropy
- 4.5. Patent/Trademark Analysis
- 5. Global Smart Retail Market Analysis, Insights and Forecast, 2019-2031
- 5.1. Market Analysis, Insights and Forecast - by Component
- 5.1.1. Hardware
- 5.1.2. Software
- 5.1.3. Services
- 5.2. Market Analysis, Insights and Forecast - by Application
- 5.2.1. Inventory Management
- 5.2.2. Brand Protection
- 5.2.3. Foot-Traffic Monitoring
- 5.2.4. Loyalty Management and Payment
- 5.2.5. Predictive Equipment Maintenance
- 5.2.6. Others
- 5.3. Market Analysis, Insights and Forecast - by Region
- 5.3.1. North America
- 5.3.2. Europe
- 5.3.3. Asia
- 5.3.4. Australia and New Zealand
- 5.3.5. Latin America
- 5.3.6. Middle East and Africa
- 5.1. Market Analysis, Insights and Forecast - by Component
- 6. North America Smart Retail Market Analysis, Insights and Forecast, 2019-2031
- 6.1. Market Analysis, Insights and Forecast - by Component
- 6.1.1. Hardware
- 6.1.2. Software
- 6.1.3. Services
- 6.2. Market Analysis, Insights and Forecast - by Application
- 6.2.1. Inventory Management
- 6.2.2. Brand Protection
- 6.2.3. Foot-Traffic Monitoring
- 6.2.4. Loyalty Management and Payment
- 6.2.5. Predictive Equipment Maintenance
- 6.2.6. Others
- 6.1. Market Analysis, Insights and Forecast - by Component
- 7. Europe Smart Retail Market Analysis, Insights and Forecast, 2019-2031
- 7.1. Market Analysis, Insights and Forecast - by Component
- 7.1.1. Hardware
- 7.1.2. Software
- 7.1.3. Services
- 7.2. Market Analysis, Insights and Forecast - by Application
- 7.2.1. Inventory Management
- 7.2.2. Brand Protection
- 7.2.3. Foot-Traffic Monitoring
- 7.2.4. Loyalty Management and Payment
- 7.2.5. Predictive Equipment Maintenance
- 7.2.6. Others
- 7.1. Market Analysis, Insights and Forecast - by Component
- 8. Asia Smart Retail Market Analysis, Insights and Forecast, 2019-2031
- 8.1. Market Analysis, Insights and Forecast - by Component
- 8.1.1. Hardware
- 8.1.2. Software
- 8.1.3. Services
- 8.2. Market Analysis, Insights and Forecast - by Application
- 8.2.1. Inventory Management
- 8.2.2. Brand Protection
- 8.2.3. Foot-Traffic Monitoring
- 8.2.4. Loyalty Management and Payment
- 8.2.5. Predictive Equipment Maintenance
- 8.2.6. Others
- 8.1. Market Analysis, Insights and Forecast - by Component
- 9. Australia and New Zealand Smart Retail Market Analysis, Insights and Forecast, 2019-2031
- 9.1. Market Analysis, Insights and Forecast - by Component
- 9.1.1. Hardware
- 9.1.2. Software
- 9.1.3. Services
- 9.2. Market Analysis, Insights and Forecast - by Application
- 9.2.1. Inventory Management
- 9.2.2. Brand Protection
- 9.2.3. Foot-Traffic Monitoring
- 9.2.4. Loyalty Management and Payment
- 9.2.5. Predictive Equipment Maintenance
- 9.2.6. Others
- 9.1. Market Analysis, Insights and Forecast - by Component
- 10. Latin America Smart Retail Market Analysis, Insights and Forecast, 2019-2031
- 10.1. Market Analysis, Insights and Forecast - by Component
- 10.1.1. Hardware
- 10.1.2. Software
- 10.1.3. Services
- 10.2. Market Analysis, Insights and Forecast - by Application
- 10.2.1. Inventory Management
- 10.2.2. Brand Protection
- 10.2.3. Foot-Traffic Monitoring
- 10.2.4. Loyalty Management and Payment
- 10.2.5. Predictive Equipment Maintenance
- 10.2.6. Others
- 10.1. Market Analysis, Insights and Forecast - by Component
- 11. Middle East and Africa Smart Retail Market Analysis, Insights and Forecast, 2019-2031
- 11.1. Market Analysis, Insights and Forecast - by Component
- 11.1.1. Hardware
- 11.1.2. Software
- 11.1.3. Services
- 11.2. Market Analysis, Insights and Forecast - by Application
- 11.2.1. Inventory Management
- 11.2.2. Brand Protection
- 11.2.3. Foot-Traffic Monitoring
- 11.2.4. Loyalty Management and Payment
- 11.2.5. Predictive Equipment Maintenance
- 11.2.6. Others
- 11.1. Market Analysis, Insights and Forecast - by Component
- 12. Competitive Analysis
- 12.1. Global Market Share Analysis 2024
- 12.2. Company Profiles
- 12.2.1 Google LLC
- 12.2.1.1. Overview
- 12.2.1.2. Products
- 12.2.1.3. SWOT Analysis
- 12.2.1.4. Recent Developments
- 12.2.1.5. Financials (Based on Availability)
- 12.2.2 PAX Global Technology Limited
- 12.2.2.1. Overview
- 12.2.2.2. Products
- 12.2.2.3. SWOT Analysis
- 12.2.2.4. Recent Developments
- 12.2.2.5. Financials (Based on Availability)
- 12.2.3 Intel Corporation
- 12.2.3.1. Overview
- 12.2.3.2. Products
- 12.2.3.3. SWOT Analysis
- 12.2.3.4. Recent Developments
- 12.2.3.5. Financials (Based on Availability)
- 12.2.4 Verifone Systems
- 12.2.4.1. Overview
- 12.2.4.2. Products
- 12.2.4.3. SWOT Analysis
- 12.2.4.4. Recent Developments
- 12.2.4.5. Financials (Based on Availability)
- 12.2.5 Cisco Systems Inc
- 12.2.5.1. Overview
- 12.2.5.2. Products
- 12.2.5.3. SWOT Analysis
- 12.2.5.4. Recent Developments
- 12.2.5.5. Financials (Based on Availability)
- 12.2.6 Huawei Technologies Co Ltd
- 12.2.6.1. Overview
- 12.2.6.2. Products
- 12.2.6.3. SWOT Analysis
- 12.2.6.4. Recent Developments
- 12.2.6.5. Financials (Based on Availability)
- 12.2.7 IBM Corporation
- 12.2.7.1. Overview
- 12.2.7.2. Products
- 12.2.7.3. SWOT Analysis
- 12.2.7.4. Recent Developments
- 12.2.7.5. Financials (Based on Availability)
- 12.2.8 Fiserv Inc
- 12.2.8.1. Overview
- 12.2.8.2. Products
- 12.2.8.3. SWOT Analysis
- 12.2.8.4. Recent Developments
- 12.2.8.5. Financials (Based on Availability)
- 12.2.9 Microsoft
- 12.2.9.1. Overview
- 12.2.9.2. Products
- 12.2.9.3. SWOT Analysis
- 12.2.9.4. Recent Developments
- 12.2.9.5. Financials (Based on Availability)
- 12.2.10 Honeywell International Inc
- 12.2.10.1. Overview
- 12.2.10.2. Products
- 12.2.10.3. SWOT Analysis
- 12.2.10.4. Recent Developments
- 12.2.10.5. Financials (Based on Availability)
- 12.2.11 NVIDIA Corporation
- 12.2.11.1. Overview
- 12.2.11.2. Products
- 12.2.11.3. SWOT Analysis
- 12.2.11.4. Recent Developments
- 12.2.11.5. Financials (Based on Availability)
- 12.2.12 Samsung Electronics
- 12.2.12.1. Overview
- 12.2.12.2. Products
- 12.2.12.3. SWOT Analysis
- 12.2.12.4. Recent Developments
- 12.2.12.5. Financials (Based on Availability)
- 12.2.13 Amazon com Inc
- 12.2.13.1. Overview
- 12.2.13.2. Products
- 12.2.13.3. SWOT Analysis
- 12.2.13.4. Recent Developments
- 12.2.13.5. Financials (Based on Availability)
- 12.2.14 NXP Semiconductors
- 12.2.14.1. Overview
- 12.2.14.2. Products
- 12.2.14.3. SWOT Analysis
- 12.2.14.4. Recent Developments
- 12.2.14.5. Financials (Based on Availability)
- 12.2.15 Caper Inc
- 12.2.15.1. Overview
- 12.2.15.2. Products
- 12.2.15.3. SWOT Analysis
- 12.2.15.4. Recent Developments
- 12.2.15.5. Financials (Based on Availability)
- 12.2.16 Ingenico Group
- 12.2.16.1. Overview
- 12.2.16.2. Products
- 12.2.16.3. SWOT Analysis
- 12.2.16.4. Recent Developments
- 12.2.16.5. Financials (Based on Availability)
- 12.2.17 Focal Systems Inc
- 12.2.17.1. Overview
- 12.2.17.2. Products
- 12.2.17.3. SWOT Analysis
- 12.2.17.4. Recent Developments
- 12.2.17.5. Financials (Based on Availability)
- 12.2.18 LG Display Co Ltd
- 12.2.18.1. Overview
- 12.2.18.2. Products
- 12.2.18.3. SWOT Analysis
- 12.2.18.4. Recent Developments
- 12.2.18.5. Financials (Based on Availability)
- 12.2.19 NCR Corporation*List Not Exhaustive
- 12.2.19.1. Overview
- 12.2.19.2. Products
- 12.2.19.3. SWOT Analysis
- 12.2.19.4. Recent Developments
- 12.2.19.5. Financials (Based on Availability)
- 12.2.1 Google LLC
List of Figures
- Figure 1: Global Smart Retail Market Revenue Breakdown (Million, %) by Region 2024 & 2032
- Figure 2: Global Smart Retail Market Volume Breakdown (Billion, %) by Region 2024 & 2032
- Figure 3: North America Smart Retail Market Revenue (Million), by Component 2024 & 2032
- Figure 4: North America Smart Retail Market Volume (Billion), by Component 2024 & 2032
- Figure 5: North America Smart Retail Market Revenue Share (%), by Component 2024 & 2032
- Figure 6: North America Smart Retail Market Volume Share (%), by Component 2024 & 2032
- Figure 7: North America Smart Retail Market Revenue (Million), by Application 2024 & 2032
- Figure 8: North America Smart Retail Market Volume (Billion), by Application 2024 & 2032
- Figure 9: North America Smart Retail Market Revenue Share (%), by Application 2024 & 2032
- Figure 10: North America Smart Retail Market Volume Share (%), by Application 2024 & 2032
- Figure 11: North America Smart Retail Market Revenue (Million), by Country 2024 & 2032
- Figure 12: North America Smart Retail Market Volume (Billion), by Country 2024 & 2032
- Figure 13: North America Smart Retail Market Revenue Share (%), by Country 2024 & 2032
- Figure 14: North America Smart Retail Market Volume Share (%), by Country 2024 & 2032
- Figure 15: Europe Smart Retail Market Revenue (Million), by Component 2024 & 2032
- Figure 16: Europe Smart Retail Market Volume (Billion), by Component 2024 & 2032
- Figure 17: Europe Smart Retail Market Revenue Share (%), by Component 2024 & 2032
- Figure 18: Europe Smart Retail Market Volume Share (%), by Component 2024 & 2032
- Figure 19: Europe Smart Retail Market Revenue (Million), by Application 2024 & 2032
- Figure 20: Europe Smart Retail Market Volume (Billion), by Application 2024 & 2032
- Figure 21: Europe Smart Retail Market Revenue Share (%), by Application 2024 & 2032
- Figure 22: Europe Smart Retail Market Volume Share (%), by Application 2024 & 2032
- Figure 23: Europe Smart Retail Market Revenue (Million), by Country 2024 & 2032
- Figure 24: Europe Smart Retail Market Volume (Billion), by Country 2024 & 2032
- Figure 25: Europe Smart Retail Market Revenue Share (%), by Country 2024 & 2032
- Figure 26: Europe Smart Retail Market Volume Share (%), by Country 2024 & 2032
- Figure 27: Asia Smart Retail Market Revenue (Million), by Component 2024 & 2032
- Figure 28: Asia Smart Retail Market Volume (Billion), by Component 2024 & 2032
- Figure 29: Asia Smart Retail Market Revenue Share (%), by Component 2024 & 2032
- Figure 30: Asia Smart Retail Market Volume Share (%), by Component 2024 & 2032
- Figure 31: Asia Smart Retail Market Revenue (Million), by Application 2024 & 2032
- Figure 32: Asia Smart Retail Market Volume (Billion), by Application 2024 & 2032
- Figure 33: Asia Smart Retail Market Revenue Share (%), by Application 2024 & 2032
- Figure 34: Asia Smart Retail Market Volume Share (%), by Application 2024 & 2032
- Figure 35: Asia Smart Retail Market Revenue (Million), by Country 2024 & 2032
- Figure 36: Asia Smart Retail Market Volume (Billion), by Country 2024 & 2032
- Figure 37: Asia Smart Retail Market Revenue Share (%), by Country 2024 & 2032
- Figure 38: Asia Smart Retail Market Volume Share (%), by Country 2024 & 2032
- Figure 39: Australia and New Zealand Smart Retail Market Revenue (Million), by Component 2024 & 2032
- Figure 40: Australia and New Zealand Smart Retail Market Volume (Billion), by Component 2024 & 2032
- Figure 41: Australia and New Zealand Smart Retail Market Revenue Share (%), by Component 2024 & 2032
- Figure 42: Australia and New Zealand Smart Retail Market Volume Share (%), by Component 2024 & 2032
- Figure 43: Australia and New Zealand Smart Retail Market Revenue (Million), by Application 2024 & 2032
- Figure 44: Australia and New Zealand Smart Retail Market Volume (Billion), by Application 2024 & 2032
- Figure 45: Australia and New Zealand Smart Retail Market Revenue Share (%), by Application 2024 & 2032
- Figure 46: Australia and New Zealand Smart Retail Market Volume Share (%), by Application 2024 & 2032
- Figure 47: Australia and New Zealand Smart Retail Market Revenue (Million), by Country 2024 & 2032
- Figure 48: Australia and New Zealand Smart Retail Market Volume (Billion), by Country 2024 & 2032
- Figure 49: Australia and New Zealand Smart Retail Market Revenue Share (%), by Country 2024 & 2032
- Figure 50: Australia and New Zealand Smart Retail Market Volume Share (%), by Country 2024 & 2032
- Figure 51: Latin America Smart Retail Market Revenue (Million), by Component 2024 & 2032
- Figure 52: Latin America Smart Retail Market Volume (Billion), by Component 2024 & 2032
- Figure 53: Latin America Smart Retail Market Revenue Share (%), by Component 2024 & 2032
- Figure 54: Latin America Smart Retail Market Volume Share (%), by Component 2024 & 2032
- Figure 55: Latin America Smart Retail Market Revenue (Million), by Application 2024 & 2032
- Figure 56: Latin America Smart Retail Market Volume (Billion), by Application 2024 & 2032
- Figure 57: Latin America Smart Retail Market Revenue Share (%), by Application 2024 & 2032
- Figure 58: Latin America Smart Retail Market Volume Share (%), by Application 2024 & 2032
- Figure 59: Latin America Smart Retail Market Revenue (Million), by Country 2024 & 2032
- Figure 60: Latin America Smart Retail Market Volume (Billion), by Country 2024 & 2032
- Figure 61: Latin America Smart Retail Market Revenue Share (%), by Country 2024 & 2032
- Figure 62: Latin America Smart Retail Market Volume Share (%), by Country 2024 & 2032
- Figure 63: Middle East and Africa Smart Retail Market Revenue (Million), by Component 2024 & 2032
- Figure 64: Middle East and Africa Smart Retail Market Volume (Billion), by Component 2024 & 2032
- Figure 65: Middle East and Africa Smart Retail Market Revenue Share (%), by Component 2024 & 2032
- Figure 66: Middle East and Africa Smart Retail Market Volume Share (%), by Component 2024 & 2032
- Figure 67: Middle East and Africa Smart Retail Market Revenue (Million), by Application 2024 & 2032
- Figure 68: Middle East and Africa Smart Retail Market Volume (Billion), by Application 2024 & 2032
- Figure 69: Middle East and Africa Smart Retail Market Revenue Share (%), by Application 2024 & 2032
- Figure 70: Middle East and Africa Smart Retail Market Volume Share (%), by Application 2024 & 2032
- Figure 71: Middle East and Africa Smart Retail Market Revenue (Million), by Country 2024 & 2032
- Figure 72: Middle East and Africa Smart Retail Market Volume (Billion), by Country 2024 & 2032
- Figure 73: Middle East and Africa Smart Retail Market Revenue Share (%), by Country 2024 & 2032
- Figure 74: Middle East and Africa Smart Retail Market Volume Share (%), by Country 2024 & 2032
List of Tables
- Table 1: Global Smart Retail Market Revenue Million Forecast, by Region 2019 & 2032
- Table 2: Global Smart Retail Market Volume Billion Forecast, by Region 2019 & 2032
- Table 3: Global Smart Retail Market Revenue Million Forecast, by Component 2019 & 2032
- Table 4: Global Smart Retail Market Volume Billion Forecast, by Component 2019 & 2032
- Table 5: Global Smart Retail Market Revenue Million Forecast, by Application 2019 & 2032
- Table 6: Global Smart Retail Market Volume Billion Forecast, by Application 2019 & 2032
- Table 7: Global Smart Retail Market Revenue Million Forecast, by Region 2019 & 2032
- Table 8: Global Smart Retail Market Volume Billion Forecast, by Region 2019 & 2032
- Table 9: Global Smart Retail Market Revenue Million Forecast, by Component 2019 & 2032
- Table 10: Global Smart Retail Market Volume Billion Forecast, by Component 2019 & 2032
- Table 11: Global Smart Retail Market Revenue Million Forecast, by Application 2019 & 2032
- Table 12: Global Smart Retail Market Volume Billion Forecast, by Application 2019 & 2032
- Table 13: Global Smart Retail Market Revenue Million Forecast, by Country 2019 & 2032
- Table 14: Global Smart Retail Market Volume Billion Forecast, by Country 2019 & 2032
- Table 15: Global Smart Retail Market Revenue Million Forecast, by Component 2019 & 2032
- Table 16: Global Smart Retail Market Volume Billion Forecast, by Component 2019 & 2032
- Table 17: Global Smart Retail Market Revenue Million Forecast, by Application 2019 & 2032
- Table 18: Global Smart Retail Market Volume Billion Forecast, by Application 2019 & 2032
- Table 19: Global Smart Retail Market Revenue Million Forecast, by Country 2019 & 2032
- Table 20: Global Smart Retail Market Volume Billion Forecast, by Country 2019 & 2032
- Table 21: Global Smart Retail Market Revenue Million Forecast, by Component 2019 & 2032
- Table 22: Global Smart Retail Market Volume Billion Forecast, by Component 2019 & 2032
- Table 23: Global Smart Retail Market Revenue Million Forecast, by Application 2019 & 2032
- Table 24: Global Smart Retail Market Volume Billion Forecast, by Application 2019 & 2032
- Table 25: Global Smart Retail Market Revenue Million Forecast, by Country 2019 & 2032
- Table 26: Global Smart Retail Market Volume Billion Forecast, by Country 2019 & 2032
- Table 27: Global Smart Retail Market Revenue Million Forecast, by Component 2019 & 2032
- Table 28: Global Smart Retail Market Volume Billion Forecast, by Component 2019 & 2032
- Table 29: Global Smart Retail Market Revenue Million Forecast, by Application 2019 & 2032
- Table 30: Global Smart Retail Market Volume Billion Forecast, by Application 2019 & 2032
- Table 31: Global Smart Retail Market Revenue Million Forecast, by Country 2019 & 2032
- Table 32: Global Smart Retail Market Volume Billion Forecast, by Country 2019 & 2032
- Table 33: Global Smart Retail Market Revenue Million Forecast, by Component 2019 & 2032
- Table 34: Global Smart Retail Market Volume Billion Forecast, by Component 2019 & 2032
- Table 35: Global Smart Retail Market Revenue Million Forecast, by Application 2019 & 2032
- Table 36: Global Smart Retail Market Volume Billion Forecast, by Application 2019 & 2032
- Table 37: Global Smart Retail Market Revenue Million Forecast, by Country 2019 & 2032
- Table 38: Global Smart Retail Market Volume Billion Forecast, by Country 2019 & 2032
- Table 39: Global Smart Retail Market Revenue Million Forecast, by Component 2019 & 2032
- Table 40: Global Smart Retail Market Volume Billion Forecast, by Component 2019 & 2032
- Table 41: Global Smart Retail Market Revenue Million Forecast, by Application 2019 & 2032
- Table 42: Global Smart Retail Market Volume Billion Forecast, by Application 2019 & 2032
- Table 43: Global Smart Retail Market Revenue Million Forecast, by Country 2019 & 2032
- Table 44: Global Smart Retail Market Volume Billion Forecast, by Country 2019 & 2032
Frequently Asked Questions
1. What is the projected Compound Annual Growth Rate (CAGR) of the Smart Retail Market?
The projected CAGR is approximately 22.23%.
2. Which companies are prominent players in the Smart Retail Market?
Key companies in the market include Google LLC, PAX Global Technology Limited, Intel Corporation, Verifone Systems, Cisco Systems Inc, Huawei Technologies Co Ltd, IBM Corporation, Fiserv Inc, Microsoft, Honeywell International Inc, NVIDIA Corporation, Samsung Electronics, Amazon com Inc, NXP Semiconductors, Caper Inc, Ingenico Group, Focal Systems Inc, LG Display Co Ltd, NCR Corporation*List Not Exhaustive.
3. What are the main segments of the Smart Retail Market?
The market segments include Component, Application.
4. Can you provide details about the market size?
The market size is estimated to be USD 25.10 Million as of 2022.
5. What are some drivers contributing to market growth?
Growing Investments in Retail Chains and Retail Supermarkets; Rising Adoption of Advances in Technology Across Retail Chain.
6. What are the notable trends driving market growth?
Inventory Managment Segment is Expected to Hold Significant Market Share.
7. Are there any restraints impacting market growth?
Growing Investments in Retail Chains and Retail Supermarkets; Rising Adoption of Advances in Technology Across Retail Chain.
8. Can you provide examples of recent developments in the market?
June 2024: Instacart, in collaboration with Price Chopper and McKeever's Market & Eatery, announced the introduction of Caper Carts, which are powered by artificial intelligence, at select locations in Missouri. These innovative smart carts enhance the shopping experience by enabling customers to scan items while they shop easily, monitor their grocery budget in real time, and bypass the checkout line altogether.
9. What pricing options are available for accessing the report?
Pricing options include single-user, multi-user, and enterprise licenses priced at USD 4750, USD 5250, and USD 8750 respectively.
10. Is the market size provided in terms of value or volume?
The market size is provided in terms of value, measured in Million and volume, measured in Billion.
11. Are there any specific market keywords associated with the report?
Yes, the market keyword associated with the report is "Smart Retail Market," which aids in identifying and referencing the specific market segment covered.
12. How do I determine which pricing option suits my needs best?
The pricing options vary based on user requirements and access needs. Individual users may opt for single-user licenses, while businesses requiring broader access may choose multi-user or enterprise licenses for cost-effective access to the report.
13. Are there any additional resources or data provided in the Smart Retail Market report?
While the report offers comprehensive insights, it's advisable to review the specific contents or supplementary materials provided to ascertain if additional resources or data are available.
14. How can I stay updated on further developments or reports in the Smart Retail Market?
To stay informed about further developments, trends, and reports in the Smart Retail Market, consider subscribing to industry newsletters, following relevant companies and organizations, or regularly checking reputable industry news sources and publications.
Methodology
Step 1 - Identification of Relevant Samples Size from Population Database


Step 2 - Approaches for Defining Global Market Size (Value, Volume* & Price*)

Note*: In applicable scenarios
Step 3 - Data Sources
Primary Research
- Web Analytics
- Survey Reports
- Research Institute
- Latest Research Reports
- Opinion Leaders
Secondary Research
- Annual Reports
- White Paper
- Latest Press Release
- Industry Association
- Paid Database
- Investor Presentations

Step 4 - Data Triangulation
Involves using different sources of information in order to increase the validity of a study
These sources are likely to be stakeholders in a program - participants, other researchers, program staff, other community members, and so on.
Then we put all data in single framework & apply various statistical tools to find out the dynamic on the market.
During the analysis stage, feedback from the stakeholder groups would be compared to determine areas of agreement as well as areas of divergence
