

Key Insights
The global Silicon Carbide Tray market is poised for substantial growth, projected to reach approximately \$450 million by 2025 with a robust Compound Annual Growth Rate (CAGR) of around 12% through 2033. This upward trajectory is primarily driven by the burgeoning semiconductor industry, where silicon carbide (SiC) trays are indispensable for high-temperature processes like ICP etching, semiconductor diffusion, and MOCVD epitaxy. The increasing demand for advanced electronic components, electric vehicles (EVs), and renewable energy infrastructure, all of which rely heavily on high-performance semiconductors, directly fuels the market for these specialized trays. Furthermore, the superior thermal conductivity, chemical inertness, and mechanical strength of silicon carbide make it the material of choice for demanding semiconductor manufacturing environments, further cementing its market position.
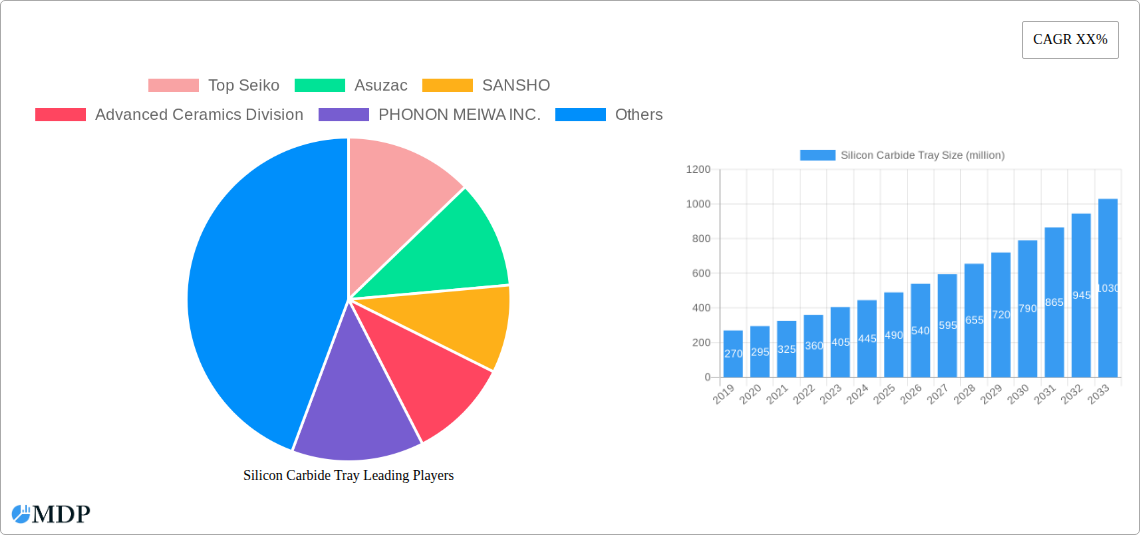
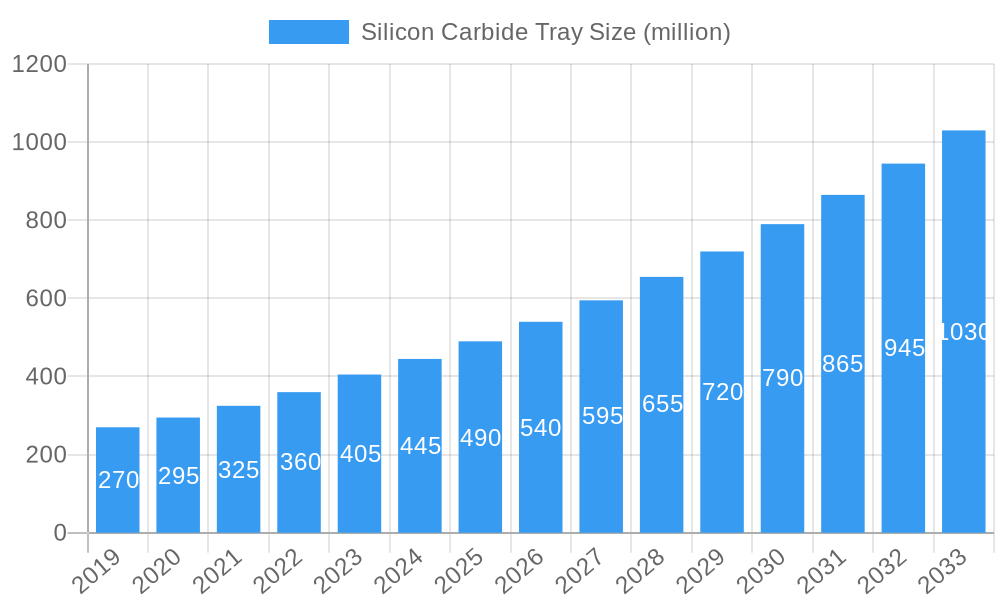
Silicon Carbide Tray Market Size (In Million)
The market's expansion is further supported by ongoing technological advancements in SiC material processing and tray design, leading to improved performance and cost-effectiveness. Key trends include the development of highly customized tray solutions to meet specific semiconductor fabrication needs and the increasing adoption of SiC trays in emerging applications beyond traditional semiconductor manufacturing, such as in advanced aerospace and industrial heating systems. While the market demonstrates significant promise, potential restraints could include the high initial cost of SiC material and manufacturing, as well as potential supply chain disruptions for raw materials. However, the continuous innovation in production techniques and the inherent benefits of SiC are expected to outweigh these challenges, ensuring sustained market growth. The Asia Pacific region, led by China, Japan, and South Korea, is anticipated to dominate the market due to its strong semiconductor manufacturing base and significant investments in advanced technology.
Silicon Carbide Tray Company Market Share
Unlocking Growth: The Comprehensive Silicon Carbide Tray Market Report (2019-2033)
This in-depth market research report provides a definitive analysis of the global Silicon Carbide (SiC) Tray market. Spanning from 2019 to 2033, with a base year of 2025, this report offers unparalleled insights into market dynamics, leading players, technological advancements, and future growth trajectories. Designed for industry stakeholders, including manufacturers, suppliers, investors, and R&D professionals, this report is essential for strategic decision-making in the rapidly evolving semiconductor and advanced materials sectors. Our analysis covers critical applications such as ICP Etching, Semiconductor Diffusion, and MOCVD Epitaxy, and delves into product types including Above 99.9% and Above 99.99% purity SiC Trays.
Silicon Carbide Tray Market Dynamics & Concentration
The Silicon Carbide Tray market is characterized by a moderate to high concentration, with key players dominating a significant portion of the global market share. Innovation remains a primary driver, fueled by the relentless demand for enhanced performance and reliability in semiconductor manufacturing processes. Regulatory frameworks, particularly concerning environmental standards and material safety, are increasingly influencing production and material sourcing. Product substitutes, while present in niche applications, struggle to match the superior thermal conductivity, chemical resistance, and mechanical strength of silicon carbide for demanding semiconductor environments. End-user trends are strongly dictated by the miniaturization and increased complexity of semiconductor devices, necessitating more precise and durable processing equipment. Mergers and acquisitions (M&A) activities are observed, albeit sporadically, as larger entities seek to consolidate market position and integrate advanced manufacturing capabilities. M&A deal counts are estimated to be around 5-10 annually within the last study period, with an average deal value in the tens of millions. Market share for the top five players is approximately 65%.
Silicon Carbide Tray Industry Trends & Analysis
The Silicon Carbide Tray industry is poised for robust expansion, driven by several interconnected trends and technological advancements. The burgeoning demand for advanced semiconductors, particularly for applications in 5G infrastructure, electric vehicles, artificial intelligence, and high-performance computing, directly fuels the need for high-quality silicon carbide trays. These trays are indispensable components in critical semiconductor fabrication steps such as ICP etching, diffusion, and epitaxy, where their exceptional thermal stability and resistance to corrosive environments are paramount. Technological disruptions are primarily focused on improving the purity of silicon carbide materials, enhancing tray design for better wafer handling and thermal uniformity, and developing cost-effective manufacturing processes. Consumer preferences, in this context, translate to an industry-wide push for trays that offer longer service life, reduced particle generation, and improved yield for semiconductor manufacturers. The competitive dynamics are shaping up with an increasing emphasis on vertical integration, from raw material sourcing to specialized tray manufacturing. Market penetration is steadily rising, with an estimated CAGR of 12% over the forecast period. The market is projected to grow from an estimated $500 million in 2025 to over $1,200 million by 2033. The adoption rate of SiC trays in newer semiconductor fabrication lines is expected to reach 85% by 2030. Furthermore, research into advanced SiC composite materials for even greater resilience is a significant ongoing trend. The drive for smaller, more powerful, and energy-efficient electronic devices necessitates processing at higher temperatures and with more aggressive chemicals, areas where SiC trays excel, thus creating a sustained demand. The growing complexity of wafer designs and the increasing number of wafer processing steps also contribute to the demand for reliable and durable trays that can withstand repeated cycles without degradation. The integration of automation in semiconductor manufacturing further emphasizes the need for precision components like SiC trays that can be reliably handled and processed.
Leading Markets & Segments in Silicon Carbide Tray
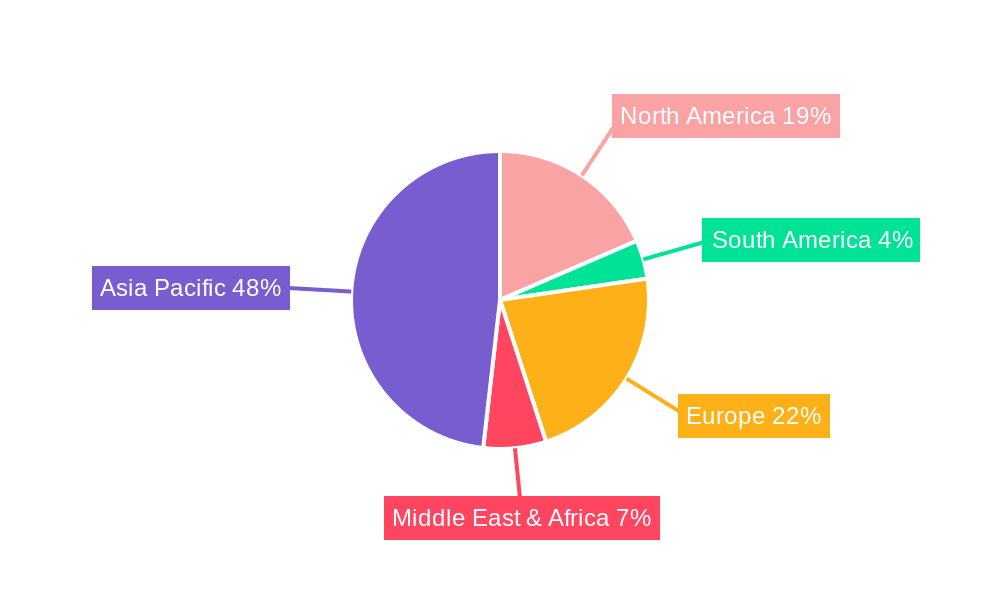
The Asia Pacific region is the undisputed leader in the global Silicon Carbide Tray market, driven by the colossal presence of semiconductor manufacturing hubs in China, South Korea, Taiwan, and Japan. The sheer volume of semiconductor fabrication facilities in this region, coupled with aggressive government support for the electronics industry, makes it the largest consumer of SiC trays. Within Asia Pacific, China stands out as a dominant country, experiencing unprecedented growth in its domestic semiconductor industry. This growth is supported by substantial economic policies, significant infrastructure investments in industrial parks, and a strategic focus on achieving semiconductor self-sufficiency.
Application Dominance:
- ICP Etching: This segment holds a significant market share due to the critical role of ICP etching in creating intricate patterns on semiconductor wafers. The high-energy plasma used in this process demands materials like silicon carbide that can withstand extreme temperatures and reactive environments. The increasing complexity of integrated circuits and the demand for smaller feature sizes further propel the growth of ICP etching and, consequently, SiC trays used in it.
- Semiconductor Diffusion: Diffusion processes, crucial for introducing dopants into semiconductor materials, often involve high-temperature furnace treatments. SiC trays provide the necessary thermal stability and chemical inertness to ensure uniform diffusion and prevent contamination, making this a substantial application segment.
- MOCVD Epitaxy: Metal-Organic Chemical Vapor Deposition (MOCVD) is vital for growing thin films of semiconductor materials. The high temperatures and corrosive precursor gases involved necessitate the use of SiC trays for their exceptional performance and longevity in these demanding epitaxy processes. The growth in advanced semiconductor materials like GaN and SiC itself for power electronics fuels this segment.
Type Dominance:
- Above 99.99% Purity: This segment is experiencing the fastest growth. The ultra-high purity requirements for advanced semiconductor nodes, particularly those used in cutting-edge consumer electronics, automotive applications, and high-performance computing, drive the demand for SiC trays with minimal impurities to prevent wafer contamination and ensure device reliability. The investment in next-generation semiconductor technologies by major global players directly translates to increased demand for these premium SiC trays.
The dominance of these segments and regions is further reinforced by a continuous drive for technological advancement and yield improvement in semiconductor manufacturing, where the reliability and performance of processing equipment are paramount.
Silicon Carbide Tray Product Developments
Recent product developments in the Silicon Carbide Tray market focus on enhancing thermal uniformity and minimizing particle generation for next-generation semiconductor fabrication. Innovations include advanced surface treatments for reduced wafer adhesion and improved cleanroom compatibility, as well as optimized tray geometries for better gas flow dynamics in epitaxy and diffusion processes. These developments offer competitive advantages by increasing wafer yield, extending tray service life, and ensuring higher purity in semiconductor manufacturing. The market is seeing a rise in custom-designed trays to meet specific customer requirements for highly specialized fabrication steps, indicating a trend towards tailored solutions and advanced material science integration.
Key Drivers of Silicon Carbide Tray Growth
The growth of the Silicon Carbide Tray market is propelled by several key factors. Firstly, the escalating demand for advanced semiconductors in emerging technologies such as 5G, electric vehicles (EVs), and artificial intelligence (AI) is a primary driver. Secondly, the inherent superior properties of silicon carbide, including exceptional thermal conductivity, high-temperature resistance, and chemical inertness, make it indispensable for demanding semiconductor processing steps like ICP etching and MOCVD epitaxy. Thirdly, ongoing technological advancements in semiconductor manufacturing processes necessitate more robust and reliable processing equipment, directly benefiting SiC tray manufacturers. Finally, supportive government initiatives and substantial investments in the semiconductor industry worldwide, particularly in Asia, further bolster market expansion. The increasing complexity of semiconductor chips and the need for higher wafer processing yields are also significant growth accelerators.
Challenges in the Silicon Carbide Tray Market
Despite its robust growth, the Silicon Carbide Tray market faces several challenges. The high cost of raw silicon carbide materials and complex manufacturing processes can lead to elevated product pricing, potentially limiting adoption for some applications or manufacturers with tighter budgets. Stringent quality control requirements in semiconductor manufacturing demand extremely high purity and consistency, posing production challenges. Furthermore, the supply chain for specialized SiC powders can be subject to volatility, impacting material availability and lead times. Intense competition among established players and emerging manufacturers also pressures profit margins, necessitating continuous innovation and cost optimization. The intricate nature of semiconductor fabrication also means that any disruptions in the SiC tray supply chain can have significant downstream impacts, estimated to cause production delays valued at tens of millions for affected fabs.
Emerging Opportunities in Silicon Carbide Tray
Emerging opportunities in the Silicon Carbide Tray market are centered on technological innovation and strategic market expansion. The increasing adoption of wide-bandgap semiconductors like GaN and SiC for power electronics presents a significant opportunity for specialized SiC trays used in their fabrication. Furthermore, advancements in SiC composite materials and advanced coating technologies offer potential for developing trays with even greater performance characteristics, catering to the most demanding applications. Strategic partnerships between SiC tray manufacturers and leading semiconductor equipment providers can unlock new avenues for product integration and market penetration. The growing demand for SiC trays in non-semiconductor applications, such as high-temperature industrial furnaces and advanced aerospace components, also represents a burgeoning market segment.
Leading Players in the Silicon Carbide Tray Sector
- Top Seiko
- Asuzac
- SANSHO
- Advanced Ceramics Division
- PHONON MEIWA INC.
- AGC
- Suntec
- Morimura BROS
- ZHWE
- Kallex
- 3X Ceramic Parts Company
- Xianyang Research & Dsesign Institude of Ceramics
- Jiangsu Tangzi New Material
- Dongguan Nuoyi Precision Ceramic Technology
- Shenzhen Fountyl
- Zhengzhou Sanmo (Sinomach Group)
Key Milestones in Silicon Carbide Tray Industry
- 2019 January: Increased demand for high-purity SiC trays driven by 5G infrastructure development.
- 2020 March: Major players invest in expanding SiC manufacturing capacity to meet rising semiconductor demand.
- 2021 July: Development of novel SiC composite materials for enhanced thermal shock resistance in trays.
- 2022 February: Introduction of advanced surface treatments for SiC trays to minimize particle generation.
- 2023 September: Growing adoption of SiC trays in electric vehicle component manufacturing.
- 2024 April: Emerging players focus on cost-effective manufacturing techniques for SiC trays.
Strategic Outlook for Silicon Carbide Tray Market
The strategic outlook for the Silicon Carbide Tray market is overwhelmingly positive, driven by sustained innovation and the indispensable role of SiC trays in the advancement of semiconductor technology. Growth accelerators include the continued proliferation of AI, autonomous driving, and advanced consumer electronics, all of which rely on increasingly sophisticated semiconductor components. Investment in new fabrication facilities and the upgrade of existing ones will ensure a consistent demand for high-performance SiC trays. The market will witness further specialization, with manufacturers developing bespoke solutions for emerging applications and materials. Strategic collaborations and a focus on sustainable manufacturing practices will also be key to capturing future market share and driving long-term success in this dynamic sector. The estimated market size for the SiC tray market is expected to reach $2,500 million by 2033.
Silicon Carbide Tray Segmentation
-
1. Application
- 1.1. ICP Etching
- 1.2. Semiconductor Diffusion
- 1.3. MOCVD Epitaxy
- 1.4. Other
-
2. Types
- 2.1. Above 99.9%
- 2.2. Above 99.99%
- 2.3. Other
Silicon Carbide Tray Segmentation By Geography
-
1. North America
- 1.1. United States
- 1.2. Canada
- 1.3. Mexico
-
2. South America
- 2.1. Brazil
- 2.2. Argentina
- 2.3. Rest of South America
-
3. Europe
- 3.1. United Kingdom
- 3.2. Germany
- 3.3. France
- 3.4. Italy
- 3.5. Spain
- 3.6. Russia
- 3.7. Benelux
- 3.8. Nordics
- 3.9. Rest of Europe
-
4. Middle East & Africa
- 4.1. Turkey
- 4.2. Israel
- 4.3. GCC
- 4.4. North Africa
- 4.5. South Africa
- 4.6. Rest of Middle East & Africa
-
5. Asia Pacific
- 5.1. China
- 5.2. India
- 5.3. Japan
- 5.4. South Korea
- 5.5. ASEAN
- 5.6. Oceania
- 5.7. Rest of Asia Pacific
Silicon Carbide Tray Regional Market Share
Geographic Coverage of Silicon Carbide Tray
Silicon Carbide Tray REPORT HIGHLIGHTS
| Aspects | Details |
|---|---|
| Study Period | 2020-2034 |
| Base Year | 2025 |
| Estimated Year | 2026 |
| Forecast Period | 2026-2034 |
| Historical Period | 2020-2025 |
| Growth Rate | CAGR of 25.7% from 2020-2034 |
| Segmentation |
|
Table of Contents
- 1. Introduction
- 1.1. Research Scope
- 1.2. Market Segmentation
- 1.3. Research Objective
- 1.4. Definitions and Assumptions
- 2. Executive Summary
- 2.1. Market Snapshot
- 3. Market Dynamics
- 3.1. Market Drivers
- 3.2. Market Restrains
- 3.3. Market Trends
- 3.4. Market Opportunities
- 4. Market Factor Analysis
- 4.1. Porters Five Forces
- 4.1.1. Bargaining Power of Suppliers
- 4.1.2. Bargaining Power of Buyers
- 4.1.3. Threat of New Entrants
- 4.1.4. Threat of Substitutes
- 4.1.5. Competitive Rivalry
- 4.2. PESTEL analysis
- 4.3. BCG Analysis
- 4.3.1. Stars (High Growth, High Market Share)
- 4.3.2. Cash Cows (Low Growth, High Market Share)
- 4.3.3. Question Mark (High Growth, Low Market Share)
- 4.3.4. Dogs (Low Growth, Low Market Share)
- 4.4. Ansoff Matrix Analysis
- 4.5. Supply Chain Analysis
- 4.6. Regulatory Landscape
- 4.7. Current Market Potential and Opportunity Assessment (TAM–SAM–SOM Framework)
- 4.8. MDP Analyst Note
- 4.1. Porters Five Forces
- 5. Market Analysis, Insights and Forecast 2021-2033
- 5.1. Market Analysis, Insights and Forecast - by Application
- 5.1.1. ICP Etching
- 5.1.2. Semiconductor Diffusion
- 5.1.3. MOCVD Epitaxy
- 5.1.4. Other
- 5.2. Market Analysis, Insights and Forecast - by Types
- 5.2.1. Above 99.9%
- 5.2.2. Above 99.99%
- 5.2.3. Other
- 5.3. Market Analysis, Insights and Forecast - by Region
- 5.3.1. North America
- 5.3.2. South America
- 5.3.3. Europe
- 5.3.4. Middle East & Africa
- 5.3.5. Asia Pacific
- 5.1. Market Analysis, Insights and Forecast - by Application
- 6. Global Silicon Carbide Tray Analysis, Insights and Forecast, 2021-2033
- 6.1. Market Analysis, Insights and Forecast - by Application
- 6.1.1. ICP Etching
- 6.1.2. Semiconductor Diffusion
- 6.1.3. MOCVD Epitaxy
- 6.1.4. Other
- 6.2. Market Analysis, Insights and Forecast - by Types
- 6.2.1. Above 99.9%
- 6.2.2. Above 99.99%
- 6.2.3. Other
- 6.1. Market Analysis, Insights and Forecast - by Application
- 7. North America Silicon Carbide Tray Analysis, Insights and Forecast, 2020-2032
- 7.1. Market Analysis, Insights and Forecast - by Application
- 7.1.1. ICP Etching
- 7.1.2. Semiconductor Diffusion
- 7.1.3. MOCVD Epitaxy
- 7.1.4. Other
- 7.2. Market Analysis, Insights and Forecast - by Types
- 7.2.1. Above 99.9%
- 7.2.2. Above 99.99%
- 7.2.3. Other
- 7.1. Market Analysis, Insights and Forecast - by Application
- 8. South America Silicon Carbide Tray Analysis, Insights and Forecast, 2020-2032
- 8.1. Market Analysis, Insights and Forecast - by Application
- 8.1.1. ICP Etching
- 8.1.2. Semiconductor Diffusion
- 8.1.3. MOCVD Epitaxy
- 8.1.4. Other
- 8.2. Market Analysis, Insights and Forecast - by Types
- 8.2.1. Above 99.9%
- 8.2.2. Above 99.99%
- 8.2.3. Other
- 8.1. Market Analysis, Insights and Forecast - by Application
- 9. Europe Silicon Carbide Tray Analysis, Insights and Forecast, 2020-2032
- 9.1. Market Analysis, Insights and Forecast - by Application
- 9.1.1. ICP Etching
- 9.1.2. Semiconductor Diffusion
- 9.1.3. MOCVD Epitaxy
- 9.1.4. Other
- 9.2. Market Analysis, Insights and Forecast - by Types
- 9.2.1. Above 99.9%
- 9.2.2. Above 99.99%
- 9.2.3. Other
- 9.1. Market Analysis, Insights and Forecast - by Application
- 10. Middle East & Africa Silicon Carbide Tray Analysis, Insights and Forecast, 2020-2032
- 10.1. Market Analysis, Insights and Forecast - by Application
- 10.1.1. ICP Etching
- 10.1.2. Semiconductor Diffusion
- 10.1.3. MOCVD Epitaxy
- 10.1.4. Other
- 10.2. Market Analysis, Insights and Forecast - by Types
- 10.2.1. Above 99.9%
- 10.2.2. Above 99.99%
- 10.2.3. Other
- 10.1. Market Analysis, Insights and Forecast - by Application
- 11. Asia Pacific Silicon Carbide Tray Analysis, Insights and Forecast, 2020-2032
- 11.1. Market Analysis, Insights and Forecast - by Application
- 11.1.1. ICP Etching
- 11.1.2. Semiconductor Diffusion
- 11.1.3. MOCVD Epitaxy
- 11.1.4. Other
- 11.2. Market Analysis, Insights and Forecast - by Types
- 11.2.1. Above 99.9%
- 11.2.2. Above 99.99%
- 11.2.3. Other
- 11.1. Market Analysis, Insights and Forecast - by Application
- 12. Competitive Analysis
- 12.1. Company Profiles
- 12.1.1 Top Seiko
- 12.1.1.1. Company Overview
- 12.1.1.2. Products
- 12.1.1.3. Company Financials
- 12.1.1.4. SWOT Analysis
- 12.1.2 Asuzac
- 12.1.2.1. Company Overview
- 12.1.2.2. Products
- 12.1.2.3. Company Financials
- 12.1.2.4. SWOT Analysis
- 12.1.3 SANSHO
- 12.1.3.1. Company Overview
- 12.1.3.2. Products
- 12.1.3.3. Company Financials
- 12.1.3.4. SWOT Analysis
- 12.1.4 Advanced Ceramics Division
- 12.1.4.1. Company Overview
- 12.1.4.2. Products
- 12.1.4.3. Company Financials
- 12.1.4.4. SWOT Analysis
- 12.1.5 PHONON MEIWA INC.
- 12.1.5.1. Company Overview
- 12.1.5.2. Products
- 12.1.5.3. Company Financials
- 12.1.5.4. SWOT Analysis
- 12.1.6 AGC
- 12.1.6.1. Company Overview
- 12.1.6.2. Products
- 12.1.6.3. Company Financials
- 12.1.6.4. SWOT Analysis
- 12.1.7 Suntec
- 12.1.7.1. Company Overview
- 12.1.7.2. Products
- 12.1.7.3. Company Financials
- 12.1.7.4. SWOT Analysis
- 12.1.8 Morimura BROS
- 12.1.8.1. Company Overview
- 12.1.8.2. Products
- 12.1.8.3. Company Financials
- 12.1.8.4. SWOT Analysis
- 12.1.9 ZHWE
- 12.1.9.1. Company Overview
- 12.1.9.2. Products
- 12.1.9.3. Company Financials
- 12.1.9.4. SWOT Analysis
- 12.1.10 Kallex
- 12.1.10.1. Company Overview
- 12.1.10.2. Products
- 12.1.10.3. Company Financials
- 12.1.10.4. SWOT Analysis
- 12.1.11 3X Ceramic Parts Company
- 12.1.11.1. Company Overview
- 12.1.11.2. Products
- 12.1.11.3. Company Financials
- 12.1.11.4. SWOT Analysis
- 12.1.12 Xianyang Research & Dsesign Institude of Ceramics
- 12.1.12.1. Company Overview
- 12.1.12.2. Products
- 12.1.12.3. Company Financials
- 12.1.12.4. SWOT Analysis
- 12.1.13 Jiangsu Tangzi New Material
- 12.1.13.1. Company Overview
- 12.1.13.2. Products
- 12.1.13.3. Company Financials
- 12.1.13.4. SWOT Analysis
- 12.1.14 Dongguan Nuoyi Precision Ceramic Technology
- 12.1.14.1. Company Overview
- 12.1.14.2. Products
- 12.1.14.3. Company Financials
- 12.1.14.4. SWOT Analysis
- 12.1.15 Shenzhen Fountyl
- 12.1.15.1. Company Overview
- 12.1.15.2. Products
- 12.1.15.3. Company Financials
- 12.1.15.4. SWOT Analysis
- 12.1.16 Zhengzhou Sanmo (Sinomach Group)
- 12.1.16.1. Company Overview
- 12.1.16.2. Products
- 12.1.16.3. Company Financials
- 12.1.16.4. SWOT Analysis
- 12.1.1 Top Seiko
- 12.2. Market Entropy
- 12.2.1 Company's Key Areas Served
- 12.2.2 Recent Developments
- 12.3. Company Market Share Analysis 2025
- 12.3.1 Top 5 Companies Market Share Analysis
- 12.3.2 Top 3 Companies Market Share Analysis
- 12.4. List of Potential Customers
- 13. Research Methodology
List of Figures
- Figure 1: Global Silicon Carbide Tray Revenue Breakdown (billion, %) by Region 2025 & 2033
- Figure 2: Global Silicon Carbide Tray Volume Breakdown (K, %) by Region 2025 & 2033
- Figure 3: North America Silicon Carbide Tray Revenue (billion), by Application 2025 & 2033
- Figure 4: North America Silicon Carbide Tray Volume (K), by Application 2025 & 2033
- Figure 5: North America Silicon Carbide Tray Revenue Share (%), by Application 2025 & 2033
- Figure 6: North America Silicon Carbide Tray Volume Share (%), by Application 2025 & 2033
- Figure 7: North America Silicon Carbide Tray Revenue (billion), by Types 2025 & 2033
- Figure 8: North America Silicon Carbide Tray Volume (K), by Types 2025 & 2033
- Figure 9: North America Silicon Carbide Tray Revenue Share (%), by Types 2025 & 2033
- Figure 10: North America Silicon Carbide Tray Volume Share (%), by Types 2025 & 2033
- Figure 11: North America Silicon Carbide Tray Revenue (billion), by Country 2025 & 2033
- Figure 12: North America Silicon Carbide Tray Volume (K), by Country 2025 & 2033
- Figure 13: North America Silicon Carbide Tray Revenue Share (%), by Country 2025 & 2033
- Figure 14: North America Silicon Carbide Tray Volume Share (%), by Country 2025 & 2033
- Figure 15: South America Silicon Carbide Tray Revenue (billion), by Application 2025 & 2033
- Figure 16: South America Silicon Carbide Tray Volume (K), by Application 2025 & 2033
- Figure 17: South America Silicon Carbide Tray Revenue Share (%), by Application 2025 & 2033
- Figure 18: South America Silicon Carbide Tray Volume Share (%), by Application 2025 & 2033
- Figure 19: South America Silicon Carbide Tray Revenue (billion), by Types 2025 & 2033
- Figure 20: South America Silicon Carbide Tray Volume (K), by Types 2025 & 2033
- Figure 21: South America Silicon Carbide Tray Revenue Share (%), by Types 2025 & 2033
- Figure 22: South America Silicon Carbide Tray Volume Share (%), by Types 2025 & 2033
- Figure 23: South America Silicon Carbide Tray Revenue (billion), by Country 2025 & 2033
- Figure 24: South America Silicon Carbide Tray Volume (K), by Country 2025 & 2033
- Figure 25: South America Silicon Carbide Tray Revenue Share (%), by Country 2025 & 2033
- Figure 26: South America Silicon Carbide Tray Volume Share (%), by Country 2025 & 2033
- Figure 27: Europe Silicon Carbide Tray Revenue (billion), by Application 2025 & 2033
- Figure 28: Europe Silicon Carbide Tray Volume (K), by Application 2025 & 2033
- Figure 29: Europe Silicon Carbide Tray Revenue Share (%), by Application 2025 & 2033
- Figure 30: Europe Silicon Carbide Tray Volume Share (%), by Application 2025 & 2033
- Figure 31: Europe Silicon Carbide Tray Revenue (billion), by Types 2025 & 2033
- Figure 32: Europe Silicon Carbide Tray Volume (K), by Types 2025 & 2033
- Figure 33: Europe Silicon Carbide Tray Revenue Share (%), by Types 2025 & 2033
- Figure 34: Europe Silicon Carbide Tray Volume Share (%), by Types 2025 & 2033
- Figure 35: Europe Silicon Carbide Tray Revenue (billion), by Country 2025 & 2033
- Figure 36: Europe Silicon Carbide Tray Volume (K), by Country 2025 & 2033
- Figure 37: Europe Silicon Carbide Tray Revenue Share (%), by Country 2025 & 2033
- Figure 38: Europe Silicon Carbide Tray Volume Share (%), by Country 2025 & 2033
- Figure 39: Middle East & Africa Silicon Carbide Tray Revenue (billion), by Application 2025 & 2033
- Figure 40: Middle East & Africa Silicon Carbide Tray Volume (K), by Application 2025 & 2033
- Figure 41: Middle East & Africa Silicon Carbide Tray Revenue Share (%), by Application 2025 & 2033
- Figure 42: Middle East & Africa Silicon Carbide Tray Volume Share (%), by Application 2025 & 2033
- Figure 43: Middle East & Africa Silicon Carbide Tray Revenue (billion), by Types 2025 & 2033
- Figure 44: Middle East & Africa Silicon Carbide Tray Volume (K), by Types 2025 & 2033
- Figure 45: Middle East & Africa Silicon Carbide Tray Revenue Share (%), by Types 2025 & 2033
- Figure 46: Middle East & Africa Silicon Carbide Tray Volume Share (%), by Types 2025 & 2033
- Figure 47: Middle East & Africa Silicon Carbide Tray Revenue (billion), by Country 2025 & 2033
- Figure 48: Middle East & Africa Silicon Carbide Tray Volume (K), by Country 2025 & 2033
- Figure 49: Middle East & Africa Silicon Carbide Tray Revenue Share (%), by Country 2025 & 2033
- Figure 50: Middle East & Africa Silicon Carbide Tray Volume Share (%), by Country 2025 & 2033
- Figure 51: Asia Pacific Silicon Carbide Tray Revenue (billion), by Application 2025 & 2033
- Figure 52: Asia Pacific Silicon Carbide Tray Volume (K), by Application 2025 & 2033
- Figure 53: Asia Pacific Silicon Carbide Tray Revenue Share (%), by Application 2025 & 2033
- Figure 54: Asia Pacific Silicon Carbide Tray Volume Share (%), by Application 2025 & 2033
- Figure 55: Asia Pacific Silicon Carbide Tray Revenue (billion), by Types 2025 & 2033
- Figure 56: Asia Pacific Silicon Carbide Tray Volume (K), by Types 2025 & 2033
- Figure 57: Asia Pacific Silicon Carbide Tray Revenue Share (%), by Types 2025 & 2033
- Figure 58: Asia Pacific Silicon Carbide Tray Volume Share (%), by Types 2025 & 2033
- Figure 59: Asia Pacific Silicon Carbide Tray Revenue (billion), by Country 2025 & 2033
- Figure 60: Asia Pacific Silicon Carbide Tray Volume (K), by Country 2025 & 2033
- Figure 61: Asia Pacific Silicon Carbide Tray Revenue Share (%), by Country 2025 & 2033
- Figure 62: Asia Pacific Silicon Carbide Tray Volume Share (%), by Country 2025 & 2033
List of Tables
- Table 1: Global Silicon Carbide Tray Revenue billion Forecast, by Application 2020 & 2033
- Table 2: Global Silicon Carbide Tray Volume K Forecast, by Application 2020 & 2033
- Table 3: Global Silicon Carbide Tray Revenue billion Forecast, by Types 2020 & 2033
- Table 4: Global Silicon Carbide Tray Volume K Forecast, by Types 2020 & 2033
- Table 5: Global Silicon Carbide Tray Revenue billion Forecast, by Region 2020 & 2033
- Table 6: Global Silicon Carbide Tray Volume K Forecast, by Region 2020 & 2033
- Table 7: Global Silicon Carbide Tray Revenue billion Forecast, by Application 2020 & 2033
- Table 8: Global Silicon Carbide Tray Volume K Forecast, by Application 2020 & 2033
- Table 9: Global Silicon Carbide Tray Revenue billion Forecast, by Types 2020 & 2033
- Table 10: Global Silicon Carbide Tray Volume K Forecast, by Types 2020 & 2033
- Table 11: Global Silicon Carbide Tray Revenue billion Forecast, by Country 2020 & 2033
- Table 12: Global Silicon Carbide Tray Volume K Forecast, by Country 2020 & 2033
- Table 13: United States Silicon Carbide Tray Revenue (billion) Forecast, by Application 2020 & 2033
- Table 14: United States Silicon Carbide Tray Volume (K) Forecast, by Application 2020 & 2033
- Table 15: Canada Silicon Carbide Tray Revenue (billion) Forecast, by Application 2020 & 2033
- Table 16: Canada Silicon Carbide Tray Volume (K) Forecast, by Application 2020 & 2033
- Table 17: Mexico Silicon Carbide Tray Revenue (billion) Forecast, by Application 2020 & 2033
- Table 18: Mexico Silicon Carbide Tray Volume (K) Forecast, by Application 2020 & 2033
- Table 19: Global Silicon Carbide Tray Revenue billion Forecast, by Application 2020 & 2033
- Table 20: Global Silicon Carbide Tray Volume K Forecast, by Application 2020 & 2033
- Table 21: Global Silicon Carbide Tray Revenue billion Forecast, by Types 2020 & 2033
- Table 22: Global Silicon Carbide Tray Volume K Forecast, by Types 2020 & 2033
- Table 23: Global Silicon Carbide Tray Revenue billion Forecast, by Country 2020 & 2033
- Table 24: Global Silicon Carbide Tray Volume K Forecast, by Country 2020 & 2033
- Table 25: Brazil Silicon Carbide Tray Revenue (billion) Forecast, by Application 2020 & 2033
- Table 26: Brazil Silicon Carbide Tray Volume (K) Forecast, by Application 2020 & 2033
- Table 27: Argentina Silicon Carbide Tray Revenue (billion) Forecast, by Application 2020 & 2033
- Table 28: Argentina Silicon Carbide Tray Volume (K) Forecast, by Application 2020 & 2033
- Table 29: Rest of South America Silicon Carbide Tray Revenue (billion) Forecast, by Application 2020 & 2033
- Table 30: Rest of South America Silicon Carbide Tray Volume (K) Forecast, by Application 2020 & 2033
- Table 31: Global Silicon Carbide Tray Revenue billion Forecast, by Application 2020 & 2033
- Table 32: Global Silicon Carbide Tray Volume K Forecast, by Application 2020 & 2033
- Table 33: Global Silicon Carbide Tray Revenue billion Forecast, by Types 2020 & 2033
- Table 34: Global Silicon Carbide Tray Volume K Forecast, by Types 2020 & 2033
- Table 35: Global Silicon Carbide Tray Revenue billion Forecast, by Country 2020 & 2033
- Table 36: Global Silicon Carbide Tray Volume K Forecast, by Country 2020 & 2033
- Table 37: United Kingdom Silicon Carbide Tray Revenue (billion) Forecast, by Application 2020 & 2033
- Table 38: United Kingdom Silicon Carbide Tray Volume (K) Forecast, by Application 2020 & 2033
- Table 39: Germany Silicon Carbide Tray Revenue (billion) Forecast, by Application 2020 & 2033
- Table 40: Germany Silicon Carbide Tray Volume (K) Forecast, by Application 2020 & 2033
- Table 41: France Silicon Carbide Tray Revenue (billion) Forecast, by Application 2020 & 2033
- Table 42: France Silicon Carbide Tray Volume (K) Forecast, by Application 2020 & 2033
- Table 43: Italy Silicon Carbide Tray Revenue (billion) Forecast, by Application 2020 & 2033
- Table 44: Italy Silicon Carbide Tray Volume (K) Forecast, by Application 2020 & 2033
- Table 45: Spain Silicon Carbide Tray Revenue (billion) Forecast, by Application 2020 & 2033
- Table 46: Spain Silicon Carbide Tray Volume (K) Forecast, by Application 2020 & 2033
- Table 47: Russia Silicon Carbide Tray Revenue (billion) Forecast, by Application 2020 & 2033
- Table 48: Russia Silicon Carbide Tray Volume (K) Forecast, by Application 2020 & 2033
- Table 49: Benelux Silicon Carbide Tray Revenue (billion) Forecast, by Application 2020 & 2033
- Table 50: Benelux Silicon Carbide Tray Volume (K) Forecast, by Application 2020 & 2033
- Table 51: Nordics Silicon Carbide Tray Revenue (billion) Forecast, by Application 2020 & 2033
- Table 52: Nordics Silicon Carbide Tray Volume (K) Forecast, by Application 2020 & 2033
- Table 53: Rest of Europe Silicon Carbide Tray Revenue (billion) Forecast, by Application 2020 & 2033
- Table 54: Rest of Europe Silicon Carbide Tray Volume (K) Forecast, by Application 2020 & 2033
- Table 55: Global Silicon Carbide Tray Revenue billion Forecast, by Application 2020 & 2033
- Table 56: Global Silicon Carbide Tray Volume K Forecast, by Application 2020 & 2033
- Table 57: Global Silicon Carbide Tray Revenue billion Forecast, by Types 2020 & 2033
- Table 58: Global Silicon Carbide Tray Volume K Forecast, by Types 2020 & 2033
- Table 59: Global Silicon Carbide Tray Revenue billion Forecast, by Country 2020 & 2033
- Table 60: Global Silicon Carbide Tray Volume K Forecast, by Country 2020 & 2033
- Table 61: Turkey Silicon Carbide Tray Revenue (billion) Forecast, by Application 2020 & 2033
- Table 62: Turkey Silicon Carbide Tray Volume (K) Forecast, by Application 2020 & 2033
- Table 63: Israel Silicon Carbide Tray Revenue (billion) Forecast, by Application 2020 & 2033
- Table 64: Israel Silicon Carbide Tray Volume (K) Forecast, by Application 2020 & 2033
- Table 65: GCC Silicon Carbide Tray Revenue (billion) Forecast, by Application 2020 & 2033
- Table 66: GCC Silicon Carbide Tray Volume (K) Forecast, by Application 2020 & 2033
- Table 67: North Africa Silicon Carbide Tray Revenue (billion) Forecast, by Application 2020 & 2033
- Table 68: North Africa Silicon Carbide Tray Volume (K) Forecast, by Application 2020 & 2033
- Table 69: South Africa Silicon Carbide Tray Revenue (billion) Forecast, by Application 2020 & 2033
- Table 70: South Africa Silicon Carbide Tray Volume (K) Forecast, by Application 2020 & 2033
- Table 71: Rest of Middle East & Africa Silicon Carbide Tray Revenue (billion) Forecast, by Application 2020 & 2033
- Table 72: Rest of Middle East & Africa Silicon Carbide Tray Volume (K) Forecast, by Application 2020 & 2033
- Table 73: Global Silicon Carbide Tray Revenue billion Forecast, by Application 2020 & 2033
- Table 74: Global Silicon Carbide Tray Volume K Forecast, by Application 2020 & 2033
- Table 75: Global Silicon Carbide Tray Revenue billion Forecast, by Types 2020 & 2033
- Table 76: Global Silicon Carbide Tray Volume K Forecast, by Types 2020 & 2033
- Table 77: Global Silicon Carbide Tray Revenue billion Forecast, by Country 2020 & 2033
- Table 78: Global Silicon Carbide Tray Volume K Forecast, by Country 2020 & 2033
- Table 79: China Silicon Carbide Tray Revenue (billion) Forecast, by Application 2020 & 2033
- Table 80: China Silicon Carbide Tray Volume (K) Forecast, by Application 2020 & 2033
- Table 81: India Silicon Carbide Tray Revenue (billion) Forecast, by Application 2020 & 2033
- Table 82: India Silicon Carbide Tray Volume (K) Forecast, by Application 2020 & 2033
- Table 83: Japan Silicon Carbide Tray Revenue (billion) Forecast, by Application 2020 & 2033
- Table 84: Japan Silicon Carbide Tray Volume (K) Forecast, by Application 2020 & 2033
- Table 85: South Korea Silicon Carbide Tray Revenue (billion) Forecast, by Application 2020 & 2033
- Table 86: South Korea Silicon Carbide Tray Volume (K) Forecast, by Application 2020 & 2033
- Table 87: ASEAN Silicon Carbide Tray Revenue (billion) Forecast, by Application 2020 & 2033
- Table 88: ASEAN Silicon Carbide Tray Volume (K) Forecast, by Application 2020 & 2033
- Table 89: Oceania Silicon Carbide Tray Revenue (billion) Forecast, by Application 2020 & 2033
- Table 90: Oceania Silicon Carbide Tray Volume (K) Forecast, by Application 2020 & 2033
- Table 91: Rest of Asia Pacific Silicon Carbide Tray Revenue (billion) Forecast, by Application 2020 & 2033
- Table 92: Rest of Asia Pacific Silicon Carbide Tray Volume (K) Forecast, by Application 2020 & 2033
Frequently Asked Questions
1. What is the projected Compound Annual Growth Rate (CAGR) of the Silicon Carbide Tray?
The projected CAGR is approximately 25.7%.
2. Which companies are prominent players in the Silicon Carbide Tray?
Key companies in the market include Top Seiko, Asuzac, SANSHO, Advanced Ceramics Division, PHONON MEIWA INC., AGC, Suntec, Morimura BROS, ZHWE, Kallex, 3X Ceramic Parts Company, Xianyang Research & Dsesign Institude of Ceramics, Jiangsu Tangzi New Material, Dongguan Nuoyi Precision Ceramic Technology, Shenzhen Fountyl, Zhengzhou Sanmo (Sinomach Group).
3. What are the main segments of the Silicon Carbide Tray?
The market segments include Application, Types.
4. Can you provide details about the market size?
The market size is estimated to be USD 3.83 billion as of 2022.
5. What are some drivers contributing to market growth?
N/A
6. What are the notable trends driving market growth?
N/A
7. Are there any restraints impacting market growth?
N/A
8. Can you provide examples of recent developments in the market?
N/A
9. What pricing options are available for accessing the report?
Pricing options include single-user, multi-user, and enterprise licenses priced at USD 3350.00, USD 5025.00, and USD 6700.00 respectively.
10. Is the market size provided in terms of value or volume?
The market size is provided in terms of value, measured in billion and volume, measured in K.
11. Are there any specific market keywords associated with the report?
Yes, the market keyword associated with the report is "Silicon Carbide Tray," which aids in identifying and referencing the specific market segment covered.
12. How do I determine which pricing option suits my needs best?
The pricing options vary based on user requirements and access needs. Individual users may opt for single-user licenses, while businesses requiring broader access may choose multi-user or enterprise licenses for cost-effective access to the report.
13. Are there any additional resources or data provided in the Silicon Carbide Tray report?
While the report offers comprehensive insights, it's advisable to review the specific contents or supplementary materials provided to ascertain if additional resources or data are available.
14. How can I stay updated on further developments or reports in the Silicon Carbide Tray?
To stay informed about further developments, trends, and reports in the Silicon Carbide Tray, consider subscribing to industry newsletters, following relevant companies and organizations, or regularly checking reputable industry news sources and publications.
Methodology
Step 1 - Identification of Relevant Samples Size from Population Database


Step 2 - Approaches for Defining Global Market Size (Value, Volume* & Price*)

Note*: In applicable scenarios
Step 3 - Data Sources
Primary Research
- Web Analytics
- Survey Reports
- Research Institute
- Latest Research Reports
- Opinion Leaders
Secondary Research
- Annual Reports
- White Paper
- Latest Press Release
- Industry Association
- Paid Database
- Investor Presentations

Step 4 - Data Triangulation
Involves using different sources of information in order to increase the validity of a study
These sources are likely to be stakeholders in a program - participants, other researchers, program staff, other community members, and so on.
Then we put all data in single framework & apply various statistical tools to find out the dynamic on the market.
During the analysis stage, feedback from the stakeholder groups would be compared to determine areas of agreement as well as areas of divergence