

Key Insights
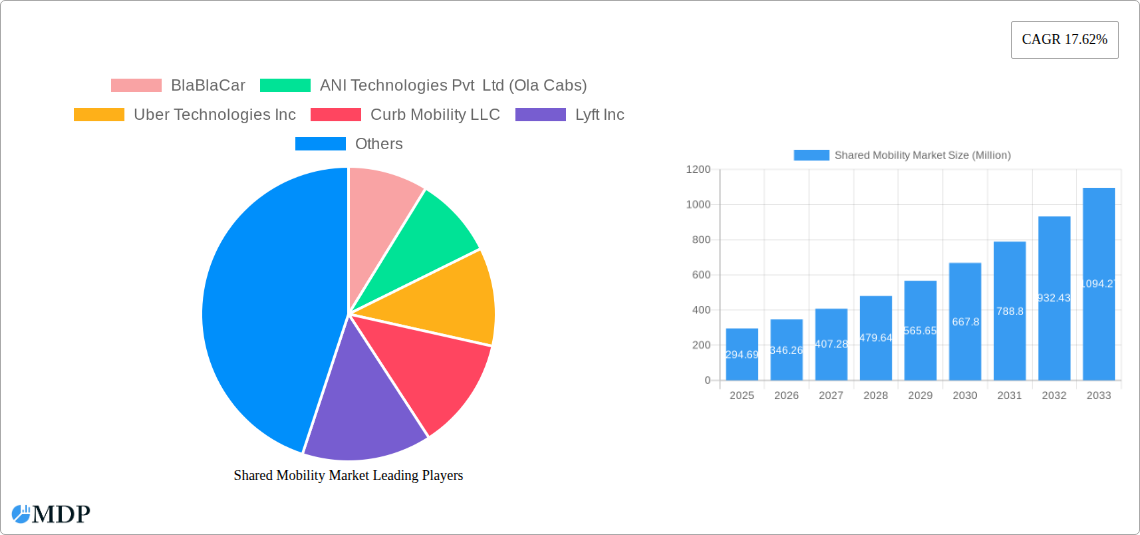
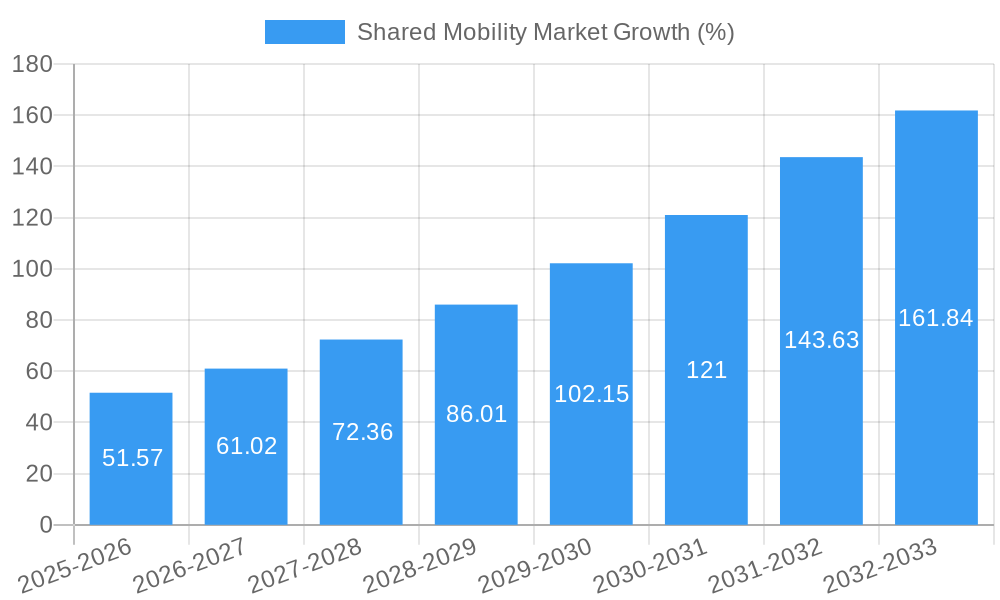
The shared mobility market, valued at $294.69 million in 2025, is projected to experience robust growth, driven by increasing urbanization, rising environmental concerns, and the convenience offered by on-demand transportation solutions. A Compound Annual Growth Rate (CAGR) of 17.62% from 2025 to 2033 indicates a significant expansion of this sector. Key growth drivers include the rising adoption of ride-hailing services, the increasing popularity of electric micromobility options like e-bikes and e-scooters, and the growing preference for shared car ownership models. Furthermore, technological advancements, such as improved ride-sharing apps and autonomous vehicle development, are poised to further accelerate market growth. While regulatory hurdles and potential safety concerns related to micromobility present challenges, the overall market outlook remains positive, fueled by evolving consumer preferences and supportive government initiatives promoting sustainable transportation.
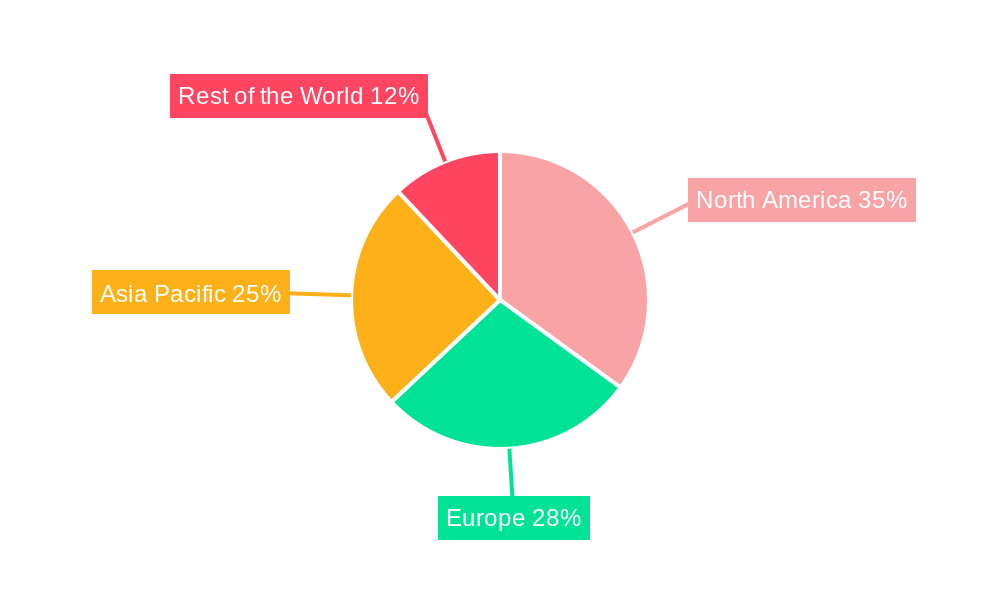
The market segmentation reveals significant opportunities across various categories. Ride-hailing continues to dominate, but shared micromobility is exhibiting rapid growth, driven by its affordability and environmental benefits. The shift towards electric vehicles (EVs) within the shared mobility landscape is also gaining momentum, driven by environmental regulations and technological advancements in battery technology. The business-to-consumer (B2C) model remains the largest segment, but the business-to-business (B2B) segment is showing promise, particularly in corporate transportation solutions and fleet management services. Geographically, North America and Asia Pacific are expected to lead the market, benefiting from strong technological adoption and substantial investments in infrastructure supporting shared mobility initiatives. The competitive landscape is characterized by both established players, like Uber and Ola, and emerging companies innovating within specific segments. The forecast for the market anticipates a sustained high growth trajectory, with continued diversification of services and business models.
Shared Mobility Market: A Comprehensive Report (2019-2033)
This comprehensive report provides an in-depth analysis of the global shared mobility market, encompassing its current state, future trends, and key players. With a study period spanning 2019-2033, a base year of 2025, and a forecast period of 2025-2033, this report offers invaluable insights for industry stakeholders, investors, and strategic decision-makers. The market is projected to reach xx Million by 2033, exhibiting a CAGR of xx% during the forecast period.
Shared Mobility Market Market Dynamics & Concentration
The shared mobility market is characterized by high dynamism and evolving competitive landscapes. Market concentration is moderate, with several major players holding significant shares, but numerous smaller players also competing aggressively. The market is driven by increasing urbanization, growing environmental concerns, and the rising adoption of technology. Stringent regulatory frameworks and evolving safety standards impact market expansion. Product substitutes, like public transport, continue to exist, though shared mobility's convenience and flexibility are significant advantages. End-user preferences are shifting towards sustainable and technology-driven solutions. M&A activity is frequent, reflecting the consolidating nature of the industry. In 2024, approximately xx M&A deals were recorded, indicating a trend of consolidation and expansion. Key players are focused on acquiring smaller firms to broaden their service offerings and geographic reach. For example, the market share of Uber Technologies Inc. in 2024 is estimated at xx%, while Didi Chuxing holds an estimated xx% share in its primary markets.
Shared Mobility Market Industry Trends & Analysis
The shared mobility market is experiencing rapid growth, driven by several factors. Technological advancements, such as the development of autonomous vehicles and sophisticated ride-hailing apps, are enhancing efficiency and convenience. Changing consumer preferences, particularly among younger demographics, favor shared mobility solutions over private car ownership. Increased smartphone penetration and improved mobile internet connectivity are crucial for market expansion. The shift toward shared mobility is fuelled by rising fuel costs and parking limitations in urban areas. The market penetration of shared mobility services is estimated at xx% in 2025 and is projected to reach xx% by 2033. The CAGR of the market during this period is estimated at xx%. Competitive dynamics are intense, with ongoing innovation and aggressive pricing strategies by major players.
Leading Markets & Segments in Shared Mobility Market
The North American and European regions currently dominate the shared mobility market, with strong penetration of ride-hailing and car-sharing services. Asia-Pacific is a rapidly growing region, driven by increasing urbanization and a large population base.
Key Drivers by Segment:
- By Type:
- Ride-Hailing: High demand in urban areas, ease of access through mobile apps.
- Car Sharing: Growing popularity for short-term rentals, particularly among younger demographics and tourists.
- Shared Micromobility: Increased adoption of e-bikes and e-scooters for short-distance commutes.
- Rental and Leasing: A significant segment providing long-term vehicle access.
- Others: Shuttle services and bus services are catering to specific commuting needs.
- By Vehicle Type: Passenger cars remain the dominant vehicle type, followed by two-wheelers which are highly popular in certain regions.
- By Business Model: B2C dominates the market, though B2B is gaining traction in corporate transportation and logistics.
- By Propulsion Type: Internal Combustion Engines (ICE) currently dominate, but a rapid shift toward electric vehicles is underway, driven by environmental concerns and government incentives.
Shared Mobility Market Product Developments
The shared mobility sector showcases continuous innovation, from the development of electric vehicle fleets to the implementation of sophisticated ride-sharing algorithms. Features like real-time tracking, fare estimations, and integrated payment systems enhance user experience. Companies are focusing on improving safety features and introducing subscription models to attract a broader user base. The increasing integration of IoT (Internet of Things) technologies into vehicles and platforms is further enhancing efficiency and data analytics capabilities.
Key Drivers of Shared Mobility Market Growth
The growth of the shared mobility market is driven by several factors. Technological advancements, such as the development of autonomous vehicles and AI-powered ride-matching algorithms, significantly enhance efficiency and reduce operational costs. Favorable government policies, including subsidies and tax incentives for electric vehicle adoption, accelerate market growth. Increasing urbanization and the rising cost of car ownership make shared mobility a more attractive option.
Challenges in the Shared Mobility Market Market
The shared mobility market faces several challenges. Regulatory hurdles vary significantly across regions, leading to operational complexities. Supply chain disruptions, particularly regarding the availability of electric vehicles and charging infrastructure, affect expansion plans. Intense competition and price wars put pressure on profitability. Concerns around driver safety and security, alongside data privacy issues, present ongoing challenges. In 2024, supply chain issues resulted in an estimated xx Million decrease in market value.
Emerging Opportunities in Shared Mobility Market
The shared mobility market presents significant long-term growth opportunities. Technological breakthroughs, such as the development of autonomous vehicles and advanced sensor technologies, are poised to revolutionize the industry. Strategic partnerships between shared mobility providers and traditional automotive companies facilitate seamless integration and improved service offerings. Expansion into new and underserved markets, leveraging emerging economies' growing urban populations, creates vast potential.
Leading Players in the Shared Mobility Market Sector
- BlaBlaCar
- ANI Technologies Pvt Ltd (Ola Cabs)
- Uber Technologies Inc
- Curb Mobility LLC
- Lyft Inc
- Beijing Didi Chuxing Technology Co Ltd
- Cabify
- Zoomcar Holdings
- Revv
- Drive Now (BMW AG)
- Wingz Inc
- Europcar Mobility Group
- Hertz Global Holdings
- Avis Budget Group Inc
- Grab Holdings Inc
Key Milestones in Shared Mobility Market Industry
- December 2023: CarDekho's merger with Revv marks a significant development in India's shared car rental market.
- July 2023: Bolt's announcement of over 100,000 drivers and 9 Million passengers in the UK highlights its substantial growth.
- July 2023: inDrive's expansion into South Florida and planned launch across 15 Nigerian cities demonstrates its global ambition.
Strategic Outlook for Shared Mobility Market Market
The shared mobility market is poised for significant expansion, driven by technological innovation, evolving consumer preferences, and supportive government policies. The integration of autonomous vehicles, improved charging infrastructure, and expansion into new services will shape future growth. Strategic partnerships and mergers will further consolidate the market, leading to more efficient operations and broader service offerings. The focus on sustainability and the development of green mobility solutions will be key to long-term success.
Shared Mobility Market Segmentation
-
1. Type
- 1.1. Ride-Hailing
- 1.2. Car Sharing
- 1.3. Shared Micromobility (E-Bikes, E-Scooters, etc.)
- 1.4. Rental and Leasing
- 1.5. Others (Shuttle Services, Bus Services, etc.)
-
2. Vehicle Type
- 2.1. Passenger Cars
- 2.2. Light Commercial Vehicles (Pickup Vans, etc.)
- 2.3. Buses and Coaches
- 2.4. Two-Wheelers
-
3. Business Model
- 3.1. Peer-to-Peer (P2P)
- 3.2. Business-to-Business (B2B)
- 3.3. Business-to-Consumer (B2C)
-
4. Propulsion Type
- 4.1. Internal Combustion Engine (ICE)
- 4.2. Electric
Shared Mobility Market Segmentation By Geography
-
1. North America
- 1.1. United States
- 1.2. Canada
- 1.3. Rest of North America
-
2. Europe
- 2.1. Germany
- 2.2. United Kingdom
- 2.3. France
- 2.4. Italy
- 2.5. Rest of Europe
-
3. Asia Pacific
- 3.1. China
- 3.2. India
- 3.3. Japan
- 3.4. South Korea
- 3.5. Rest of Asia Pacific
-
4. Rest of the World
- 4.1. South America
- 4.2. Middle East and Africa
Shared Mobility Market REPORT HIGHLIGHTS
| Aspects | Details |
|---|---|
| Study Period | 2019-2033 |
| Base Year | 2024 |
| Estimated Year | 2025 |
| Forecast Period | 2025-2033 |
| Historical Period | 2019-2024 |
| Growth Rate | CAGR of 17.62% from 2019-2033 |
| Segmentation |
|
Table of Contents
- 1. Introduction
- 1.1. Research Scope
- 1.2. Market Segmentation
- 1.3. Research Methodology
- 1.4. Definitions and Assumptions
- 2. Executive Summary
- 2.1. Introduction
- 3. Market Dynamics
- 3.1. Introduction
- 3.2. Market Drivers
- 3.2.1. Increasing Preference of Consumers toward Ride-Hailing Services is Expected to Foster the Growth of the Market
- 3.3. Market Restrains
- 3.3.1. Strict Government Regulations to Govern the Shared Mobility Industry Hampers the Growth of the Market
- 3.4. Market Trends
- 3.4.1. The Passengers Cars Segment is Expected to Gain Traction Between 2024 and 2029
- 4. Market Factor Analysis
- 4.1. Porters Five Forces
- 4.2. Supply/Value Chain
- 4.3. PESTEL analysis
- 4.4. Market Entropy
- 4.5. Patent/Trademark Analysis
- 5. Global Shared Mobility Market Analysis, Insights and Forecast, 2019-2031
- 5.1. Market Analysis, Insights and Forecast - by Type
- 5.1.1. Ride-Hailing
- 5.1.2. Car Sharing
- 5.1.3. Shared Micromobility (E-Bikes, E-Scooters, etc.)
- 5.1.4. Rental and Leasing
- 5.1.5. Others (Shuttle Services, Bus Services, etc.)
- 5.2. Market Analysis, Insights and Forecast - by Vehicle Type
- 5.2.1. Passenger Cars
- 5.2.2. Light Commercial Vehicles (Pickup Vans, etc.)
- 5.2.3. Buses and Coaches
- 5.2.4. Two-Wheelers
- 5.3. Market Analysis, Insights and Forecast - by Business Model
- 5.3.1. Peer-to-Peer (P2P)
- 5.3.2. Business-to-Business (B2B)
- 5.3.3. Business-to-Consumer (B2C)
- 5.4. Market Analysis, Insights and Forecast - by Propulsion Type
- 5.4.1. Internal Combustion Engine (ICE)
- 5.4.2. Electric
- 5.5. Market Analysis, Insights and Forecast - by Region
- 5.5.1. North America
- 5.5.2. Europe
- 5.5.3. Asia Pacific
- 5.5.4. Rest of the World
- 5.1. Market Analysis, Insights and Forecast - by Type
- 6. North America Shared Mobility Market Analysis, Insights and Forecast, 2019-2031
- 6.1. Market Analysis, Insights and Forecast - by Type
- 6.1.1. Ride-Hailing
- 6.1.2. Car Sharing
- 6.1.3. Shared Micromobility (E-Bikes, E-Scooters, etc.)
- 6.1.4. Rental and Leasing
- 6.1.5. Others (Shuttle Services, Bus Services, etc.)
- 6.2. Market Analysis, Insights and Forecast - by Vehicle Type
- 6.2.1. Passenger Cars
- 6.2.2. Light Commercial Vehicles (Pickup Vans, etc.)
- 6.2.3. Buses and Coaches
- 6.2.4. Two-Wheelers
- 6.3. Market Analysis, Insights and Forecast - by Business Model
- 6.3.1. Peer-to-Peer (P2P)
- 6.3.2. Business-to-Business (B2B)
- 6.3.3. Business-to-Consumer (B2C)
- 6.4. Market Analysis, Insights and Forecast - by Propulsion Type
- 6.4.1. Internal Combustion Engine (ICE)
- 6.4.2. Electric
- 6.1. Market Analysis, Insights and Forecast - by Type
- 7. Europe Shared Mobility Market Analysis, Insights and Forecast, 2019-2031
- 7.1. Market Analysis, Insights and Forecast - by Type
- 7.1.1. Ride-Hailing
- 7.1.2. Car Sharing
- 7.1.3. Shared Micromobility (E-Bikes, E-Scooters, etc.)
- 7.1.4. Rental and Leasing
- 7.1.5. Others (Shuttle Services, Bus Services, etc.)
- 7.2. Market Analysis, Insights and Forecast - by Vehicle Type
- 7.2.1. Passenger Cars
- 7.2.2. Light Commercial Vehicles (Pickup Vans, etc.)
- 7.2.3. Buses and Coaches
- 7.2.4. Two-Wheelers
- 7.3. Market Analysis, Insights and Forecast - by Business Model
- 7.3.1. Peer-to-Peer (P2P)
- 7.3.2. Business-to-Business (B2B)
- 7.3.3. Business-to-Consumer (B2C)
- 7.4. Market Analysis, Insights and Forecast - by Propulsion Type
- 7.4.1. Internal Combustion Engine (ICE)
- 7.4.2. Electric
- 7.1. Market Analysis, Insights and Forecast - by Type
- 8. Asia Pacific Shared Mobility Market Analysis, Insights and Forecast, 2019-2031
- 8.1. Market Analysis, Insights and Forecast - by Type
- 8.1.1. Ride-Hailing
- 8.1.2. Car Sharing
- 8.1.3. Shared Micromobility (E-Bikes, E-Scooters, etc.)
- 8.1.4. Rental and Leasing
- 8.1.5. Others (Shuttle Services, Bus Services, etc.)
- 8.2. Market Analysis, Insights and Forecast - by Vehicle Type
- 8.2.1. Passenger Cars
- 8.2.2. Light Commercial Vehicles (Pickup Vans, etc.)
- 8.2.3. Buses and Coaches
- 8.2.4. Two-Wheelers
- 8.3. Market Analysis, Insights and Forecast - by Business Model
- 8.3.1. Peer-to-Peer (P2P)
- 8.3.2. Business-to-Business (B2B)
- 8.3.3. Business-to-Consumer (B2C)
- 8.4. Market Analysis, Insights and Forecast - by Propulsion Type
- 8.4.1. Internal Combustion Engine (ICE)
- 8.4.2. Electric
- 8.1. Market Analysis, Insights and Forecast - by Type
- 9. Rest of the World Shared Mobility Market Analysis, Insights and Forecast, 2019-2031
- 9.1. Market Analysis, Insights and Forecast - by Type
- 9.1.1. Ride-Hailing
- 9.1.2. Car Sharing
- 9.1.3. Shared Micromobility (E-Bikes, E-Scooters, etc.)
- 9.1.4. Rental and Leasing
- 9.1.5. Others (Shuttle Services, Bus Services, etc.)
- 9.2. Market Analysis, Insights and Forecast - by Vehicle Type
- 9.2.1. Passenger Cars
- 9.2.2. Light Commercial Vehicles (Pickup Vans, etc.)
- 9.2.3. Buses and Coaches
- 9.2.4. Two-Wheelers
- 9.3. Market Analysis, Insights and Forecast - by Business Model
- 9.3.1. Peer-to-Peer (P2P)
- 9.3.2. Business-to-Business (B2B)
- 9.3.3. Business-to-Consumer (B2C)
- 9.4. Market Analysis, Insights and Forecast - by Propulsion Type
- 9.4.1. Internal Combustion Engine (ICE)
- 9.4.2. Electric
- 9.1. Market Analysis, Insights and Forecast - by Type
- 10. North America Shared Mobility Market Analysis, Insights and Forecast, 2019-2031
- 10.1. Market Analysis, Insights and Forecast - By Country/Sub-region
- 10.1.1 United States
- 10.1.2 Canada
- 10.1.3 Rest of North America
- 11. Europe Shared Mobility Market Analysis, Insights and Forecast, 2019-2031
- 11.1. Market Analysis, Insights and Forecast - By Country/Sub-region
- 11.1.1 Germany
- 11.1.2 United Kingdom
- 11.1.3 France
- 11.1.4 Italy
- 11.1.5 Rest of Europe
- 12. Asia Pacific Shared Mobility Market Analysis, Insights and Forecast, 2019-2031
- 12.1. Market Analysis, Insights and Forecast - By Country/Sub-region
- 12.1.1 China
- 12.1.2 India
- 12.1.3 Japan
- 12.1.4 South Korea
- 12.1.5 Rest of Asia Pacific
- 13. Rest of the World Shared Mobility Market Analysis, Insights and Forecast, 2019-2031
- 13.1. Market Analysis, Insights and Forecast - By Country/Sub-region
- 13.1.1 South America
- 13.1.2 Middle East and Africa
- 14. Competitive Analysis
- 14.1. Global Market Share Analysis 2024
- 14.2. Company Profiles
- 14.2.1 BlaBlaCar
- 14.2.1.1. Overview
- 14.2.1.2. Products
- 14.2.1.3. SWOT Analysis
- 14.2.1.4. Recent Developments
- 14.2.1.5. Financials (Based on Availability)
- 14.2.2 ANI Technologies Pvt Ltd (Ola Cabs)
- 14.2.2.1. Overview
- 14.2.2.2. Products
- 14.2.2.3. SWOT Analysis
- 14.2.2.4. Recent Developments
- 14.2.2.5. Financials (Based on Availability)
- 14.2.3 Uber Technologies Inc
- 14.2.3.1. Overview
- 14.2.3.2. Products
- 14.2.3.3. SWOT Analysis
- 14.2.3.4. Recent Developments
- 14.2.3.5. Financials (Based on Availability)
- 14.2.4 Curb Mobility LLC
- 14.2.4.1. Overview
- 14.2.4.2. Products
- 14.2.4.3. SWOT Analysis
- 14.2.4.4. Recent Developments
- 14.2.4.5. Financials (Based on Availability)
- 14.2.5 Lyft Inc
- 14.2.5.1. Overview
- 14.2.5.2. Products
- 14.2.5.3. SWOT Analysis
- 14.2.5.4. Recent Developments
- 14.2.5.5. Financials (Based on Availability)
- 14.2.6 Beijing Didi Chuxing Technology Co Ltd
- 14.2.6.1. Overview
- 14.2.6.2. Products
- 14.2.6.3. SWOT Analysis
- 14.2.6.4. Recent Developments
- 14.2.6.5. Financials (Based on Availability)
- 14.2.7 Cabify
- 14.2.7.1. Overview
- 14.2.7.2. Products
- 14.2.7.3. SWOT Analysis
- 14.2.7.4. Recent Developments
- 14.2.7.5. Financials (Based on Availability)
- 14.2.8 Zoomcar Holdings
- 14.2.8.1. Overview
- 14.2.8.2. Products
- 14.2.8.3. SWOT Analysis
- 14.2.8.4. Recent Developments
- 14.2.8.5. Financials (Based on Availability)
- 14.2.9 Revv
- 14.2.9.1. Overview
- 14.2.9.2. Products
- 14.2.9.3. SWOT Analysis
- 14.2.9.4. Recent Developments
- 14.2.9.5. Financials (Based on Availability)
- 14.2.10 Drive Now (BMW AG)
- 14.2.10.1. Overview
- 14.2.10.2. Products
- 14.2.10.3. SWOT Analysis
- 14.2.10.4. Recent Developments
- 14.2.10.5. Financials (Based on Availability)
- 14.2.11 Wingz Inc
- 14.2.11.1. Overview
- 14.2.11.2. Products
- 14.2.11.3. SWOT Analysis
- 14.2.11.4. Recent Developments
- 14.2.11.5. Financials (Based on Availability)
- 14.2.12 Europcar Mobility Group
- 14.2.12.1. Overview
- 14.2.12.2. Products
- 14.2.12.3. SWOT Analysis
- 14.2.12.4. Recent Developments
- 14.2.12.5. Financials (Based on Availability)
- 14.2.13 Hertz Global Holdings
- 14.2.13.1. Overview
- 14.2.13.2. Products
- 14.2.13.3. SWOT Analysis
- 14.2.13.4. Recent Developments
- 14.2.13.5. Financials (Based on Availability)
- 14.2.14 Avis Budget Group Inc
- 14.2.14.1. Overview
- 14.2.14.2. Products
- 14.2.14.3. SWOT Analysis
- 14.2.14.4. Recent Developments
- 14.2.14.5. Financials (Based on Availability)
- 14.2.15 Grab Holdings Inc
- 14.2.15.1. Overview
- 14.2.15.2. Products
- 14.2.15.3. SWOT Analysis
- 14.2.15.4. Recent Developments
- 14.2.15.5. Financials (Based on Availability)
- 14.2.1 BlaBlaCar
List of Figures
- Figure 1: Global Shared Mobility Market Revenue Breakdown (Million, %) by Region 2024 & 2032
- Figure 2: North America Shared Mobility Market Revenue (Million), by Country 2024 & 2032
- Figure 3: North America Shared Mobility Market Revenue Share (%), by Country 2024 & 2032
- Figure 4: Europe Shared Mobility Market Revenue (Million), by Country 2024 & 2032
- Figure 5: Europe Shared Mobility Market Revenue Share (%), by Country 2024 & 2032
- Figure 6: Asia Pacific Shared Mobility Market Revenue (Million), by Country 2024 & 2032
- Figure 7: Asia Pacific Shared Mobility Market Revenue Share (%), by Country 2024 & 2032
- Figure 8: Rest of the World Shared Mobility Market Revenue (Million), by Country 2024 & 2032
- Figure 9: Rest of the World Shared Mobility Market Revenue Share (%), by Country 2024 & 2032
- Figure 10: North America Shared Mobility Market Revenue (Million), by Type 2024 & 2032
- Figure 11: North America Shared Mobility Market Revenue Share (%), by Type 2024 & 2032
- Figure 12: North America Shared Mobility Market Revenue (Million), by Vehicle Type 2024 & 2032
- Figure 13: North America Shared Mobility Market Revenue Share (%), by Vehicle Type 2024 & 2032
- Figure 14: North America Shared Mobility Market Revenue (Million), by Business Model 2024 & 2032
- Figure 15: North America Shared Mobility Market Revenue Share (%), by Business Model 2024 & 2032
- Figure 16: North America Shared Mobility Market Revenue (Million), by Propulsion Type 2024 & 2032
- Figure 17: North America Shared Mobility Market Revenue Share (%), by Propulsion Type 2024 & 2032
- Figure 18: North America Shared Mobility Market Revenue (Million), by Country 2024 & 2032
- Figure 19: North America Shared Mobility Market Revenue Share (%), by Country 2024 & 2032
- Figure 20: Europe Shared Mobility Market Revenue (Million), by Type 2024 & 2032
- Figure 21: Europe Shared Mobility Market Revenue Share (%), by Type 2024 & 2032
- Figure 22: Europe Shared Mobility Market Revenue (Million), by Vehicle Type 2024 & 2032
- Figure 23: Europe Shared Mobility Market Revenue Share (%), by Vehicle Type 2024 & 2032
- Figure 24: Europe Shared Mobility Market Revenue (Million), by Business Model 2024 & 2032
- Figure 25: Europe Shared Mobility Market Revenue Share (%), by Business Model 2024 & 2032
- Figure 26: Europe Shared Mobility Market Revenue (Million), by Propulsion Type 2024 & 2032
- Figure 27: Europe Shared Mobility Market Revenue Share (%), by Propulsion Type 2024 & 2032
- Figure 28: Europe Shared Mobility Market Revenue (Million), by Country 2024 & 2032
- Figure 29: Europe Shared Mobility Market Revenue Share (%), by Country 2024 & 2032
- Figure 30: Asia Pacific Shared Mobility Market Revenue (Million), by Type 2024 & 2032
- Figure 31: Asia Pacific Shared Mobility Market Revenue Share (%), by Type 2024 & 2032
- Figure 32: Asia Pacific Shared Mobility Market Revenue (Million), by Vehicle Type 2024 & 2032
- Figure 33: Asia Pacific Shared Mobility Market Revenue Share (%), by Vehicle Type 2024 & 2032
- Figure 34: Asia Pacific Shared Mobility Market Revenue (Million), by Business Model 2024 & 2032
- Figure 35: Asia Pacific Shared Mobility Market Revenue Share (%), by Business Model 2024 & 2032
- Figure 36: Asia Pacific Shared Mobility Market Revenue (Million), by Propulsion Type 2024 & 2032
- Figure 37: Asia Pacific Shared Mobility Market Revenue Share (%), by Propulsion Type 2024 & 2032
- Figure 38: Asia Pacific Shared Mobility Market Revenue (Million), by Country 2024 & 2032
- Figure 39: Asia Pacific Shared Mobility Market Revenue Share (%), by Country 2024 & 2032
- Figure 40: Rest of the World Shared Mobility Market Revenue (Million), by Type 2024 & 2032
- Figure 41: Rest of the World Shared Mobility Market Revenue Share (%), by Type 2024 & 2032
- Figure 42: Rest of the World Shared Mobility Market Revenue (Million), by Vehicle Type 2024 & 2032
- Figure 43: Rest of the World Shared Mobility Market Revenue Share (%), by Vehicle Type 2024 & 2032
- Figure 44: Rest of the World Shared Mobility Market Revenue (Million), by Business Model 2024 & 2032
- Figure 45: Rest of the World Shared Mobility Market Revenue Share (%), by Business Model 2024 & 2032
- Figure 46: Rest of the World Shared Mobility Market Revenue (Million), by Propulsion Type 2024 & 2032
- Figure 47: Rest of the World Shared Mobility Market Revenue Share (%), by Propulsion Type 2024 & 2032
- Figure 48: Rest of the World Shared Mobility Market Revenue (Million), by Country 2024 & 2032
- Figure 49: Rest of the World Shared Mobility Market Revenue Share (%), by Country 2024 & 2032
List of Tables
- Table 1: Global Shared Mobility Market Revenue Million Forecast, by Region 2019 & 2032
- Table 2: Global Shared Mobility Market Revenue Million Forecast, by Type 2019 & 2032
- Table 3: Global Shared Mobility Market Revenue Million Forecast, by Vehicle Type 2019 & 2032
- Table 4: Global Shared Mobility Market Revenue Million Forecast, by Business Model 2019 & 2032
- Table 5: Global Shared Mobility Market Revenue Million Forecast, by Propulsion Type 2019 & 2032
- Table 6: Global Shared Mobility Market Revenue Million Forecast, by Region 2019 & 2032
- Table 7: Global Shared Mobility Market Revenue Million Forecast, by Country 2019 & 2032
- Table 8: United States Shared Mobility Market Revenue (Million) Forecast, by Application 2019 & 2032
- Table 9: Canada Shared Mobility Market Revenue (Million) Forecast, by Application 2019 & 2032
- Table 10: Rest of North America Shared Mobility Market Revenue (Million) Forecast, by Application 2019 & 2032
- Table 11: Global Shared Mobility Market Revenue Million Forecast, by Country 2019 & 2032
- Table 12: Germany Shared Mobility Market Revenue (Million) Forecast, by Application 2019 & 2032
- Table 13: United Kingdom Shared Mobility Market Revenue (Million) Forecast, by Application 2019 & 2032
- Table 14: France Shared Mobility Market Revenue (Million) Forecast, by Application 2019 & 2032
- Table 15: Italy Shared Mobility Market Revenue (Million) Forecast, by Application 2019 & 2032
- Table 16: Rest of Europe Shared Mobility Market Revenue (Million) Forecast, by Application 2019 & 2032
- Table 17: Global Shared Mobility Market Revenue Million Forecast, by Country 2019 & 2032
- Table 18: China Shared Mobility Market Revenue (Million) Forecast, by Application 2019 & 2032
- Table 19: India Shared Mobility Market Revenue (Million) Forecast, by Application 2019 & 2032
- Table 20: Japan Shared Mobility Market Revenue (Million) Forecast, by Application 2019 & 2032
- Table 21: South Korea Shared Mobility Market Revenue (Million) Forecast, by Application 2019 & 2032
- Table 22: Rest of Asia Pacific Shared Mobility Market Revenue (Million) Forecast, by Application 2019 & 2032
- Table 23: Global Shared Mobility Market Revenue Million Forecast, by Country 2019 & 2032
- Table 24: South America Shared Mobility Market Revenue (Million) Forecast, by Application 2019 & 2032
- Table 25: Middle East and Africa Shared Mobility Market Revenue (Million) Forecast, by Application 2019 & 2032
- Table 26: Global Shared Mobility Market Revenue Million Forecast, by Type 2019 & 2032
- Table 27: Global Shared Mobility Market Revenue Million Forecast, by Vehicle Type 2019 & 2032
- Table 28: Global Shared Mobility Market Revenue Million Forecast, by Business Model 2019 & 2032
- Table 29: Global Shared Mobility Market Revenue Million Forecast, by Propulsion Type 2019 & 2032
- Table 30: Global Shared Mobility Market Revenue Million Forecast, by Country 2019 & 2032
- Table 31: United States Shared Mobility Market Revenue (Million) Forecast, by Application 2019 & 2032
- Table 32: Canada Shared Mobility Market Revenue (Million) Forecast, by Application 2019 & 2032
- Table 33: Rest of North America Shared Mobility Market Revenue (Million) Forecast, by Application 2019 & 2032
- Table 34: Global Shared Mobility Market Revenue Million Forecast, by Type 2019 & 2032
- Table 35: Global Shared Mobility Market Revenue Million Forecast, by Vehicle Type 2019 & 2032
- Table 36: Global Shared Mobility Market Revenue Million Forecast, by Business Model 2019 & 2032
- Table 37: Global Shared Mobility Market Revenue Million Forecast, by Propulsion Type 2019 & 2032
- Table 38: Global Shared Mobility Market Revenue Million Forecast, by Country 2019 & 2032
- Table 39: Germany Shared Mobility Market Revenue (Million) Forecast, by Application 2019 & 2032
- Table 40: United Kingdom Shared Mobility Market Revenue (Million) Forecast, by Application 2019 & 2032
- Table 41: France Shared Mobility Market Revenue (Million) Forecast, by Application 2019 & 2032
- Table 42: Italy Shared Mobility Market Revenue (Million) Forecast, by Application 2019 & 2032
- Table 43: Rest of Europe Shared Mobility Market Revenue (Million) Forecast, by Application 2019 & 2032
- Table 44: Global Shared Mobility Market Revenue Million Forecast, by Type 2019 & 2032
- Table 45: Global Shared Mobility Market Revenue Million Forecast, by Vehicle Type 2019 & 2032
- Table 46: Global Shared Mobility Market Revenue Million Forecast, by Business Model 2019 & 2032
- Table 47: Global Shared Mobility Market Revenue Million Forecast, by Propulsion Type 2019 & 2032
- Table 48: Global Shared Mobility Market Revenue Million Forecast, by Country 2019 & 2032
- Table 49: China Shared Mobility Market Revenue (Million) Forecast, by Application 2019 & 2032
- Table 50: India Shared Mobility Market Revenue (Million) Forecast, by Application 2019 & 2032
- Table 51: Japan Shared Mobility Market Revenue (Million) Forecast, by Application 2019 & 2032
- Table 52: South Korea Shared Mobility Market Revenue (Million) Forecast, by Application 2019 & 2032
- Table 53: Rest of Asia Pacific Shared Mobility Market Revenue (Million) Forecast, by Application 2019 & 2032
- Table 54: Global Shared Mobility Market Revenue Million Forecast, by Type 2019 & 2032
- Table 55: Global Shared Mobility Market Revenue Million Forecast, by Vehicle Type 2019 & 2032
- Table 56: Global Shared Mobility Market Revenue Million Forecast, by Business Model 2019 & 2032
- Table 57: Global Shared Mobility Market Revenue Million Forecast, by Propulsion Type 2019 & 2032
- Table 58: Global Shared Mobility Market Revenue Million Forecast, by Country 2019 & 2032
- Table 59: South America Shared Mobility Market Revenue (Million) Forecast, by Application 2019 & 2032
- Table 60: Middle East and Africa Shared Mobility Market Revenue (Million) Forecast, by Application 2019 & 2032
Frequently Asked Questions
1. What is the projected Compound Annual Growth Rate (CAGR) of the Shared Mobility Market?
The projected CAGR is approximately 17.62%.
2. Which companies are prominent players in the Shared Mobility Market?
Key companies in the market include BlaBlaCar, ANI Technologies Pvt Ltd (Ola Cabs), Uber Technologies Inc, Curb Mobility LLC, Lyft Inc, Beijing Didi Chuxing Technology Co Ltd, Cabify, Zoomcar Holdings, Revv, Drive Now (BMW AG), Wingz Inc, Europcar Mobility Group, Hertz Global Holdings, Avis Budget Group Inc, Grab Holdings Inc.
3. What are the main segments of the Shared Mobility Market?
The market segments include Type, Vehicle Type, Business Model, Propulsion Type.
4. Can you provide details about the market size?
The market size is estimated to be USD 294.69 Million as of 2022.
5. What are some drivers contributing to market growth?
Increasing Preference of Consumers toward Ride-Hailing Services is Expected to Foster the Growth of the Market.
6. What are the notable trends driving market growth?
The Passengers Cars Segment is Expected to Gain Traction Between 2024 and 2029.
7. Are there any restraints impacting market growth?
Strict Government Regulations to Govern the Shared Mobility Industry Hampers the Growth of the Market.
8. Can you provide examples of recent developments in the market?
December 2023: CarDekho announced its merger with Revv, an Indian-based mobility service provider, to venture into India's shared car rental services business by combining the expertise of Car Dekho in technological integration and market understanding of Revv. These two companies aim to disrupt the car rental space in India by facilitating a tech-enabled mobility solution to enhance customers' convenience.
9. What pricing options are available for accessing the report?
Pricing options include single-user, multi-user, and enterprise licenses priced at USD 4750, USD 5250, and USD 8750 respectively.
10. Is the market size provided in terms of value or volume?
The market size is provided in terms of value, measured in Million.
11. Are there any specific market keywords associated with the report?
Yes, the market keyword associated with the report is "Shared Mobility Market," which aids in identifying and referencing the specific market segment covered.
12. How do I determine which pricing option suits my needs best?
The pricing options vary based on user requirements and access needs. Individual users may opt for single-user licenses, while businesses requiring broader access may choose multi-user or enterprise licenses for cost-effective access to the report.
13. Are there any additional resources or data provided in the Shared Mobility Market report?
While the report offers comprehensive insights, it's advisable to review the specific contents or supplementary materials provided to ascertain if additional resources or data are available.
14. How can I stay updated on further developments or reports in the Shared Mobility Market?
To stay informed about further developments, trends, and reports in the Shared Mobility Market, consider subscribing to industry newsletters, following relevant companies and organizations, or regularly checking reputable industry news sources and publications.
Methodology
Step 1 - Identification of Relevant Samples Size from Population Database


Step 2 - Approaches for Defining Global Market Size (Value, Volume* & Price*)

Note*: In applicable scenarios
Step 3 - Data Sources
Primary Research
- Web Analytics
- Survey Reports
- Research Institute
- Latest Research Reports
- Opinion Leaders
Secondary Research
- Annual Reports
- White Paper
- Latest Press Release
- Industry Association
- Paid Database
- Investor Presentations

Step 4 - Data Triangulation
Involves using different sources of information in order to increase the validity of a study
These sources are likely to be stakeholders in a program - participants, other researchers, program staff, other community members, and so on.
Then we put all data in single framework & apply various statistical tools to find out the dynamic on the market.
During the analysis stage, feedback from the stakeholder groups would be compared to determine areas of agreement as well as areas of divergence
